Quadratic Graphs (Edexcel IGCSE Maths B): Revision Note
Exam code: 4MB1

Quadratic Graphs
What is a quadratic graph?
A quadratic graph has the form
where is not zero
What does a quadratic graph look like?
A quadratic graph is a smooth curve with a vertical line of symmetry
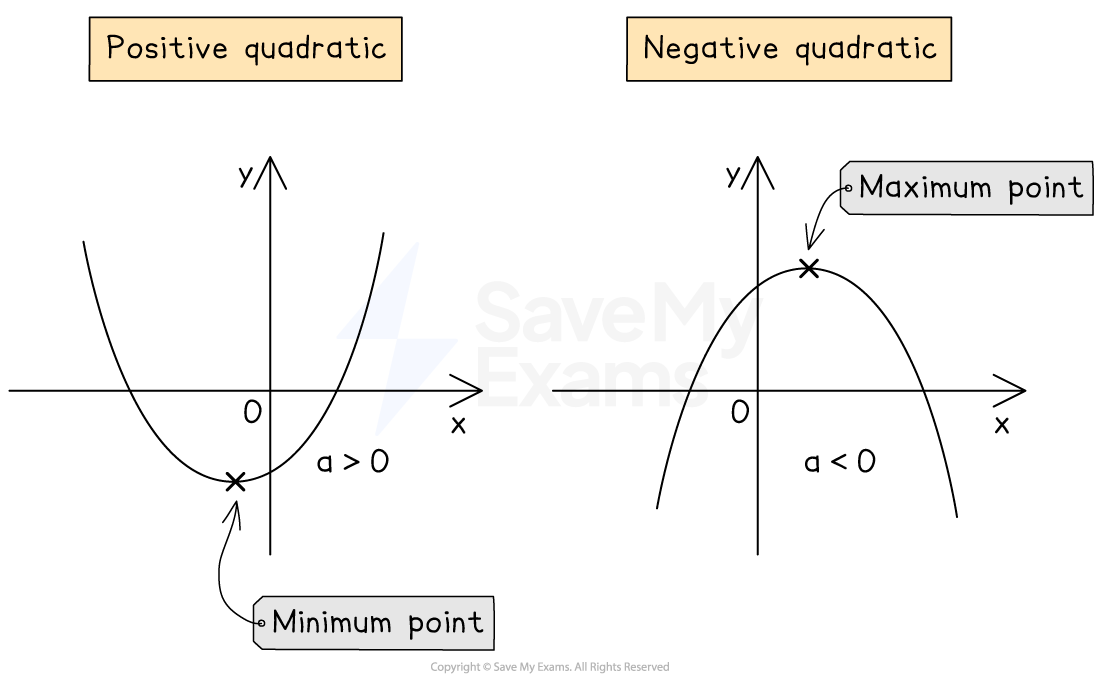
A positive number in front of gives a u-shaped curve
A negative number in front of gives an n-shaped curve
The shape made by a quadratic graph is known as a parabola
A quadratic graph will always cross the -axis
A quadratic graph crosses the -axis twice, once, or not at all
The points where the graph crosses the -axis are called the roots
If the graph is a u-shape, it has a minimum point
If the graph is an n-shape, it has a maximum point
Minimum and maximum points are both examples of a vertex
How do I sketch a quadratic graph?
It is important to know how to sketch a quadratic curve
A simple drawing showing the key features is often sufficient
For a more accurate graph, create a table of values and plot the points
To sketch a quadratic graph:
First sketch the and -axes
Identify the -intercept and mark it on the -axis
The -intercept of will be
It can also be found by substituting in
Find all root(s) (0, 1 or 2) of the equation and mark them on the -axis
The roots will be the solutions to ;
You can find the solutions by factorising or using the quadratic formula
Identify whether the number in is positive or negative
A positive value will result in a u-shape
A negative value will result in an n-shape
Sketch a smooth curve through the and -intercepts
Mark on any axes intercepts
Mark on the coordinates of the maximum/minimum point if you know it
Worked Example
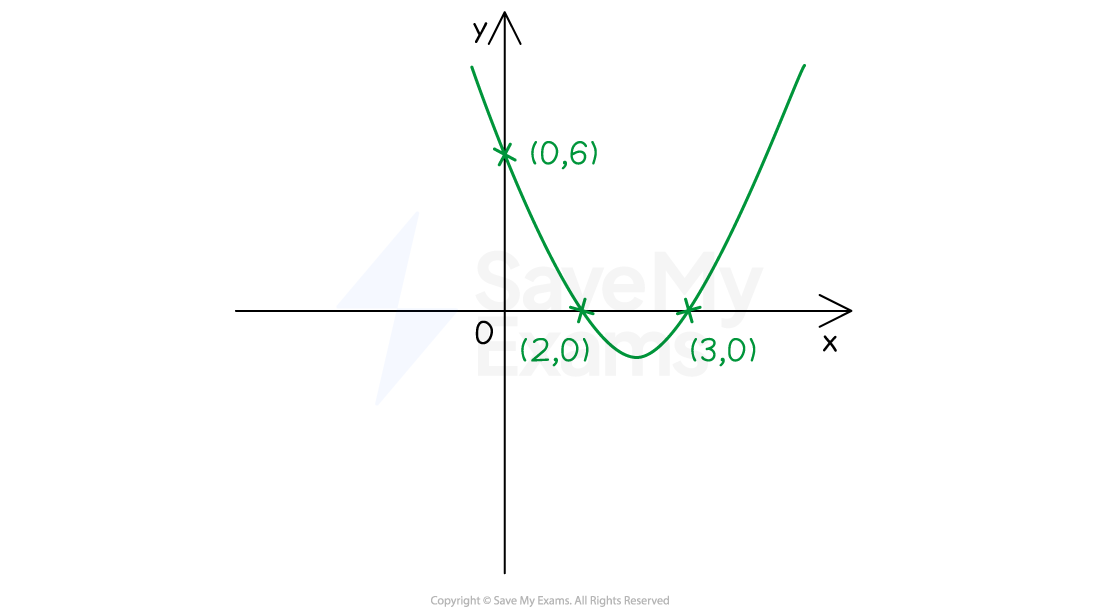
Sketch the graph of showing the and intercepts clearly.
Solution:
The at the end is the -intercept
-intercept: (0, 6)
Factorise the quadratic expression
Solve
So the x-intercepts are given by the coordinates
(2, 0) and (3, 0)
It is a positive quadratic graph, so will be a u-shape
How do I find the coordinates of the vertex?
For a quadratic graph written in the form
the minimum or maximum point has coordinates
Beware: there is a sign change for the -coordinate
A curve with equation , has a minimum point at
A curve with equation , has a minimum point at
The value of does not affect the coordinates of the vertex but it will change the shape of the graph
If it is positive, , the graph will be a u-shape
The curve has a minimum point at
If it is negative, , the graph will be an n-shape
The curve has a maximum point at
Worked Example
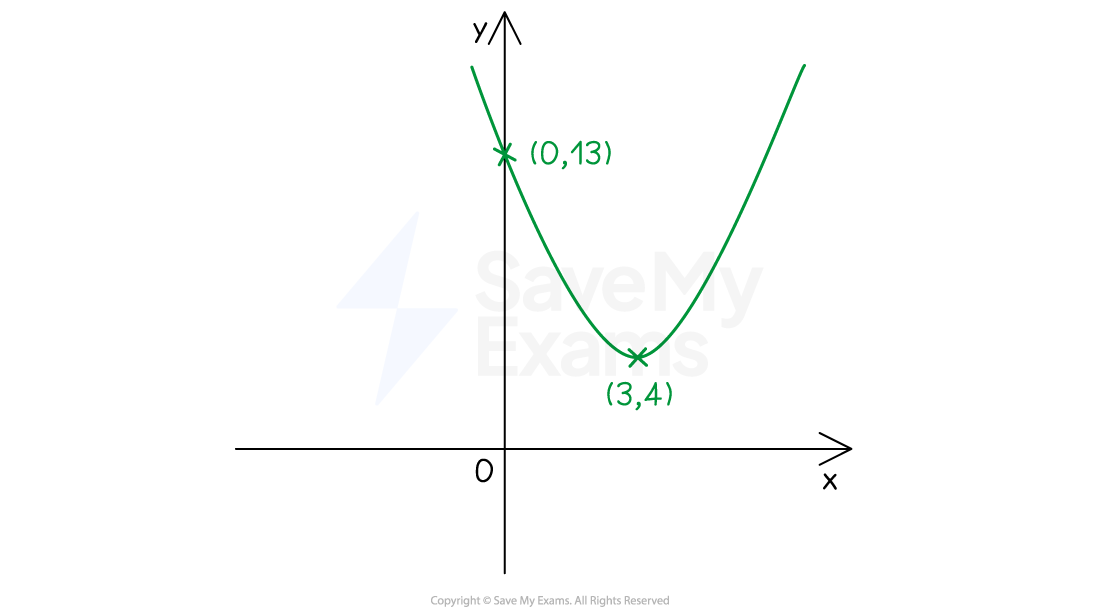
Sketch the graph of showing the -intercept and the coordinates of the vertex.
Answer:
It is a positive quadratic, so will be a u-shape
The vertex will therefore be a minimum
The vertex of has coordinates
The minimum point is therefore
(3, 4)
To find the -intercept, substitute in
-intercept: (0, 13)
As the minimum point is above the -axis, and the curve is a u-shape, this means the graph will not cross the -axis (it has no roots)
How do I find the equation of a quadratic from its graph?
If the vertex and one other point are known
Use the form to fill in and
The vertex is at
Then substitute in the other known point to find
If the roots (-intercepts) and one other point are known
Use the form to fill in and
The roots are at and
Then substitute in the other known point to find
If then you only need either the vertex or the roots
Worked Example
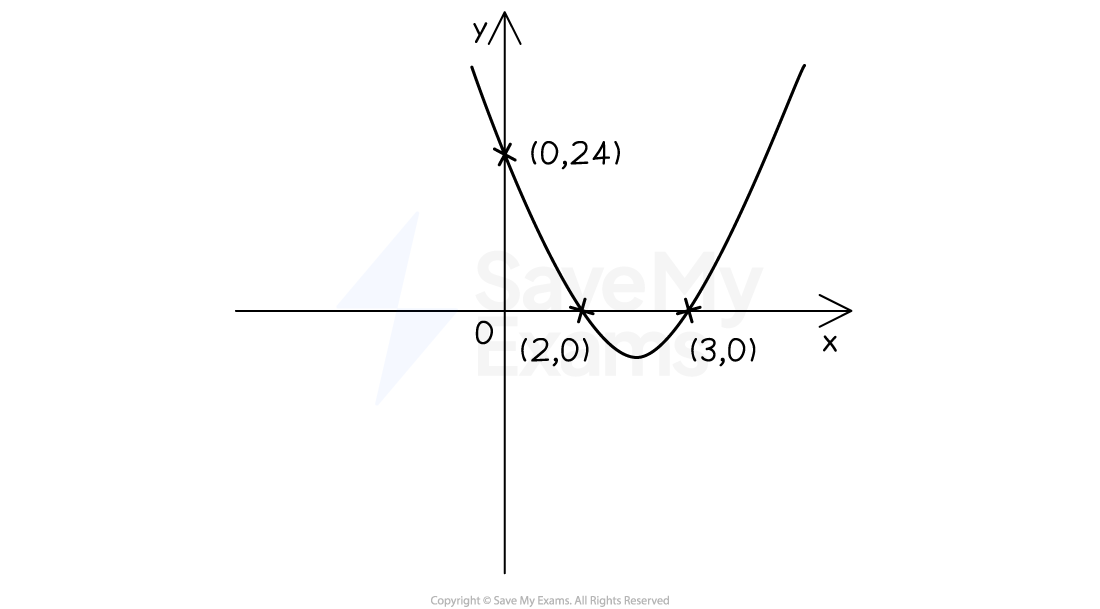
(a) Find the equation of the graph below.
Answer:
The graph shows the roots and a point on the curve (in this case the -intercept)
Use the form to fill in and by inspection
The roots are at and
Substitute in the other known point (0, 24) to find
Write the full equation
You could also write this in expanded form:
(b) Find the equation of the graph below.
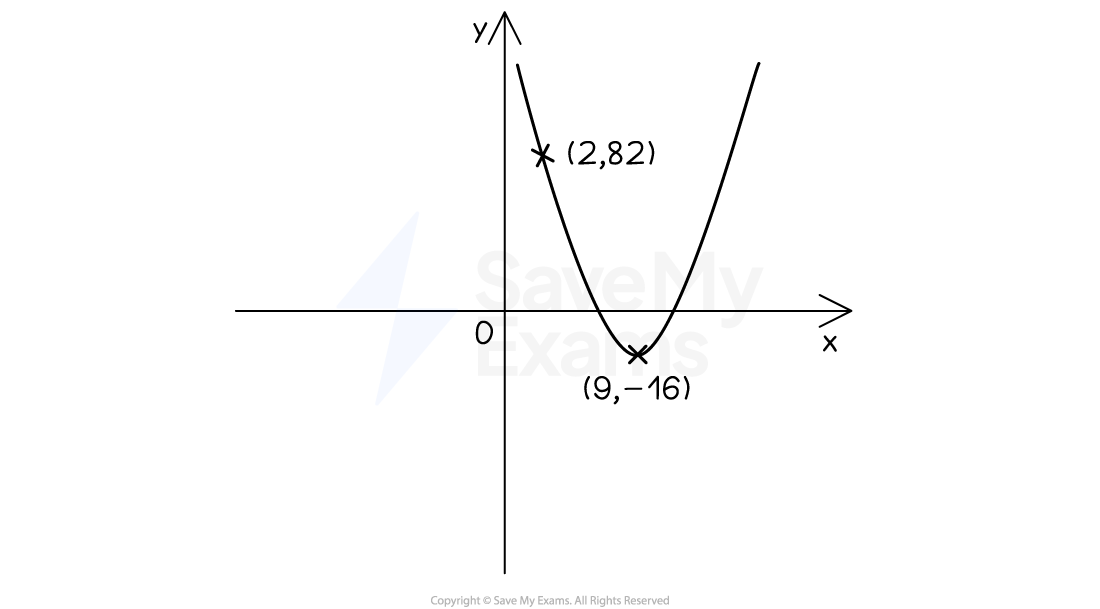
Answer:
The graph shows the vertex and a point on the curve
Use the form to fill in and by inspection
The vertex is at
Substitute in the other known point (2, 82) to find
Write the full equation
You could also write this in expanded form:

Unlock more, it's free!
Join the 100,000+ Students that ❤️ Save My Exams
the (exam) results speak for themselves:

Was this revision note helpful?
Build on this topic
