Representing Inequalities as Regions (Edexcel IGCSE Maths B): Revision Note
Exam code: 4MB1

Finding regions using inequalities
What are 2D inequalities?
A 2D inequality involves two variables
E.g. or
The solution to a 2D inequality is a region in the plane
The solution to a 1D inequality can also be represented as a region in the plane
E.g. represents the region of points that lie on or above the line
How do we draw inequalities on a graph?
A set of 2D inequalities can be shown graphically using straight lines and shaded regions
To draw the correct lines:
Replace the inequality sign with “=” and draw that line
Use a solid line for ≤ or ≥ (to indicate the line is included)
Use dotted line for < or > (to indicate the line is not included)
To decide which side of the line is the wanted side:
if "y ≤ ..." or "y < ..." then the wanted region is below the line
if "y ≥ ..." or "y > ..." then the wanted region is above the line
If you are unsure
substitute the coordinates from a point on one side of the line into the inequality
determine whether or not the inequality holds true on that side
For vertical lines:
the wanted region for is to the left of
the wanted region for is to the right of
To do the shading:
Shade the unwanted sides of each line (unless the question says otherwise)
You are shading away any parts you don't want
This will leave behind a clear region that is the wanted region (rather than trying to look for the wanted region under multiple shades)
Label the wanted region R (unless the question says otherwise)
Worked Example
Show, graphically, the region that is satisfied by all three inequalities below:
Label this region R.
Answer:
First draw the three straight lines: , and
Use your knowledge of Straight Line Graphs,
You may wish to rearrange to the form first
The line is a solid line because of the "≥"
The lines and are dotted lines because of the "<"
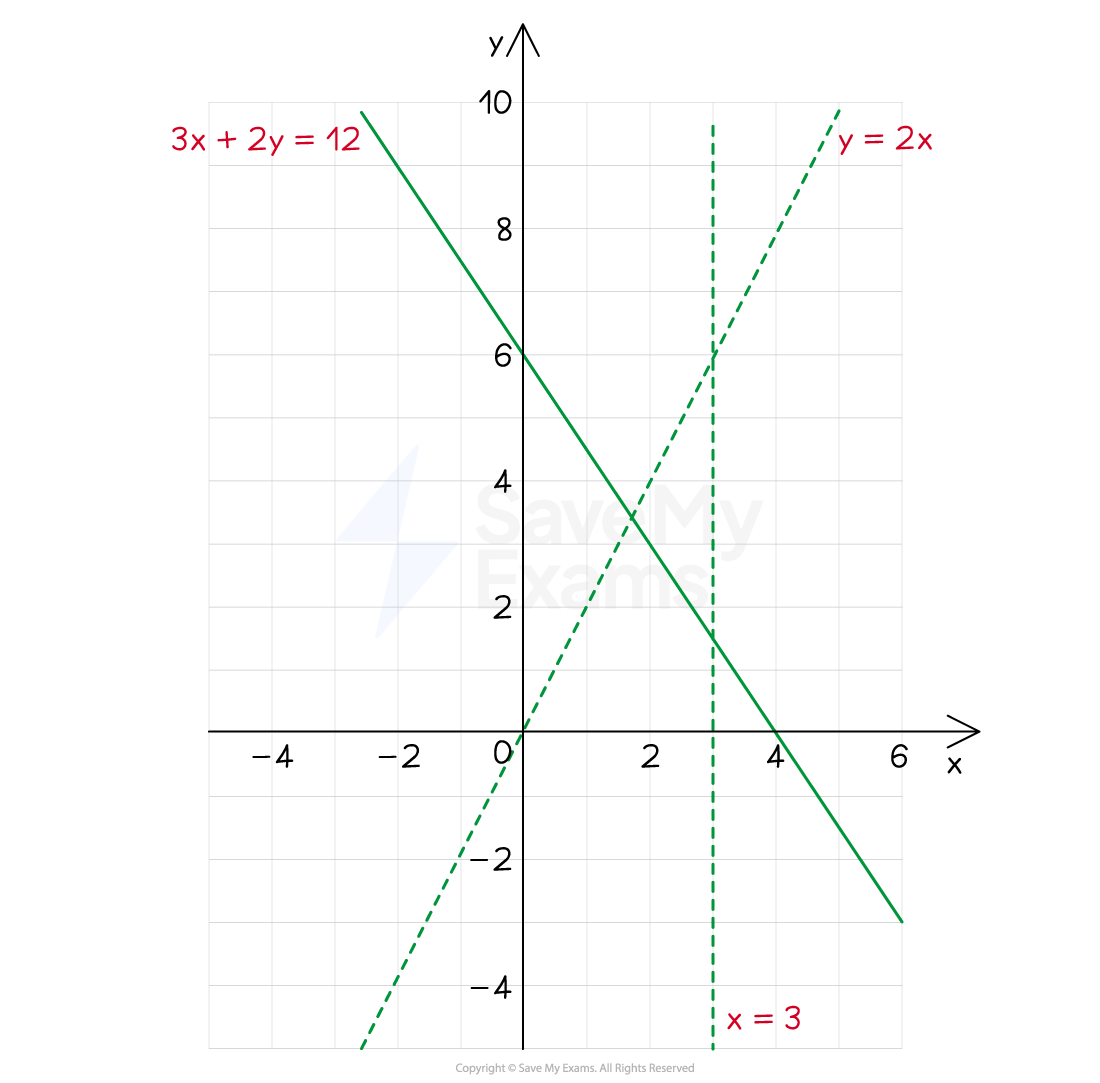
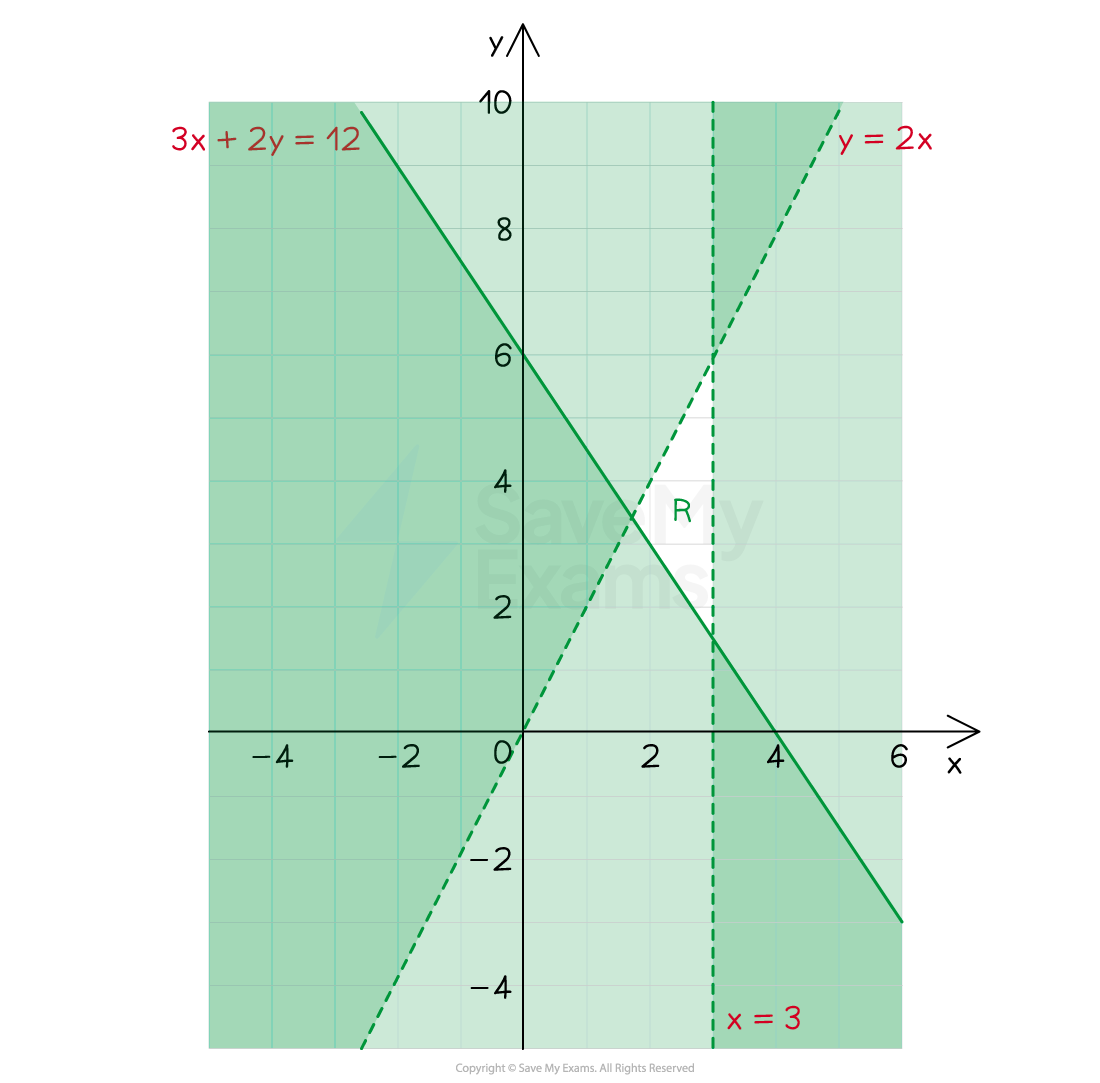
Now we need to shade the unwanted regions
For (or ), the unwanted region is below the line
We can check this with the point (0, 0)
is false therefore (0, 0) does lie in the unwanted region for
For , the unwanted region is above the line
Check with another point, for example (1, 0)
is true, so (1, 0) lies in the wanted (i.e. unshaded) region for
For , shade the unwanted region to the right of
If unsure, check with a point
Finally, don't forget to label the region R

Unlock more, it's free!
Join the 100,000+ Students that ❤️ Save My Exams
the (exam) results speak for themselves:

Was this revision note helpful?
Build on this topic
