Processing Uncertainties (DP IB Physics): Revision Note

Processing uncertainties
What is uncertainty?
Uncertainty is a quantitative indication of the quality of the result
It is the difference between the actual reading taken (caused by the equipment or techniques used) and the true value
It is a range of values around a measurement within which the true value is expected to lie, and is an estimate
Uncertainties are not the same as errors
Errors arise from equipment or practical techniques that cause a reading to be different from the true value
Uncertainties in measurements are recorded as a range (±) to an appropriate level of precision
Table showing different uncertainties
| Uncertainty |
|---|---|
in a reading | ± half the smallest division |
in a measurement | at least ±1 smallest division |
in repeated data | half the range |
in digital readings | ± the last significant digit |
Types of uncertainty
Uncertainty can be expressed in one of three main forms
Absolute uncertainty
The actual amount by which the measurement is uncertain
e.g.if
 = 5.0 ± 0.1 cm, the absolute uncertainty in is
 format('truetype')%3Bfont-weight%3Anormal%3Bfont-style%3Anormal%3B%7D%3C%2Fstyle%3E%3C%2Fdefs%3E%3Ctext%20font-family%3D%22math1ed582716bfb4738ccd92405301%22%20font-size%3D%2216%22%20text-anchor%3D%22middle%22%20x%3D%227.5%22%20y%3D%2216%22%3E%26%23x2206%3B%3C%2Ftext%3E%3Ctext%20font-family%3D%22Times%20New%20Roman%22%20font-size%3D%2218%22%20font-style%3D%22italic%22%20text-anchor%3D%22middle%22%20x%3D%2220.5%22%20y%3D%2216%22%3EL%3C%2Ftext%3E%3C%2Fsvg%3E) = ±0.1 cm
= ±0.1 cm
Fractional uncertainty
The uncertainty in the measurement expressed as a fraction
e.g.if
= 5.0 ± 0.1 cm, the fractional uncertainty in is format('truetype')%3Bfont-weight%3Anormal%3Bfont-style%3Anormal%3B%7D%3C%2Fstyle%3E%3C%2Fdefs%3E%3Cline%20stroke%3D%22%23000000%22%20stroke-linecap%3D%22square%22%20stroke-width%3D%221%22%20x1%3D%222.5%22%20x2%3D%2232.5%22%20y1%3D%2223.5%22%20y2%3D%2223.5%22%2F%3E%3Ctext%20font-family%3D%22math17daed61c5b0df1056b43c7eb17%22%20font-size%3D%2216%22%20text-anchor%3D%22middle%22%20x%3D%2211.5%22%20y%3D%2216%22%3E%26%23x2206%3B%3C%2Ftext%3E%3Ctext%20font-family%3D%22Times%20New%20Roman%22%20font-size%3D%2218%22%20font-style%3D%22italic%22%20text-anchor%3D%22middle%22%20x%3D%2224.5%22%20y%3D%2216%22%3EL%3C%2Ftext%3E%3Ctext%20font-family%3D%22Times%20New%20Roman%22%20font-size%3D%2218%22%20font-style%3D%22italic%22%20text-anchor%3D%22middle%22%20x%3D%2217.5%22%20y%3D%2241%22%3EL%3C%2Ftext%3E%3Ctext%20font-family%3D%22math17daed61c5b0df1056b43c7eb17%22%20font-size%3D%2216%22%20text-anchor%3D%22middle%22%20x%3D%2247.5%22%20y%3D%2230%22%3E%3D%3C%2Ftext%3E%3Cline%20stroke%3D%22%23000000%22%20stroke-linecap%3D%22square%22%20stroke-width%3D%221%22%20x1%3D%2262.5%22%20x2%3D%2288.5%22%20y1%3D%2223.5%22%20y2%3D%2223.5%22%2F%3E%3Ctext%20font-family%3D%22Times%20New%20Roman%22%20font-size%3D%2218%22%20text-anchor%3D%22middle%22%20x%3D%2268.5%22%20y%3D%2216%22%3E0%3C%2Ftext%3E%3Ctext%20font-family%3D%22math17daed61c5b0df1056b43c7eb17%22%20font-size%3D%2216%22%20text-anchor%3D%22middle%22%20x%3D%2275.5%22%20y%3D%2216%22%3E.%3C%2Ftext%3E%3Ctext%20font-family%3D%22Times%20New%20Roman%22%20font-size%3D%2218%22%20text-anchor%3D%22middle%22%20x%3D%2282.5%22%20y%3D%2216%22%3E1%3C%2Ftext%3E%3Ctext%20font-family%3D%22Times%20New%20Roman%22%20font-size%3D%2218%22%20text-anchor%3D%22middle%22%20x%3D%2268.5%22%20y%3D%2241%22%3E5%3C%2Ftext%3E%3Ctext%20font-family%3D%22math17daed61c5b0df1056b43c7eb17%22%20font-size%3D%2216%22%20text-anchor%3D%22middle%22%20x%3D%2275.5%22%20y%3D%2241%22%3E.%3C%2Ftext%3E%3Ctext%20font-family%3D%22Times%20New%20Roman%22%20font-size%3D%2218%22%20text-anchor%3D%22middle%22%20x%3D%2282.5%22%20y%3D%2241%22%3E0%3C%2Ftext%3E%3C%2Fsvg%3E) = ±0.02
= ±0.02
Percentage uncertainty
The uncertainty in the measurement expressed as a percentage
e.g.if
= 5.0 ± 0.1 cm, the percentage uncertainty in is format('truetype')%3Bfont-weight%3Anormal%3Bfont-style%3Anormal%3B%7D%3C%2Fstyle%3E%3C%2Fdefs%3E%3Cline%20stroke%3D%22%23000000%22%20stroke-linecap%3D%22square%22%20stroke-width%3D%221%22%20x1%3D%222.5%22%20x2%3D%2228.5%22%20y1%3D%2223.5%22%20y2%3D%2223.5%22%2F%3E%3Ctext%20font-family%3D%22Times%20New%20Roman%22%20font-size%3D%2218%22%20text-anchor%3D%22middle%22%20x%3D%228.5%22%20y%3D%2216%22%3E0%3C%2Ftext%3E%3Ctext%20font-family%3D%22math17877d8d99e03ab35636d63f0bd%22%20font-size%3D%2216%22%20text-anchor%3D%22middle%22%20x%3D%2215.5%22%20y%3D%2216%22%3E.%3C%2Ftext%3E%3Ctext%20font-family%3D%22Times%20New%20Roman%22%20font-size%3D%2218%22%20text-anchor%3D%22middle%22%20x%3D%2222.5%22%20y%3D%2216%22%3E1%3C%2Ftext%3E%3Ctext%20font-family%3D%22Times%20New%20Roman%22%20font-size%3D%2218%22%20text-anchor%3D%22middle%22%20x%3D%228.5%22%20y%3D%2241%22%3E5%3C%2Ftext%3E%3Ctext%20font-family%3D%22math17877d8d99e03ab35636d63f0bd%22%20font-size%3D%2216%22%20text-anchor%3D%22middle%22%20x%3D%2215.5%22%20y%3D%2241%22%3E.%3C%2Ftext%3E%3Ctext%20font-family%3D%22Times%20New%20Roman%22%20font-size%3D%2218%22%20text-anchor%3D%22middle%22%20x%3D%2222.5%22%20y%3D%2241%22%3E0%3C%2Ftext%3E%3Ctext%20font-family%3D%22math17877d8d99e03ab35636d63f0bd%22%20font-size%3D%2216%22%20text-anchor%3D%22middle%22%20x%3D%2239.5%22%20y%3D%2230%22%3E%26%23xD7%3B%3C%2Ftext%3E%3Ctext%20font-family%3D%22Times%20New%20Roman%22%20font-size%3D%2218%22%20text-anchor%3D%22middle%22%20x%3D%2261.5%22%20y%3D%2230%22%3E100%3C%2Ftext%3E%3C%2Fsvg%3E) = ±2%
= ±2%In general, it is calculated using the following formula:
![]()
How to calculate absolute, fractional and percentage uncertainty

The uncertainties in this reading are:
Absolute
Uncertainty =
format('truetype')%3Bfont-weight%3Anormal%3Bfont-style%3Anormal%3B%7D%3C%2Fstyle%3E%3C%2Fdefs%3E%3Cline%20stroke%3D%22%23000000%22%20stroke-linecap%3D%22square%22%20stroke-width%3D%221%22%20x1%3D%222.5%22%20x2%3D%2228.5%22%20y1%3D%2223.5%22%20y2%3D%2223.5%22%2F%3E%3Ctext%20font-family%3D%22Times%20New%20Roman%22%20font-size%3D%2218%22%20text-anchor%3D%22middle%22%20x%3D%228.5%22%20y%3D%2216%22%3E0%3C%2Ftext%3E%3Ctext%20font-family%3D%22math1d9d4f495e875a2e075a1a4a6e1%22%20font-size%3D%2216%22%20text-anchor%3D%22middle%22%20x%3D%2215.5%22%20y%3D%2216%22%3E.%3C%2Ftext%3E%3Ctext%20font-family%3D%22Times%20New%20Roman%22%20font-size%3D%2218%22%20text-anchor%3D%22middle%22%20x%3D%2222.5%22%20y%3D%2216%22%3E2%3C%2Ftext%3E%3Ctext%20font-family%3D%22Times%20New%20Roman%22%20font-size%3D%2218%22%20text-anchor%3D%22middle%22%20x%3D%2215.5%22%20y%3D%2241%22%3E2%3C%2Ftext%3E%3C%2Fsvg%3E) = 0.1 mA
= 0.1 mAReading = 1.6 ± 0.1 mA
Fractional
Uncertainty =
format('truetype')%3Bfont-weight%3Anormal%3Bfont-style%3Anormal%3B%7D%3C%2Fstyle%3E%3C%2Fdefs%3E%3Cline%20stroke%3D%22%23000000%22%20stroke-linecap%3D%22square%22%20stroke-width%3D%221%22%20x1%3D%222.5%22%20x2%3D%2286.5%22%20y1%3D%2223.5%22%20y2%3D%2223.5%22%2F%3E%3Ctext%20font-family%3D%22Times%20New%20Roman%22%20font-size%3D%2218%22%20text-anchor%3D%22middle%22%20x%3D%2244.5%22%20y%3D%2216%22%3Euncertainty%3C%2Ftext%3E%3Ctext%20font-family%3D%22Times%20New%20Roman%22%20font-size%3D%2218%22%20text-anchor%3D%22middle%22%20x%3D%2244.5%22%20y%3D%2241%22%3Evalue%3C%2Ftext%3E%3Ctext%20font-family%3D%22math11824c643d1feb4da18b28ed527%22%20font-size%3D%2216%22%20text-anchor%3D%22middle%22%20x%3D%22101.5%22%20y%3D%2230%22%3E%3D%3C%2Ftext%3E%3Cline%20stroke%3D%22%23000000%22%20stroke-linecap%3D%22square%22%20stroke-width%3D%221%22%20x1%3D%22116.5%22%20x2%3D%22142.5%22%20y1%3D%2223.5%22%20y2%3D%2223.5%22%2F%3E%3Ctext%20font-family%3D%22Times%20New%20Roman%22%20font-size%3D%2218%22%20text-anchor%3D%22middle%22%20x%3D%22122.5%22%20y%3D%2216%22%3E0%3C%2Ftext%3E%3Ctext%20font-family%3D%22math11824c643d1feb4da18b28ed527%22%20font-size%3D%2216%22%20text-anchor%3D%22middle%22%20x%3D%22129.5%22%20y%3D%2216%22%3E.%3C%2Ftext%3E%3Ctext%20font-family%3D%22Times%20New%20Roman%22%20font-size%3D%2218%22%20text-anchor%3D%22middle%22%20x%3D%22136.5%22%20y%3D%2216%22%3E1%3C%2Ftext%3E%3Ctext%20font-family%3D%22Times%20New%20Roman%22%20font-size%3D%2218%22%20text-anchor%3D%22middle%22%20x%3D%22122.5%22%20y%3D%2241%22%3E1%3C%2Ftext%3E%3Ctext%20font-family%3D%22math11824c643d1feb4da18b28ed527%22%20font-size%3D%2216%22%20text-anchor%3D%22middle%22%20x%3D%22129.5%22%20y%3D%2241%22%3E.%3C%2Ftext%3E%3Ctext%20font-family%3D%22Times%20New%20Roman%22%20font-size%3D%2218%22%20text-anchor%3D%22middle%22%20x%3D%22136.5%22%20y%3D%2241%22%3E6%3C%2Ftext%3E%3Ctext%20font-family%3D%22math11824c643d1feb4da18b28ed527%22%20font-size%3D%2216%22%20text-anchor%3D%22middle%22%20x%3D%22157.5%22%20y%3D%2230%22%3E%3D%3C%2Ftext%3E%3Cline%20stroke%3D%22%23000000%22%20stroke-linecap%3D%22square%22%20stroke-width%3D%221%22%20x1%3D%22172.5%22%20x2%3D%22193.5%22%20y1%3D%2223.5%22%20y2%3D%2223.5%22%2F%3E%3Ctext%20font-family%3D%22Times%20New%20Roman%22%20font-size%3D%2218%22%20text-anchor%3D%22middle%22%20x%3D%22183.5%22%20y%3D%2216%22%3E1%3C%2Ftext%3E%3Ctext%20font-family%3D%22Times%20New%20Roman%22%20font-size%3D%2218%22%20text-anchor%3D%22middle%22%20x%3D%22183.5%22%20y%3D%2241%22%3E16%3C%2Ftext%3E%3C%2Fsvg%3E)
Reading = 1.6 mA ±

Percentage
Uncertainty =
format('truetype')%3Bfont-weight%3Anormal%3Bfont-style%3Anormal%3B%7D%3C%2Fstyle%3E%3C%2Fdefs%3E%3Cline%20stroke%3D%22%23000000%22%20stroke-linecap%3D%22square%22%20stroke-width%3D%221%22%20x1%3D%222.5%22%20x2%3D%2286.5%22%20y1%3D%2223.5%22%20y2%3D%2223.5%22%2F%3E%3Ctext%20font-family%3D%22Times%20New%20Roman%22%20font-size%3D%2218%22%20text-anchor%3D%22middle%22%20x%3D%2244.5%22%20y%3D%2216%22%3Euncertainty%3C%2Ftext%3E%3Ctext%20font-family%3D%22Times%20New%20Roman%22%20font-size%3D%2218%22%20text-anchor%3D%22middle%22%20x%3D%2244.5%22%20y%3D%2241%22%3Evalue%3C%2Ftext%3E%3Ctext%20font-family%3D%22math183d412f76da6ec59341494f003%22%20font-size%3D%2216%22%20text-anchor%3D%22middle%22%20x%3D%2297.5%22%20y%3D%2230%22%3E%26%23xD7%3B%3C%2Ftext%3E%3Ctext%20font-family%3D%22Times%20New%20Roman%22%20font-size%3D%2218%22%20text-anchor%3D%22middle%22%20x%3D%22119.5%22%20y%3D%2230%22%3E100%3C%2Ftext%3E%3Ctext%20font-family%3D%22math183d412f76da6ec59341494f003%22%20font-size%3D%2216%22%20text-anchor%3D%22middle%22%20x%3D%22145.5%22%20y%3D%2230%22%3E%3D%3C%2Ftext%3E%3Cline%20stroke%3D%22%23000000%22%20stroke-linecap%3D%22square%22%20stroke-width%3D%221%22%20x1%3D%22160.5%22%20x2%3D%22186.5%22%20y1%3D%2223.5%22%20y2%3D%2223.5%22%2F%3E%3Ctext%20font-family%3D%22Times%20New%20Roman%22%20font-size%3D%2218%22%20text-anchor%3D%22middle%22%20x%3D%22166.5%22%20y%3D%2216%22%3E0%3C%2Ftext%3E%3Ctext%20font-family%3D%22math183d412f76da6ec59341494f003%22%20font-size%3D%2216%22%20text-anchor%3D%22middle%22%20x%3D%22173.5%22%20y%3D%2216%22%3E.%3C%2Ftext%3E%3Ctext%20font-family%3D%22Times%20New%20Roman%22%20font-size%3D%2218%22%20text-anchor%3D%22middle%22%20x%3D%22180.5%22%20y%3D%2216%22%3E1%3C%2Ftext%3E%3Ctext%20font-family%3D%22Times%20New%20Roman%22%20font-size%3D%2218%22%20text-anchor%3D%22middle%22%20x%3D%22166.5%22%20y%3D%2241%22%3E1%3C%2Ftext%3E%3Ctext%20font-family%3D%22math183d412f76da6ec59341494f003%22%20font-size%3D%2216%22%20text-anchor%3D%22middle%22%20x%3D%22173.5%22%20y%3D%2241%22%3E.%3C%2Ftext%3E%3Ctext%20font-family%3D%22Times%20New%20Roman%22%20font-size%3D%2218%22%20text-anchor%3D%22middle%22%20x%3D%22180.5%22%20y%3D%2241%22%3E6%3C%2Ftext%3E%3Ctext%20font-family%3D%22math183d412f76da6ec59341494f003%22%20font-size%3D%2216%22%20text-anchor%3D%22middle%22%20x%3D%22197.5%22%20y%3D%2230%22%3E%26%23xD7%3B%3C%2Ftext%3E%3Ctext%20font-family%3D%22Times%20New%20Roman%22%20font-size%3D%2218%22%20text-anchor%3D%22middle%22%20x%3D%22219.5%22%20y%3D%2230%22%3E100%3C%2Ftext%3E%3Ctext%20font-family%3D%22math183d412f76da6ec59341494f003%22%20font-size%3D%2216%22%20text-anchor%3D%22middle%22%20x%3D%22245.5%22%20y%3D%2230%22%3E%3D%3C%2Ftext%3E%3Ctext%20font-family%3D%22Times%20New%20Roman%22%20font-size%3D%2218%22%20text-anchor%3D%22middle%22%20x%3D%22262.5%22%20y%3D%2230%22%3E6%3C%2Ftext%3E%3Ctext%20font-family%3D%22math183d412f76da6ec59341494f003%22%20font-size%3D%2216%22%20text-anchor%3D%22middle%22%20x%3D%22269.5%22%20y%3D%2230%22%3E.%3C%2Ftext%3E%3Ctext%20font-family%3D%22Times%20New%20Roman%22%20font-size%3D%2218%22%20text-anchor%3D%22middle%22%20x%3D%22276.5%22%20y%3D%2230%22%3E2%3C%2Ftext%3E%3Ctext%20font-family%3D%22Times%20New%20Roman%22%20font-size%3D%2218%22%20text-anchor%3D%22middle%22%20x%3D%22289.5%22%20y%3D%2230%22%3E%25%3C%2Ftext%3E%3C%2Fsvg%3E)
Reading = 1.6 mA ± 6%
Propagating uncertainties in processed data
Uncertainty propagates in different ways depending on the type of calculation involved
When combining uncertainties, the rules are as follows:
Operation | Example | Propagation Rule |
|---|---|---|
Addition & Subtraction |
|
The sum of the absolute uncertainties |
Multiplication & Division |
|
The sum of the fractional uncertainties |
Power |
|
The magnitude of n times the fractional uncertainty |
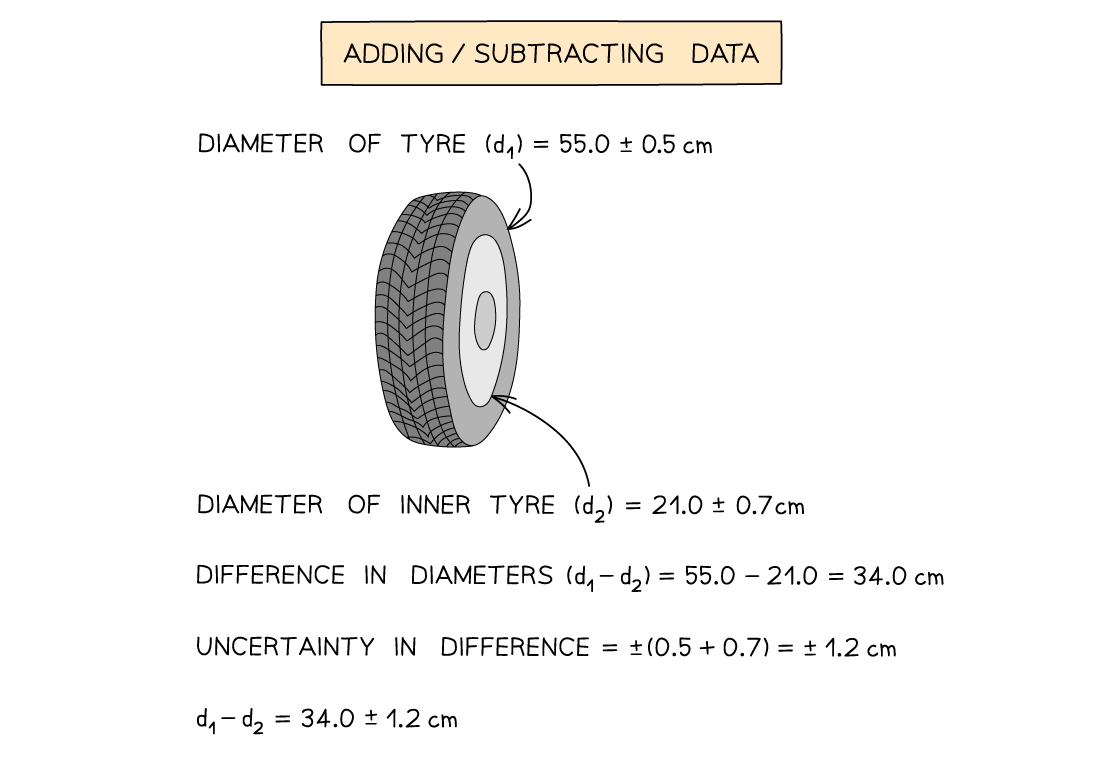
Adding or subtracting measurements
Add together the absolute uncertainties
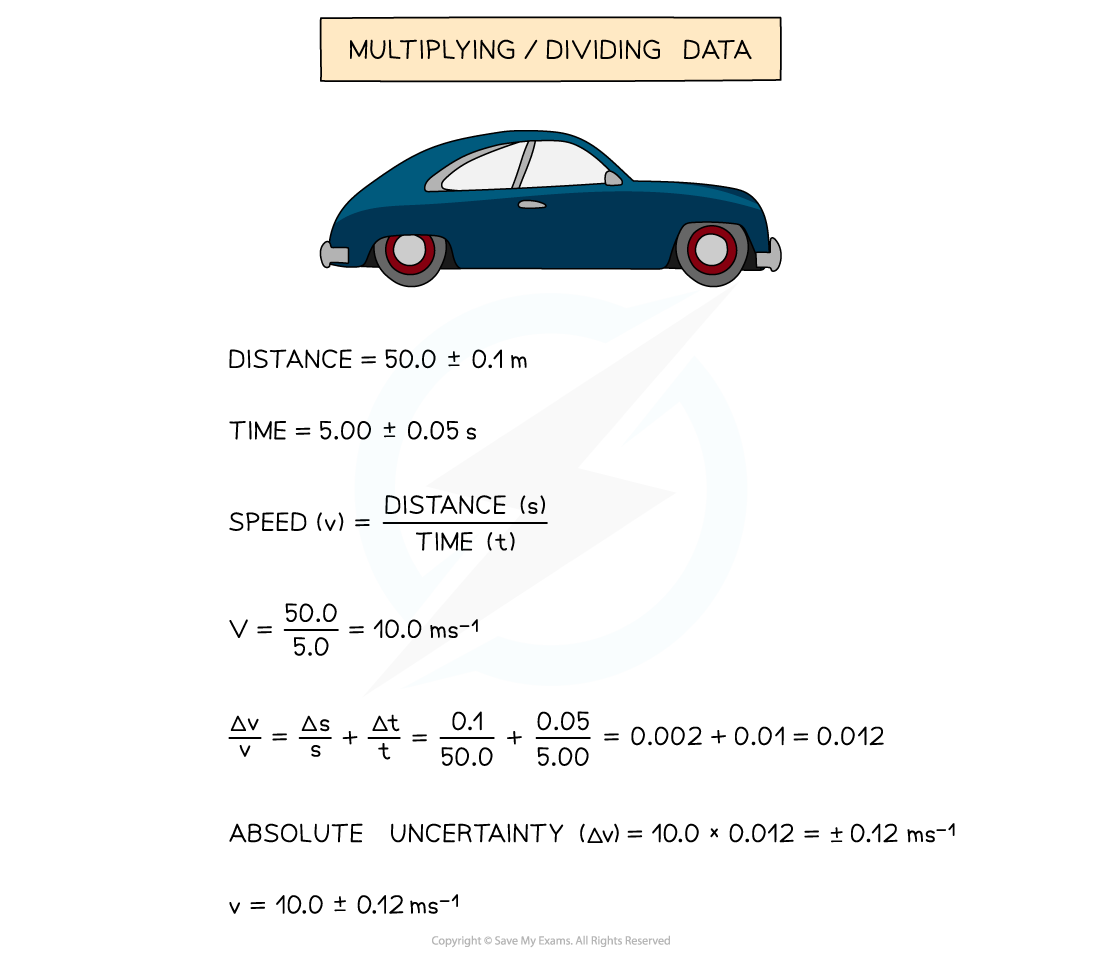
Multiplying or dividing measurements
Add the percentage or fractional uncertainties
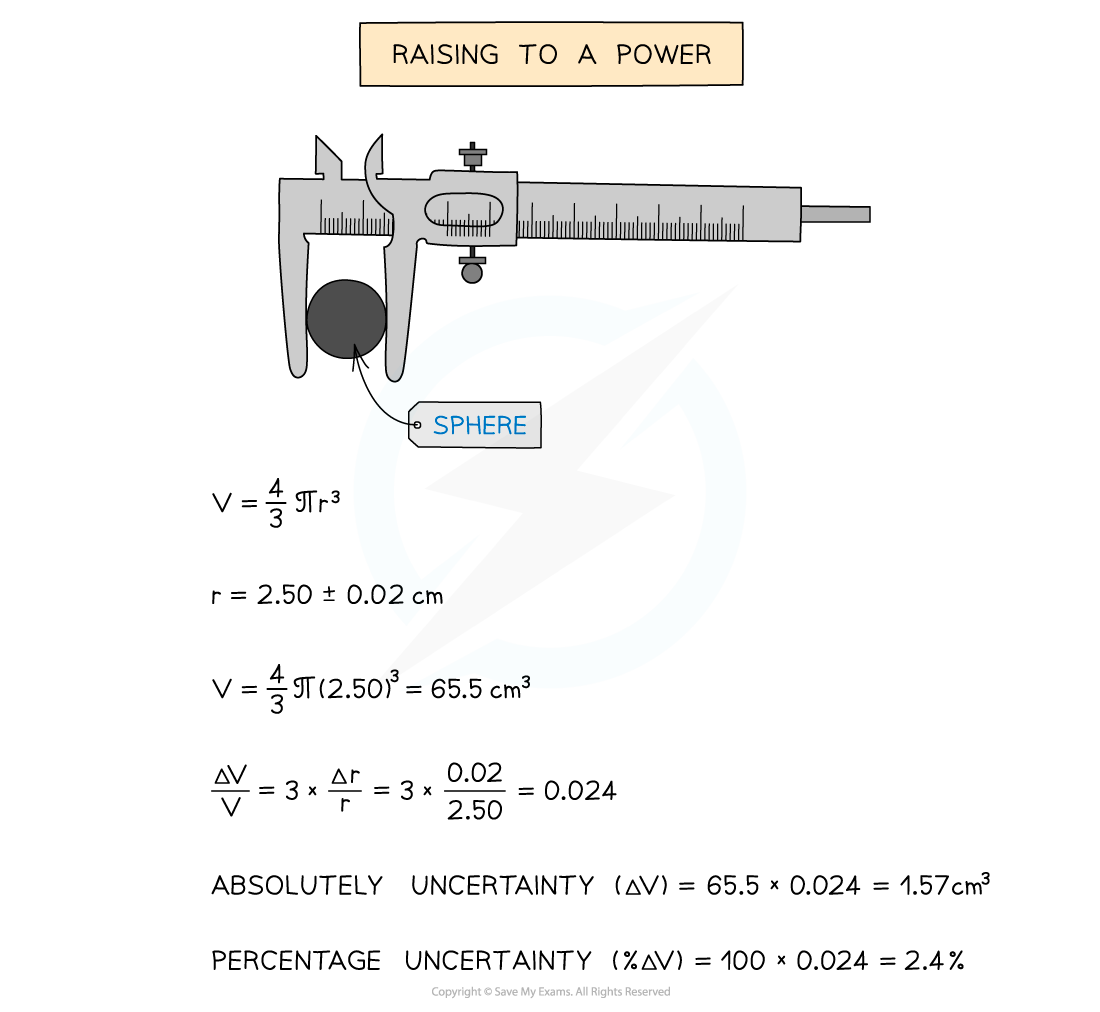
Measurements raised to a power
Multiply the percentage uncertainty by the power
Examiner Tips and Tricks
Remember:
Absolute uncertainties (denoted by Δ) have the same units as the quantity
Fractional and percentage uncertainties have no units
The uncertainty in constants, such as π, is taken to be zero
Uncertainties in trigonometric and logarithmic functions will not be tested in the exam, so just remember these rules and you’ll be fine!
Uncertainties and significant figures
Measurements and processed uncertainties must be expressed to an appropriate number of significant figures
This is because the number of significant figures indicates how precise a measurement is
Rules for determining the number of significant figures:
in an uncertainty: Absolute, percentage, and fractional uncertainties should usually be quoted to one significant figure
e.g. for 7.4 ± 0.2, the percentage uncertainty is ±2.703%, so this should be quoted as ±3% (1 s.f.)
The main exception is when the first digit is 1, then the uncertainty can be quoted to two significant figures
e.g. for 36.4652 ± 5%, the absolute uncertainty is ±1.82326, so this should be quoted as ± 1.8 (2 s.f.)
in a quantity: The number of significant figures must match the precision of the absolute uncertainty
The absolute uncertainty in a quantity defines how many figures are significant
A quantity and its uncertainty must be quoted to the same number of decimal places
A final calculated value must be rounded so its least significant digit aligns with the uncertainty’s place value
e.g. for 36.4652 ± 5%, the final result should be quoted as 36.5 ± 1.8
in raw data: The number of significant figures should be consistent with the resolution of the measuring instrument, e.g.
for a metre rule (resolution ±1 mm), measurements should be given to 1 mm, e.g. 15 ± 1 mm
for a pair of Vernier callipers (resolution ±0.1 mm), measurements should be given to 0.1 mm, e.g. 15.4 ± 0.1 mm
for a micrometer (resolution ±0.01 mm), measurements should be given to 0.01 mm, e.g. 15.42 ± 0.01 mm
in processed data: Calculated values should have no more significant figures than the least precise measurement
e.g. for the set of raw data 5.11, 5.14, 5.12, 5.10, the mean value is 5.1175, so this should be quoted to 3 significant figures, i.e. 5.12
Worked Example
A student obtains the following results in an experiment to determine the angular frequency ![]() of a rotating disc.
of a rotating disc.
Reading | 1 | 2 | 3 | 4 | 5 |
|---|---|---|---|---|---|
ω / rad s-1 | 0.154 | 0.153 | 0.159 | 0.147 | 0.152 |
Calculate the percentage uncertainty in the mean value of ![]() .
.
Answer:
Step 1: Calculate the mean value of ![]()
mean ![]() = 0.153 rad s–1
= 0.153 rad s–1
Step 2: Calculate the uncertainty in ![]()
uncertainty in data = ![]() × range
× range
uncertainty in ![]() × (0.159 – 0.147) = ±0.006 rad s–1
× (0.159 – 0.147) = ±0.006 rad s–1
Step 3: Calculate the percentage uncertainty in ![]()
% uncertainty = ![]() × 100
× 100
% uncertainty in ![]() × 100 = 3.92 = 4%
× 100 = 3.92 = 4%
![]() = 0.153 rad s–1 ± 4%
= 0.153 rad s–1 ± 4%
Examiner Tips and Tricks
Remember:
Uncertainties should always be quoted to one significant figure, unless the first digit is 1, then they can be quoted to two significant figures
The number of significant figures in the final result must be rounded to match the precision of the absolute uncertainty
In the worked example, the percentage uncertainty can be rounded to 1 s.f. as this is sufficient for the level of precision of the final result and its uncertainty. This can be seen by working backwards to determine the absolute uncertainty in ![]() = 0.153 × 0.04 = 0.00612. To one significant figure, this is 0.006, so no information is lost.
= 0.153 × 0.04 = 0.00612. To one significant figure, this is 0.006, so no information is lost.

Unlock more, it's free!
Did this page help you?
