Processing Uncertainties in Chemistry (DP IB Chemistry): Revision Note

Processing uncertainties in chemistry
What is uncertainty?
Uncertainty is quantitative indication of the quality of the result
It is the difference between the actual reading taken (caused by the equipment or techniques used) and the true value
It is a range of values around a measurement within which the true value is expected to lie and is an estimate
Uncertainties are not the same as errors
Errors arise from equipment or practical techniques that cause a reading to be different from the true value
Uncertainties in measurements are recorded as a range (±) to an appropriate level of precision
Table showing different uncertainties
| Uncertainty |
|---|---|
in a reading | ± half the smallest division |
in a measurement | at least ±1 smallest division |
in repeated data | half the range |
in digital readings | ± the last significant digit |
Types of uncertainty
Uncertainty is grouped into three main types:
Absolute uncertainty
The actual amount by which the quantity is uncertain
e.g.if v = 5.0 ± 0.1 cm, the absolute uncertainty in v is 0.1 cm
Fractional uncertainty
The absolute uncertainty divided by the quantity itself
e.g.if v = 5.0 ± 0.1 cm, the fractional uncertainty in v is
format('truetype')%3Bfont-weight%3Anormal%3Bfont-style%3Anormal%3B%7D%3C%2Fstyle%3E%3C%2Fdefs%3E%3Cline%20stroke%3D%22%23000%22%20stroke-linecap%3D%22square%22%20stroke-width%3D%221%22%20x1%3D%222.5%22%20x2%3D%2224.5%22%20y1%3D%2219.5%22%20y2%3D%2219.5%22%2F%3E%3Ctext%20font-family%3D%22Arial%22%20font-size%3D%2214%22%20text-anchor%3D%22middle%22%20x%3D%227.5%22%20y%3D%2214%22%3E0%3C%2Ftext%3E%3Ctext%20font-family%3D%22math1d9d4f495e875a2e075a1a4a6e1%22%20font-size%3D%2214%22%20text-anchor%3D%22middle%22%20x%3D%2213.5%22%20y%3D%2214%22%3E.%3C%2Ftext%3E%3Ctext%20font-family%3D%22Arial%22%20font-size%3D%2214%22%20text-anchor%3D%22middle%22%20x%3D%2220.5%22%20y%3D%2214%22%3E1%3C%2Ftext%3E%3Ctext%20font-family%3D%22Arial%22%20font-size%3D%2214%22%20text-anchor%3D%22middle%22%20x%3D%227.5%22%20y%3D%2235%22%3E5%3C%2Ftext%3E%3Ctext%20font-family%3D%22math1d9d4f495e875a2e075a1a4a6e1%22%20font-size%3D%2214%22%20text-anchor%3D%22middle%22%20x%3D%2213.5%22%20y%3D%2235%22%3E.%3C%2Ftext%3E%3Ctext%20font-family%3D%22Arial%22%20font-size%3D%2214%22%20text-anchor%3D%22middle%22%20x%3D%2220.5%22%20y%3D%2235%22%3E0%3C%2Ftext%3E%3C%2Fsvg%3E) =
= 
Percentage uncertainty
The ratio of the expanded uncertainty to the measured quantity on a scale relative to 100%
This is calculated using the following formula:
Percentage uncertainty = ![]()
How to calculate absolute, fractional and percentage uncertainty
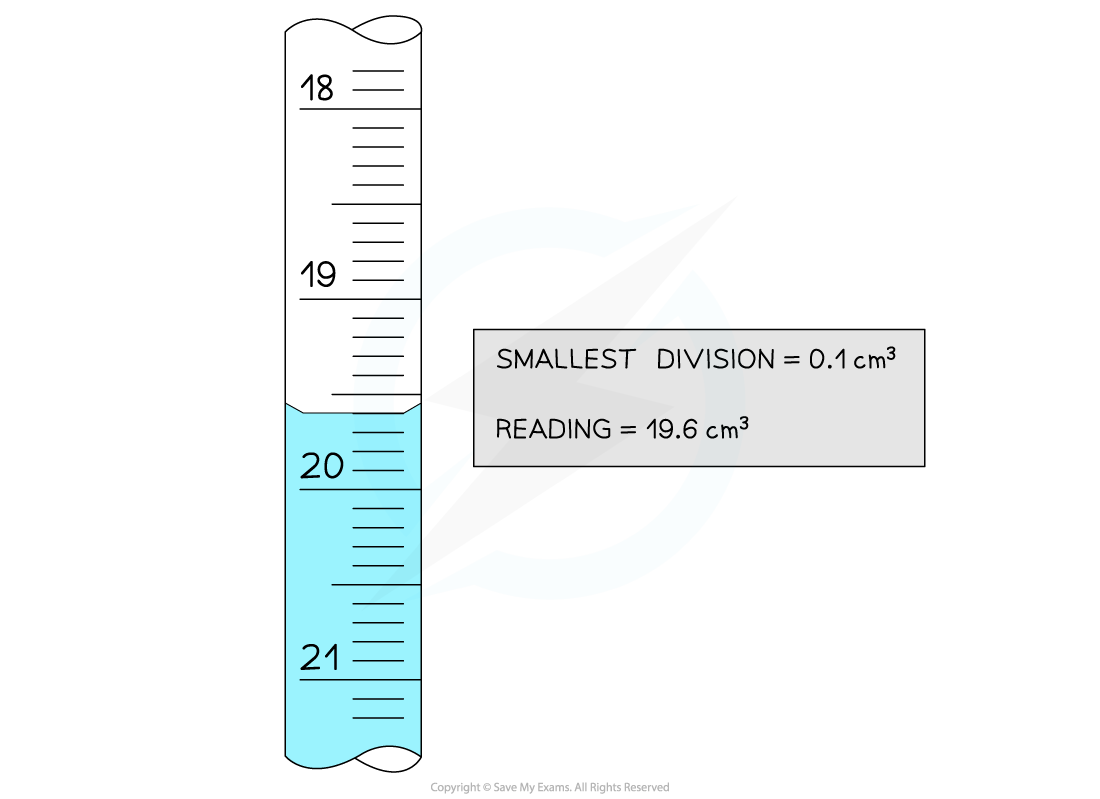
The uncertainties in this reading are:
Absolute
Uncertainty =
format('truetype')%3Bfont-weight%3Anormal%3Bfont-style%3Anormal%3B%7D%3C%2Fstyle%3E%3C%2Fdefs%3E%3Cline%20stroke%3D%22%23000%22%20stroke-linecap%3D%22square%22%20stroke-width%3D%221%22%20x1%3D%222.5%22%20x2%3D%2224.5%22%20y1%3D%2219.5%22%20y2%3D%2219.5%22%2F%3E%3Ctext%20font-family%3D%22Arial%22%20font-size%3D%2214%22%20text-anchor%3D%22middle%22%20x%3D%227.5%22%20y%3D%2214%22%3E0%3C%2Ftext%3E%3Ctext%20font-family%3D%22math1d9d4f495e875a2e075a1a4a6e1%22%20font-size%3D%2214%22%20text-anchor%3D%22middle%22%20x%3D%2213.5%22%20y%3D%2214%22%3E.%3C%2Ftext%3E%3Ctext%20font-family%3D%22Arial%22%20font-size%3D%2214%22%20text-anchor%3D%22middle%22%20x%3D%2220.5%22%20y%3D%2214%22%3E1%3C%2Ftext%3E%3Ctext%20font-family%3D%22Arial%22%20font-size%3D%2214%22%20text-anchor%3D%22middle%22%20x%3D%2214.5%22%20y%3D%2234%22%3E2%3C%2Ftext%3E%3C%2Fsvg%3E) = 0.05 cm3
= 0.05 cm3 Reading = 19.6 ± 0.05 cm3
Fractional
Uncertainty =
 =
= format('truetype')%3Bfont-weight%3Anormal%3Bfont-style%3Anormal%3B%7D%3C%2Fstyle%3E%3C%2Fdefs%3E%3Cline%20stroke%3D%22%23000%22%20stroke-linecap%3D%22square%22%20stroke-width%3D%221%22%20x1%3D%222.5%22%20x2%3D%2232.5%22%20y1%3D%2219.5%22%20y2%3D%2219.5%22%2F%3E%3Ctext%20font-family%3D%22Arial%22%20font-size%3D%2214%22%20text-anchor%3D%22middle%22%20x%3D%2211.5%22%20y%3D%2214%22%3E0%3C%2Ftext%3E%3Ctext%20font-family%3D%22math1d9d4f495e875a2e075a1a4a6e1%22%20font-size%3D%2214%22%20text-anchor%3D%22middle%22%20x%3D%2217.5%22%20y%3D%2214%22%3E.%3C%2Ftext%3E%3Ctext%20font-family%3D%22Arial%22%20font-size%3D%2214%22%20text-anchor%3D%22middle%22%20x%3D%2224.5%22%20y%3D%2214%22%3E1%3C%2Ftext%3E%3Ctext%20font-family%3D%22Arial%22%20font-size%3D%2214%22%20text-anchor%3D%22middle%22%20x%3D%2211.5%22%20y%3D%2235%22%3E19%3C%2Ftext%3E%3Ctext%20font-family%3D%22math1d9d4f495e875a2e075a1a4a6e1%22%20font-size%3D%2214%22%20text-anchor%3D%22middle%22%20x%3D%2221.5%22%20y%3D%2235%22%3E.%3C%2Ftext%3E%3Ctext%20font-family%3D%22Arial%22%20font-size%3D%2214%22%20text-anchor%3D%22middle%22%20x%3D%2228.5%22%20y%3D%2235%22%3E6%3C%2Ftext%3E%3C%2Fsvg%3E) =
=  cm3
cm3
Percentage
Uncertainty =
format('truetype')%3Bfont-weight%3Anormal%3Bfont-style%3Anormal%3B%7D%3C%2Fstyle%3E%3C%2Fdefs%3E%3Cline%20stroke%3D%22%23000%22%20stroke-linecap%3D%22square%22%20stroke-width%3D%221%22%20x1%3D%222.5%22%20x2%3D%2271.5%22%20y1%3D%2218.5%22%20y2%3D%2218.5%22%2F%3E%3Ctext%20font-family%3D%22Arial%22%20font-size%3D%2214%22%20text-anchor%3D%22middle%22%20x%3D%2237.5%22%20y%3D%2213%22%3Euncertainty%3C%2Ftext%3E%3Ctext%20font-family%3D%22Arial%22%20font-size%3D%2214%22%20text-anchor%3D%22middle%22%20x%3D%2237.5%22%20y%3D%2233%22%3Evalue%3C%2Ftext%3E%3Ctext%20font-family%3D%22math13b8a614226a953a8cd9526fca6%22%20font-size%3D%2214%22%20text-anchor%3D%22middle%22%20x%3D%2281.5%22%20y%3D%2223%22%3E%26%23xD7%3B%3C%2Ftext%3E%3Ctext%20font-family%3D%22Arial%22%20font-size%3D%2214%22%20text-anchor%3D%22middle%22%20x%3D%2299.5%22%20y%3D%2223%22%3E100%3C%2Ftext%3E%3C%2Fsvg%3E) =
= format('truetype')%3Bfont-weight%3Anormal%3Bfont-style%3Anormal%3B%7D%3C%2Fstyle%3E%3C%2Fdefs%3E%3Cline%20stroke%3D%22%23000%22%20stroke-linecap%3D%22square%22%20stroke-width%3D%221%22%20x1%3D%222.5%22%20x2%3D%2232.5%22%20y1%3D%2219.5%22%20y2%3D%2219.5%22%2F%3E%3Ctext%20font-family%3D%22Arial%22%20font-size%3D%2214%22%20text-anchor%3D%22middle%22%20x%3D%2211.5%22%20y%3D%2214%22%3E0%3C%2Ftext%3E%3Ctext%20font-family%3D%22math17877d8d99e03ab35636d63f0bd%22%20font-size%3D%2214%22%20text-anchor%3D%22middle%22%20x%3D%2217.5%22%20y%3D%2214%22%3E.%3C%2Ftext%3E%3Ctext%20font-family%3D%22Arial%22%20font-size%3D%2214%22%20text-anchor%3D%22middle%22%20x%3D%2224.5%22%20y%3D%2214%22%3E1%3C%2Ftext%3E%3Ctext%20font-family%3D%22Arial%22%20font-size%3D%2214%22%20text-anchor%3D%22middle%22%20x%3D%2211.5%22%20y%3D%2235%22%3E19%3C%2Ftext%3E%3Ctext%20font-family%3D%22math17877d8d99e03ab35636d63f0bd%22%20font-size%3D%2214%22%20text-anchor%3D%22middle%22%20x%3D%2221.5%22%20y%3D%2235%22%3E.%3C%2Ftext%3E%3Ctext%20font-family%3D%22Arial%22%20font-size%3D%2214%22%20text-anchor%3D%22middle%22%20x%3D%2228.5%22%20y%3D%2235%22%3E6%3C%2Ftext%3E%3Ctext%20font-family%3D%22math17877d8d99e03ab35636d63f0bd%22%20font-size%3D%2214%22%20text-anchor%3D%22middle%22%20x%3D%2242.5%22%20y%3D%2224%22%3E%26%23xD7%3B%3C%2Ftext%3E%3Ctext%20font-family%3D%22Arial%22%20font-size%3D%2214%22%20text-anchor%3D%22middle%22%20x%3D%2260.5%22%20y%3D%2224%22%3E100%3C%2Ftext%3E%3C%2Fsvg%3E) = 0.5%
= 0.5%Reading = 19.6 ± 0.5% cm3
Propagating uncertainties in processed data
Uncertainty propagates in different ways depending on the type of calculation involved
Adding or subtracting measurements
When you are adding or subtracting two measurements then you add together the absolute measurement uncertainties
For example:
Using a balance to measure the initial and final mass of a container
Using a thermometer to measure the temperature at the start and end
Using a burette to measure the initial and final readings
In all of these cases, the instrument is read twice to obtain the final value (e.g. change in mass, temperature, or volume)
If the measurement is uncertain by a fixed amount each time, then the total uncertainty is potentially doubled
For example:
If each reading has an uncertainty of ±0.1 g, the total uncertainty becomes ±0.2 g
Multiplying or dividing measurements
When you multiply or divide experimental measurements then you add together the percentage uncertainties
You can then calculate the absolute uncertainty from the sum of the percentage uncertainties
Exponential measurements (HL only)
When experimental measurements are raised to a power, you multiply the fractional or percentage uncertainty by the power
The coefficient of determination, R2
The coefficient of determination is a measure of fit that can be applied to lines and curves on graphs
The coefficient of determination is written as R2
It is used to evaluate the fit of a trend line / curve:
R2 = 0
The dependent variable cannot be predicted from the independent variable.
R² is usually greater than or equal to zero
R2 between 0 and 1
The dependent variable can be predicted from the independent variable, although the degree of success depends on the value of R2
The closer to 1, the better the fit of the trend line / curve
R2 = 1
The dependent variable can be predicted from the independent variable
The trend line / curve is perfect
Note: This does not guarantee that the trend line / curve is a good model for the relationship between the dependent and independent variables

Unlock more, it's free!
Join the 100,000+ Students that ❤️ Save My Exams
the (exam) results speak for themselves:

Was this revision note helpful?
