Force–Extension Graphs (AQA GCSE Combined Science: Trilogy): Revision Note
Exam code: 8464

Written by: Ashika
Updated on
Linear & Non-Linear Extension
Hooke’s law is the linear relationship between force and extension
This is represented by a straight line on a force-extension graph
Materials that do not obey Hooke's law, i.e force and extension are no longer directly proportional; they have a non-linear relationship
This is represented by a curve on a force-extension graph
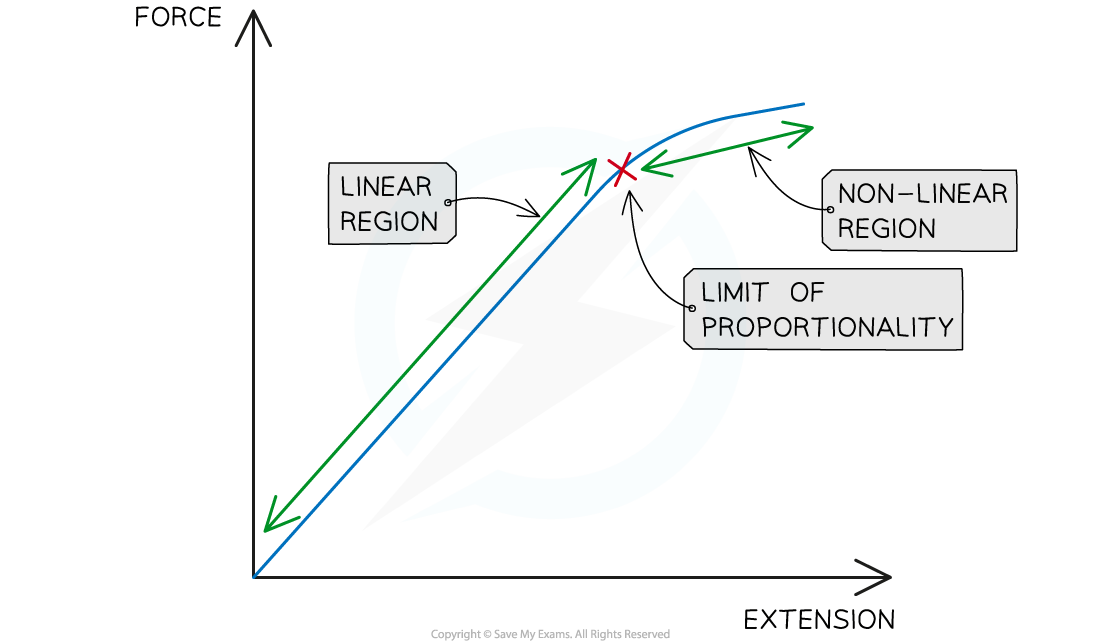
Linear and non-linear regions of a force-extension graph
Calculating Spring Constant
The spring constant can be calculated by rearranging the Hooke's law equation for k:

Where:
k = spring constant in newtons per metres (N/m)
F = force in newtons (N)
e = extension in metres (m)
This equation shows that the spring constant is equal to the force per unit extension needed to extend the spring, assuming that its limit of proportionality is not reached
The stiffer the spring, the greater the spring constant and vice versa
This means that more force is required per metre of extension compared to a less stiff spring
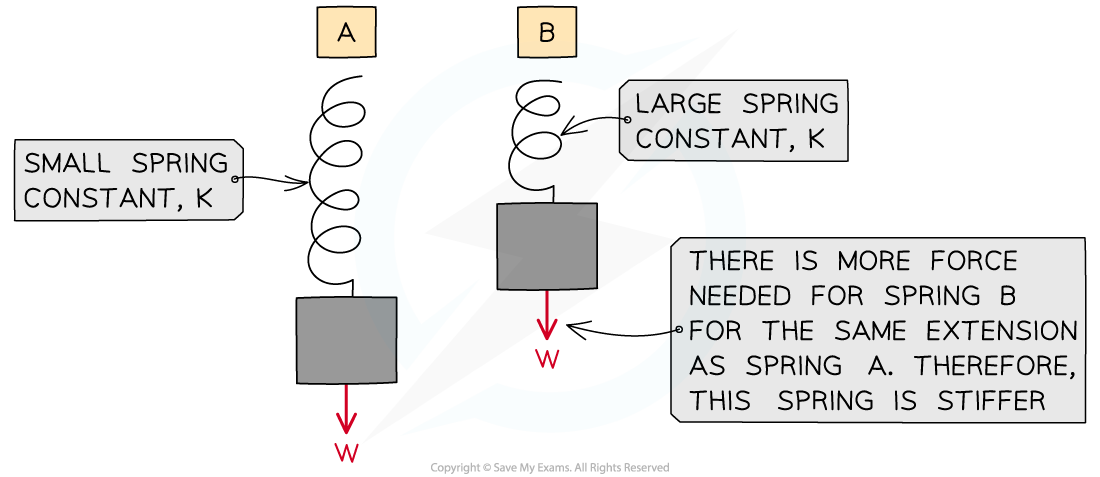
A spring with a larger spring constant needs more force per unit extension (it is stiffer)
The spring constant is also used in the equation for elastic potential energy
Worked Example
A mass of 0.6 kg is suspended from a spring, where it extends by 2 cm. Calculate the spring constant of the spring.
Answer:
Step 1: List the known quantities
Mass, m = 0.6 kg
Extension, e = 2 cm
Step 2: Write down the relevant equation
Step 3: Calculate the force
The force on the spring is the weight of the mass
g is Earth's gravitational field strength (9.8 N/kg)
W = mg = 0.6 × 9.8 = 5.88 N
Step 4: Convert any units
The extension must be in metres
2 cm = 0.02 m
Step 5: Substitute values into the equation

Examiner Tips and Tricks
Remember the unit for the spring constant is Newtons per metres (N/m). This is commonly forgotten in exam questions
Interpreting Graphs of Force v Extension
The relationship between force and extension is shown on a force-extension graph
If the force-extension graph is a straight line, then the material obeys Hooke's law
Sometimes, this may only be a small region of the graph, up to the material's limit of proportionality
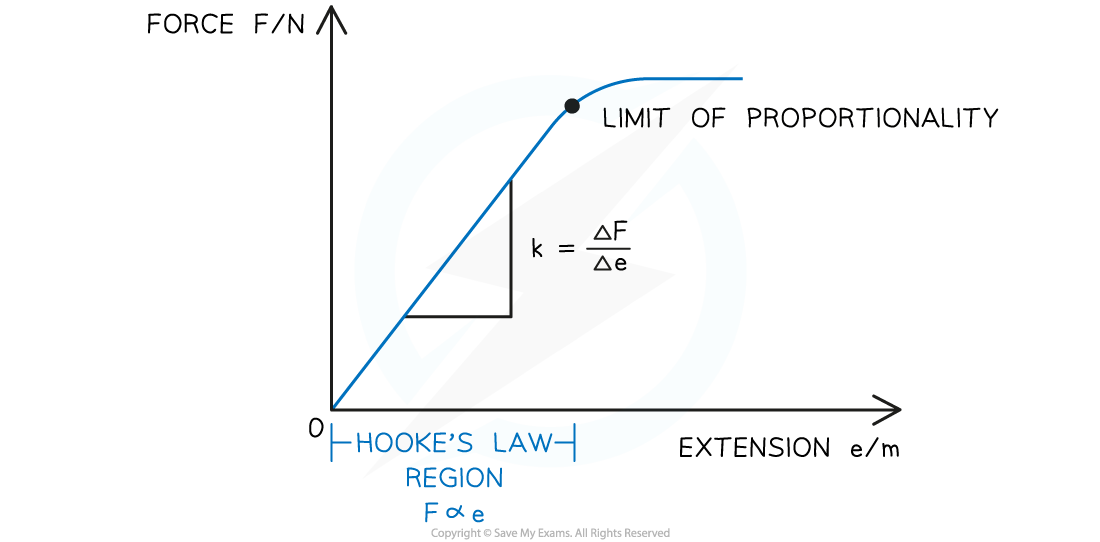
The Hooke's law region on a force-extension graph is where the graph is a straight line
The symbol Δ means the 'change in' a variables
For example, ΔF and Δe are the 'change in' force and extension respectively
This is the same as rise ÷ run for calculating the gradient
The '∝' symbol means 'proportional to'
i.e. F ∝ e means the 'the force is proportional to the extension'
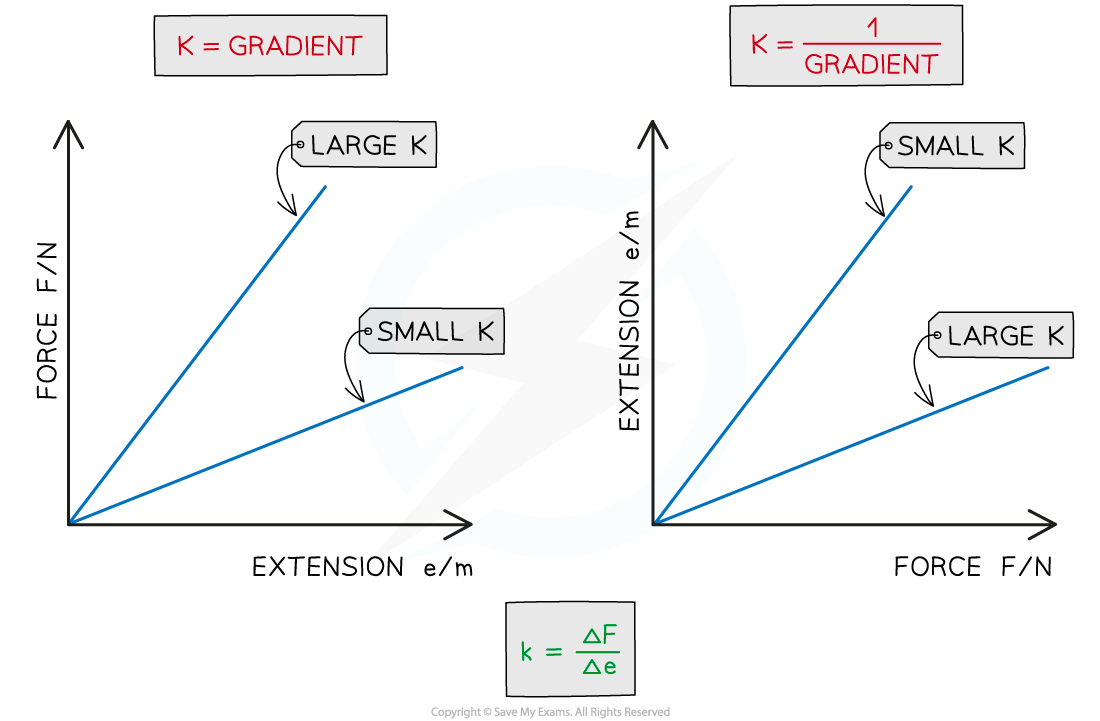
The spring constant is the gradient, or 1 ÷ gradient of a force-extension graph depending on which variable is on which axis
If the force is on the y axis and the extension on the x axis, the spring constant is the gradient of the straight line (Hooke's law) region of the graph
If the graph has a steep straight line, this means the material has a large spring constant
If the graph has a shallow straight line, this means the material has a small spring constant
If the force is on the x axis and the extension on the y axis, the spring constant is 1 ÷ gradient of the straight line (Hooke's law) region of the graph
If the graph has a steep straight line, this means the material has a small spring constant
If the graph has a shallow straight line, this means the material has a large spring constant
Worked Example
A student investigates the relationship between the force applied and extension for three springs K, L and M. The results are shown on the graph below:
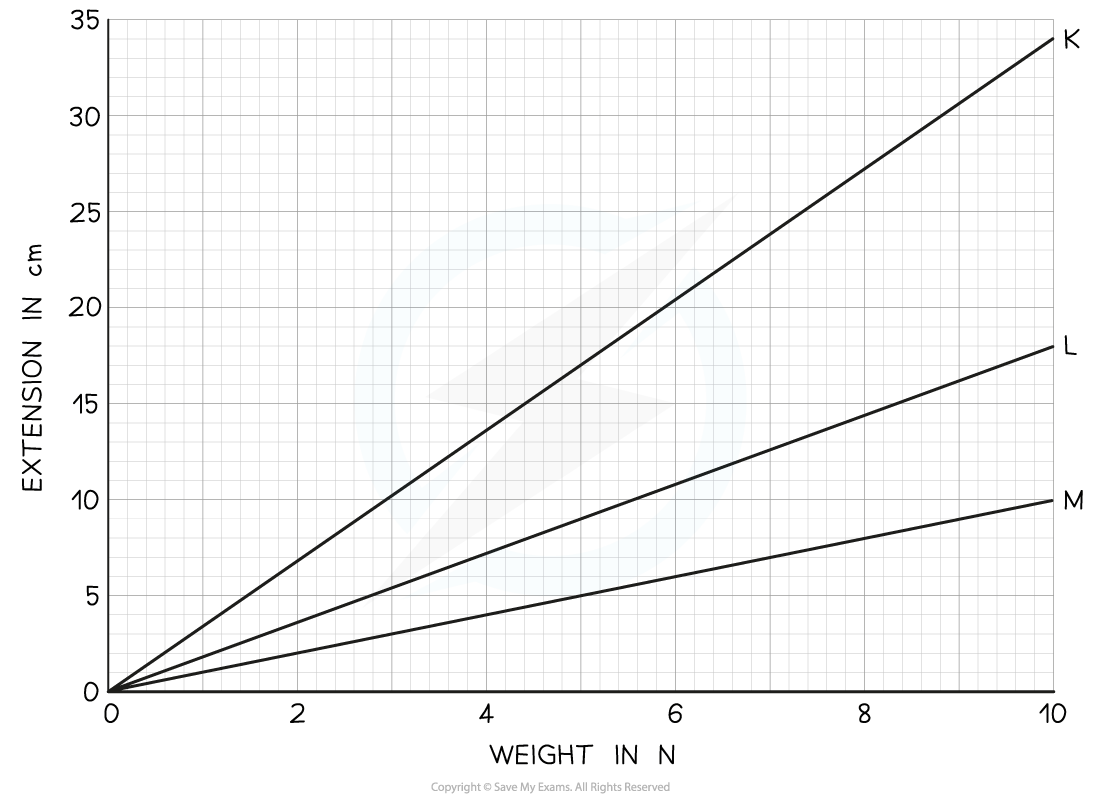
Which of the statements is correct?
A. K has a higher spring constant than the other two springs
B. M has the same spring constant as K
C. L has a higher spring constant than M
D. K has a lower spring constant than the other two springs
Answer: D
The graph has the extension on the y axis and the weight (force) on the x-axis
This means that the spring constant is 1 ÷ gradient
Therefore the steeper the straight line, the lower the spring constant
K has the steepest gradient and therefore has a lower spring constant than L and M
Examiner Tips and Tricks
Make sure to always check which variables are on which axes to determine which line has a larger or smaller spring constant, as well as the units for calculations

Unlock more, it's free!
Join the 100,000+ Students that ❤️ Save My Exams
the (exam) results speak for themselves:

Was this revision note helpful?