Large Data Set (Edexcel A Level Maths: Statistics): Exam Questions

Exam code: 9MA0

3 hours28 questions
1a
1 mark

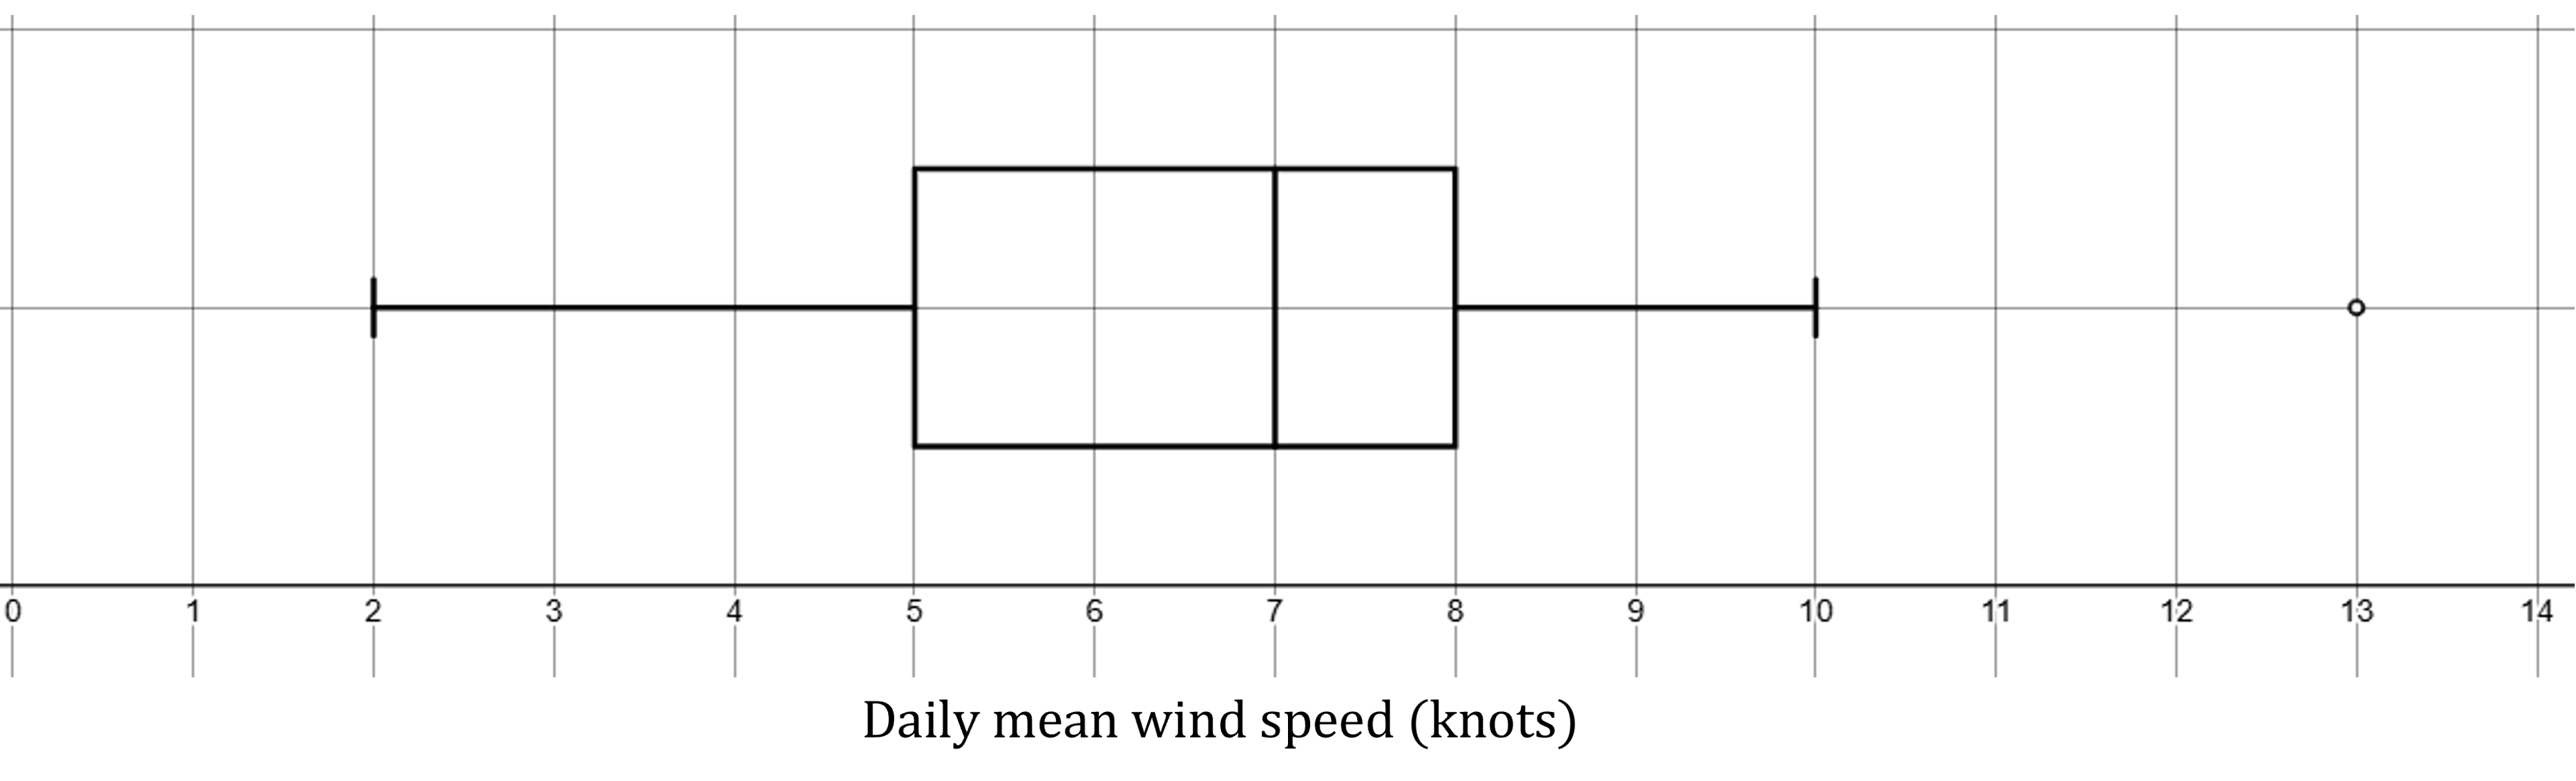
Jiang is studying the variable Daily Mean Pressure from the large data set.

He drew the following box and whisker plot for these data for one of the months for one location using a linear scale but

  • he failed to label all the values on the scale

  • he gave an incorrect value for the median

Box plot showing daily mean pressure in hPa with a central box, whiskers, and an arrowed axis labelled Daily Mean Pressure (hPa). The centre line of the 'box' is directly above 1200 on the horizontal axis.

Using your knowledge of the large data set, suggest a suitable value for the median.

(You are not expected to have memorised values from the large data set. The question is simply looking for sensible answers.)

1b
1 mark

Using your knowledge of the large data set, suggest a suitable value for the range.

(You are not expected to have memorised values from the large data set. The question is simply looking for sensible answers.)

2a
1 mark

Fred and Nadine are investigating whether there is a linear relationship between Daily Mean Pressure, p hPa, and Daily Mean Air Temperature, t °C, in Beijing using the 2015 data from the large data set.

Fred randomly selects one month from the data set and draws the scatter diagram in Figure 1 using the data from that month.

The scale has been left off the horizontal axis.

Scatter plot showing daily mean air temperature (°C) against daily mean pressure (hPa), with points clustered between 20-30°C and overlapping pressure values.
Figure 1

Describe the correlation shown in Figure 1.

2b
1 mark

Nadine chooses to use all of the data for Beijing from 2015 and draws the scatter diagram in Figure 2.

She uses the same scales as Fred.

Scatter plot showing the relationship between daily mean air temperature (°C) and daily mean pressure (hPa), displaying a negative correlation.
Figure 2

Explain, in context, what Nadine can infer about the relationship between p and t using the information shown in Figure 2.

2c
1 mark

Using your knowledge of the large data set, state a value of p for which interpolation can be used with Figure 2 to predict a value of t.

2d
1 mark

Using your knowledge of the large data set, explain why it is not meaningful to look for a linear relationship between Daily Mean Wind Speed (Beaufort Conversion) and Daily Mean Air Temperature in Beijing in 2015.

3
2 marks

Szilard wants to compare the average daily mean temperature in Beijing in both 1987 and 2015 using the large data set.

Szilard selects the data from the first 10 days in October in both 1987 and 2015.

Give two reasons why this sampling method is not suitable for Szilard's investigation.

4a
Sme Calculator
2 marks

Daily Mean Temp. °C Beijing October 1987

20.6

19.1

21.1

20.4

19.8

19.3

17.1

16.5

18

18.9

Daily Mean Temp. °C Beijing October 2015

16.1

19.4

18.6

18.4

18.9

20.3

20.5

14.5

14.7

14

A selection of data from the large data set relating to the mean daily air temperature in Beijing for the first 10 days in October in both 1987 and 2015 is given above.  Climate activists use temperature data to track changes over time.

Using the data given above, find the mean of the daily mean air temperature for both 1987 and 2015.

4b
1 mark

Give one reason why the sample used above should not be used to draw wider conclusions about how the temperature in China has changed from 1987 to 2015.

5a
1 mark

A selection of data from the large data set relating to the daily mean cloud cover, measured in oktas, in Heathrow for the first 10 days in May 1987 is given below.

7         4         5         2         7         4          2         0          3          5

Using your knowledge of the large data set, explain why a value of 10 oktas would be impossible.

5b
4 marks

Find:

(i) the value of the median of the data,

(ii) the interquartile range of the data. 

6a
1 mark

The incomplete box plot below shows data from the large data set regarding cloud cover between May and October 2015 in Cambourne.  Cloud cover is measured in Oktas on a scale from 0 (no cloud cover) to 8 (full cloud cover).

Grid chart showing cloud cover in oktas with a highlighted rectangle spanning values 5 to 7. Horizontal axis labelled "Cloud cover (Oktas)", marked 0 to 8.

Find the interquartile range.

6b
3 marks

An outlier is defined as any data value that falls either more than 1.5 cross times (interquartile range) above the upper quartile or less than 1.5 cross times (interquartile range) below the lower quartile.

(i) Find the boundaries (fences) at which outliers are defined.

(ii) Explain why, using your knowledge of how cloud cover is measured in the large data set, there cannot be any high valued outliers.

6c
2 marks

Complete the box plot given that, where appropriate, the maximum and minimum values should be located at the boundaries (fences) at which outliers are defined. (You are not required to mark any outliers on the box plot.)

1a
2 marks

Helen believes that the random variable C, representing cloud cover from the large data set, can be modelled by a discrete uniform distribution.

Write down the probability distribution for C.

1b
1 mark

Using this model, find the probability that cloud cover is less than 50%.

1c
1 mark

Helen used all the data from the large data set for Hurn in 2015 and found that the proportion of days with cloud cover of less than 50% was 0.315

Comment on the suitability of Helen’s model in the light of this information.

1d
1 mark

Suggest an appropriate refinement to Helen’s model.

2a
4 marks

A meteorologist is investigating the Daily Total Rainfall, r mm, in Heathrow using a random sample of 120 days from the large data set.

The results are summarised in the table below.

Rainfall, bold italic r (mm)

Frequency

0 less or equal than r less than 2

18

2 less or equal than r less than 5

36

5 less or equal than r less than 10

42

10 less or equal than r less than 20

16

20 less or equal than r less than 40

8

On the grid below, draw a histogram to represent these data.

Grid paper with small squares, featuring horizontal and vertical axes with arrowheads, suggesting a blank graph or plot area.
2b
2 marks

A "light-rain" day is defined as a day with rainfall between 1 mm and 5 mm.

Calculate an estimate for the number of "light-rain" days recorded in this sample.

2c
1 mark

Before producing the grouped frequency table, the meteorologist had to clean the data.

Using your knowledge of the large data set, explain why the daily total rainfall data needed to be cleaned.

3a
Sme Calculator
1 mark

Magali is studying the mean total cloud cover, in oktas, for Leuchars in 1987 using data from the large data set. The daily mean total cloud cover for all 184 days from the large data set is summarised in the table below.

Daily mean total cloud cover (oktas)

0

1

2

3

4

5

6

7

8

Frequency (number of days)

0

1

4

7

10

30

52

52

28

One of the 184 days is selected at random.

Find the probability that it has a daily mean total cloud cover of 6 or greater.

3b
Sme Calculator
4 marks

Magali is investigating whether the daily mean total cloud cover can be modelled using a binomial distribution.

She uses the random variable X to denote the daily mean total cloud cover and believes that X tilde straight B left parenthesis 8 comma space 0.76 right parenthesis.

Using Magali’s model,

(i)  find straight P open parentheses X greater or equal than 6 close parentheses

(ii)  find, to 1 decimal place, the expected number of days in a sample of 184 days with a daily mean total cloud cover of 7.

3c
1 mark

Explain whether or not your answers to part (b) support the use of Magali’s model.

3d
Sme Calculator
1 mark

There were 28 days that had a daily mean total cloud cover of 8.

For these 28 days, the daily mean total cloud cover for the following day is shown in the table below.

Dailymean total clou cover (oktas)

0

1

2

3

4

5

6

7

8

Frequency (number of days)

0

0

1

1

2

1

5

9

9

Find the proportion of these days when the daily mean total cloud cover was 6 or greater.

3e
2 marks

Comment on Magali’s model in light of your answer to part (d).

4a
2 marks

Ben is studying the Daily Total Rainfall, x mm, in Leeming for 1987.

He used all the data from the large data set and summarised the information in the following table.

x

0

0.1-0.5

0.6-1.0

1.1-1.9

2.0-4.0

4.1-6.9

7.0-12.0

12.1-20.9

21.0-32.0

tr

Frequency

55

18

18

21

17

9

9

6

2

29

Explain how the data will need to be cleaned before Ben can start to calculate statistics such as the mean and standard deviation.

4b
Sme Calculator
3 marks

Using all 184 of these values, Ben estimates sum x equals 390 and sum x squared equals 4336

Calculate estimates for

(i) the mean Daily Total Rainfall,

(ii) the standard deviation of the Daily Total Rainfall.

4c
2 marks

Ben suggests using the statistic calculated in part (b)(i) to estimate the annual mean Daily Total Rainfall in Leeming for 1987.

Using your knowledge of the large data set,

(i) give a reason why these data would not be suitable,

(ii) state, giving a reason, how you would expect the estimate in part (b)(i) to differ from the actual annual mean Daily Total Rainfall in Leeming for 1987.

5a
1 mark

The table below shows data from the large data set on the daily mean pressure, p (hPa), and daily total sunshine, s (hrs), in Camborne for a random sample of 12 days in 2015.

p

1007

1023

1011

1022

1011

1019

1017

1016

1022

997

1030

1023

s

0

6.3

2.4

6.2

1.7

8.4

1.9

6.7

7.7

2.3

10.3

4.1

The equation of the regression line of s on p is s = -270.5 + 0.271p.

Give an interpretation of the value of the gradient of the regression line.

5b
2 marks

Explain why it would not be reliable to use this regression equation to predict:

(i) the daily total sunshine on a day with a mean daily pressure of 980 hPa

(ii) the mean daily pressure on a day with 5.6 hours of total sunshine.

6a
Sme Calculator
2 marks

Summary statistics from the large data set for the daily mean windspeed (knots) measured in Heathrow throughout October 1987 and October 2015 are given in the table below.


Min

Max

Median

straight capital sigma x

straight capital sigma x squared

1987

2

16

5

185

1401

2015

3

10

6

197

1357

Calculate the mean of the daily mean windspeeds for each of the two years.

6b
Sme Calculator
4 marks

The standard deviation for 2015 was 1.84.

Calculate the standard deviation for 1987 and compare the daily mean windspeeds for each of the two years.

7a
Sme Calculator
2 marks

The box plot in Figure 1 shows the Daily Mean Wind Speed, w knots, for the 31 days in October 2015 in Hurn from the large data set.

Box plot with lowest line at 2, next line at 5, next at 7, next at 8, and last at 10. Another point is indicated at 13
Figure 1

Show that the value 13 is an outlier.

7b
2 marks

The Daily Mean Wind Speed data for Leuchars for the same period (October 2015) is summarised below.

Lowest Value

3

Lower Quartile

4

Median

6

Upper Quartile

9

Highest Value

22

Compare the Daily Mean Wind Speed in Hurn and Leuchars for October 2015.

7c
2 marks

A meteorologist wants to calculate the mean wind speed for Leuchars. The data in the large data set contains some entries recorded as "n/a".

State what "n/a" represents in the large data set and how the meteorologist should handle these entries.

1a
Sme Calculator
2 marks

The table below shows the daily total sunshine, x hours, and the daily mean total cloud cover, y oktas, for the first 10 days in May 2015 at Heathrow, taken from the large data set.

x

a

0.7

3.3

6.9

4.7

5.4

5.5

0.1

5.7

7.5

y

5

6

7

5

6

6

5

7

4

4

(i) Explain what is meant by 5 oktas of cloud cover.

(ii) Show that a = 4.4, given that there were 4 hours and 24 minutes of sunshine recorded at Heathrow on the first day of May 2015.

1b
Sme Calculator
1 mark

Calculate the product moment correlation coefficient, r, between x and y.

1c
4 marks

(i) State suitable null and alternative hypotheses to test whether there is evidence of negative correlation between daily total sunshine and daily mean cloud cover.

(ii) Using the table of critical values for correlation coefficients in your formula booklet, find the critical value for this test at the 0.5% level of significance.

(iii) Test, at the 0.5% level of significance, whether there is evidence of a negative correlation between daily total sunshine and daily mean cloud cover at Heathrow in May 2015.

2a
1 mark

Stav is studying the large data set for September 2015.

He codes the variable Daily Mean Pressure, x, using the formula y equals x minus 1010.

The data for all 30 days from Hurn are summarised by

sum y equals 214 space space space sum y squared equals 5912

State the units of the variable x.

2b
Sme Calculator
2 marks

Find the mean Daily Mean Pressure for these 30 days.

2c
Sme Calculator
3 marks

Find the standard deviation of Daily Mean Pressure for these 30 days.

2d
2 marks

Stav knows that, in the UK, winds circulate

  • in a clockwise direction around a region of high pressure

  • in an anticlockwise direction around a region of low pressure

The table gives the Daily Mean Pressure for 3 locations from the large data set on 26/09/2015

Location

Heathrow

Hurn

Leuchars

Daily Mean Pressure

1029

1028

1028

Cardinal Wind Direction

The Cardinal Wind Directions for these 3 locations on 26/09/2015 were, in random order,

W     NE     E

You may assume that these 3 locations were under a single region of pressure.

Using your knowledge of the large data set, place each of these Cardinal Wind Directions in the correct location in the table.

Give a reason for your answer.

3a
1 mark

Dian uses the large data set to investigate the Daily Total Rainfall, r mm, for Camborne.

Write down how a value of 0 less than r less or equal than 0.05 is recorded in the large data set.

3b
Sme Calculator
3 marks

Dian uses the data for the 31 days of August 2015 for Camborne and calculates the following statistics

n equals 31 space space space space space space space space space space space space space sum r equals 174.9 space space space space space space space space space space space space space sum r squared equals 3523.283

Use these statistics to calculate

(i) the mean of the Daily Total Rainfall in Camborne for August 2015,

(ii) the standard deviation of the Daily Total Rainfall in Camborne for August 2015.

3c
2 marks

Dian believes that the mean Daily Total Rainfall in August is less in the South of the UK than in the North of the UK.

The mean Daily Total Rainfall in Leuchars for August 2015 is 1.72 mm to 2 decimal places.

State, giving a reason, whether this provides evidence to support Dian's belief.

3d
1 mark

Dian uses the large data set to estimate the proportion of days with no rain in Camborne for 1987 to be 0.27 to 2 decimal places.

Explain why the distribution straight B left parenthesis 14 comma space 0.27 right parenthesis might not be a reasonable model for the number of days without rain for a 14‐day summer event.

4a
1 mark

Helen is studying one of the qualitative variables from the large data set for Heathrow from 2015.

She started with the data from 3rd May and then took every 10th reading.

There were only 3 different outcomes with the following frequencies

Outcome

A

B

C

Frequency

16

2

1

State the sampling technique Helen used.

4b
2 marks

From your knowledge of the large data set

(i) suggest which variable was being studied,

(ii) state the name of outcome A.

4c
1 mark

George is also studying the same variable from the large data set for Heathrow from 2015.

He started with the data from 5th May and then took every 10th reading and obtained the following

Outcome

A

B

C

Frequency

16

1

1

Helen and George decided they should examine all of the data for this variable for Heathrow from 2015 and obtained the following

Outcome

A

B

C

Frequency

155

26

3

State what inference Helen and George could reliably make from their original samples about the outcomes of this variable at Heathrow, for the period covered by the large data set in 2015.

5a
1 mark

A random sample of 15 days is taken from the large data set for Perth in June and July 1987.

The scatter diagram in Figure 1 displays the values of two of the variables for these 15 days.

Scatter plot with points scattered across a grid, having x-axis ranging from 0 to 20 and y-axis marked from 0 upwards, displaying a downward trend.
Figure 1

Describe the correlation.

5b
2 marks

The variable on the x-axis is Daily Mean Temperature measured in °C.

Using your knowledge of the large data set,

(i) suggest which variable is on the y-axis,

(ii) state the units that are used in the large data set for this variable.

5c
3 marks

Stav believes that there is a correlation between Daily Total Sunshine and Daily Maximum Relative Humidity at Heathrow.

He calculates the product moment correlation coefficient between these two variables for a random sample of 30 days and obtains r equals negative 0.377.

Carry out a suitable test to investigate Stav’s belief at a 5% level of significance.

State clearly

  • your hypotheses

  • your critical value

5d
1 mark

On a random day at Heathrow the Daily Maximum Relative Humidity was 97%.

Comment on the number of hours of sunshine you would expect on that day, giving a reason for your answer.

6a
Sme Calculator
4 marks
Partially completed box plot on a grid with horizontal axis numbered from 7 to 33. A rectangle is drawn going from 19.4 to 26.6, with a vertical line at 23.6 separating it into two parts.
Figure 1

The partially completed box plot in Figure 1 shows the distribution of daily mean air temperatures using the data from the large data set for Beijing in 2015.

An outlier is defined as a value

  • more than 1.5 cross times IQR below Q subscript 1 or

  • more than 1.5 cross times IQR above Q subscript 3

The three lowest air temperatures in the data set are 7.6 °C, 8.1 °C and 9.1 °C.

The highest air temperature in the data set is 32.5 °C.

Complete the box plot in Figure 1 showing clearly any outliers.

6b
1 mark

Using your knowledge of the large data set, suggest from which month the two outliers are likely to have come.

6c
Sme Calculator
1 mark

Using the data from the large data set, Simon produced the following summary statistics for the daily mean air temperature, x°C, for Beijing in 2015

n equals 184 space space space space space space space space space space space sum for blank of x equals 4153.6 space space space space space space space space space space space straight S subscript x x end subscript equals 4952.906

Show that, to 3 significant figures, the standard deviation is 5.19 °C.

6d
Sme Calculator
3 marks

Simon decides to model the air temperatures with the random variable

T tilde straight N left parenthesis 22.6 comma space 5.19 squared right parenthesis

Using Simon’s model, calculate the 10th to 90th interpercentile range.

6e
2 marks

Simon wants to model another variable from the large data set for Beijing using a normal distribution.

State two variables from the large data set for Beijing that are not suitable to be modelled by a normal distribution. Give a reason for each answer.

7a
2 marks

The large data set provides weather data for 184 consecutive days in each of the years 1987 and 2015. 

Describe how Charlie could take a systematic sample of 12 days from the data for Hurn for 1987 so that each date has a chance of being selected.

7b
1 mark

Charlie also takes a sample of 12 dates from the data for Hurn for 2015.

Using your knowledge of the large data set, explain why Charlie’s sample may not necessarily give him 12 numerical values to compare for each year.

8a
1 mark

Wendy is using the large data set to learn about the daily mean wind speeds for Leeming in June 2015. She lists the data below.

4

4

4

5

5

5

5

6

6

6

6

7

7

7

7

7

8

8

8

9

9

9

10

10

10

11

11

16

17

17

Using your knowledge of the large data set, state the units for the values in the table.

8b
Sme Calculator
3 marks

An outlier is defined as a value more than 1.5 \times \text{IQR} below Q_{1} or more than 1.5 \times \text{IQR} above Q_{3}.

On the grid below, draw a box plot for the information above.

Blank grid with a horizontal axis arrow for drawing a box plot of windspeeds
9a
Sme Calculator
4 marks

Nguyen is using the large data set to investigate claims by a local newspaper that the chance of rain on a given day in Leuchars is 18%. She believes that the probability of it raining on a given day in Leuchars is different to 18%.

Nguyen includes all 368 days available in the large data set and finds that it rained on 80 of those days.

Using a 5% level of significance, test Nguyen's belief.  State your null and alternative hypotheses clearly.

9b
2 marks

Using your knowledge of the large data set, give two reasons why the sample may not be appropriate to test Nguyen's belief.

10a
1 mark

Medhi is a meteorologist investigating the weather in Heathrow and claims that there is negative correlation between the daily total rainfall, f mm, and daily total sunshine, s hours.

Medhi decides to use the large data set to investigate this claim and forms a sample using all the days in June 2015 relating to Heathrow.

Some values for the daily total rainfall, f mm, are labelled as 'tr'. Using your knowledge of the large data set, state the range of values Medhi could assign to these values.

10b
3 marks

Medhi uses all the days in June 2015 as a sample and calculates the product moment correlation coefficient to be r = -0.2659.

Carry out a suitable test at the 5% level of significance to investigate Medhi's claim. You should:

  • state your hypotheses clearly

  • state the critical value used

10c
2 marks

Medhi uses this data to calculate the equation for the regression line of f on s. He plans to use the regression line to estimate the amount of rainfall there will be in Heathrow during a day in December.

Give two reasons why this is unlikely to produce a reliable estimate.

11a
Sme Calculator
3 marks

David and Bowey are planning a trip in June to Beijing, Jacksonville or Perth.  The temperature of the city and the atmospheric pressure will be deciding factors, so they investigate these three cities using all of the data for June 2015 from the large data set.

Using all of the days in June 2015, the following summary statistics for the daily mean air temperatures (t ℃) and the daily mean pressure (p hPa) are calculated:


Daily mean air temperature

Daily Mean Pressure


t with bar on top

sigma subscript t

p with bar on top

sigma subscript p

Beijing

a

b

1004

3.81

Jacksonville

26.4

1.80

1017

1.88

Perth

14.8

2.37

1021

5.63

David also has the following information for Beijing in June:

straight capital sigma t space equals space 741.8  and  straight capital sigma t squared space equals space 18513.2

Calculate the values of  a and  b.

11b
Sme Calculator
3 marks

David suffers from headaches when the atmospheric pressure changes quickly so he would like to choose a city where the pressure does not vary a lot. Additionally, Bowey does not like it when the temperature is higher than 30 °C.

It is known that all the temperatures for Beijing in June 2015 were within 2 standard deviations of the mean, whereas in Jacksonville there were temperatures that were higher than the mean by more than 2 standard deviations.

(i) Use the data to explain why Bowey would not be happy visiting Jacksonville.

(ii) Hence, suggest with reasons which other city both David and Bowey would be happy to visit.

12a
Sme Calculator
2 marks

An ice cream shop owner in Camborne is trying to use data from the large data set alongside their own past sales data to help them estimate future sales. The mean daily temperature per month, T °C, is shown with the mean daily number of ice creams sold per month, I, from 2015 in the table below.

Month

May

June

July

August

September

October

T

11.2

13.8

15.7

15.4

13.6

12.2

I

57

132

259

227

133

101

The equation for the regression line of I on T is I = -429.5 + 42.5T.

Find an estimate for the expected total number of ice creams sold in the month of July if the average daily temperature for that month is 14.9 °C.

12b
1 mark

Suggest one other variable from the large data set which could be used to improve this model.

12c
1 mark

The ice cream shop owner claims that there is a causal link between I and T, and so if the shop sells more ice cream, the month will be hotter. 

Comment on this claim.

1a
Sme Calculator
6 marks

Roger has been looking at some data on the daily mean air temperature, t, in two different locations, Perth and Jacksonville, taken from the large data set.  All the data is taken from the month of July in 2015.


n

straight capital sigma t

straight capital sigma t squared

t with bar on top

sigma

Location A

31

836.3

22593.0


Location B

31


13.3

2.167

Unfortunately, some of the information has been lost and Roger does not know which data is for which location.

Complete the table.

1b
1 mark

Using your knowledge of the large data set, state which of the locations is most likely to be Jacksonville, giving a reason for your answer.

2a
Sme Calculator
2 marks

The table below shows the daily maximum relative humidity, rounded to the nearest per cent, for Leuchars between June and August 2015.

Daily maximum relative humidity, x (%)

Frequency, f

80 – 89

7

90 – 95

21

96 – 98

21

99 – 100

43

Using your knowledge of the large data set, explain why roughly 70\% of these days contained fog and/or mist.

2b
Sme Calculator
2 marks

The data from the table are to be presented on a statistical diagram.

For a histogram, the frequency density for the 9698 class is 7.

Find the frequency density for the 8089 class.

2c
2 marks

For a cumulative frequency graph, state the coordinates of all the points that should be plotted.

2d
1 mark

Explain why an exact box plot cannot be drawn using only the information from the table.

3a
2 marks

Ororo, a meteorologist, is investigating the great storm of 1987 which largely affected the south of England. Ororo would like to compare the daily maximum gust in Hurn during the months of October 1987 and October 2015.

Using your knowledge of the large data set

(i) suggest one other city from the large data set that Ororo could use to investigate the great storm of 1987

(ii) state the units that are used in large data set to measure the daily maximum gust.

3b
Sme Calculator
5 marks

Ororo calculates the following summary statistics for the daily maximum gust in Hurn using the available data for October 1987.


Number of available days

Maximum value

straight capital sigma x

S subscript x x end subscript

1987

25

61

665

3462

An outlier is defined as a value which is more than 2 standard deviations away from the mean.

(i) Show that the maximum value in 1987 is an outlier.

(ii) Give a reason why Ororo should include the outlier when comparing the data from the two years.

3c
2 marks

Ororo calculates the following statistics for the daily maximum gust in Hurn for October 2015:

  • Mean is 18.9 knots

  • Standard deviation is 4.45 knows

Compare the daily maximum gust in Hurn for October 1987 and October 2015.