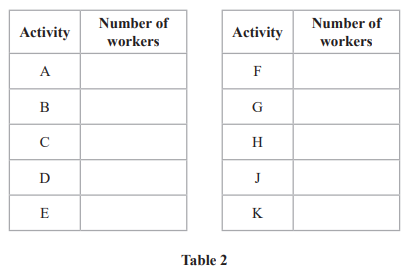
Critical Path Analysis (Edexcel A Level Further Maths: Decision 1): Exam Questions

Exam code: 9FM0

3 hours15 questions
1a
Sme Calculator
3 marks

Activity

Time taken (days)

Immediately preceding activities

A

5

-

B

8

-

C

4

-

D

14

A

E

10

A

F

3

B, C, E

G

7

C

H

5

D, F, G

I

7

H

J

9

H

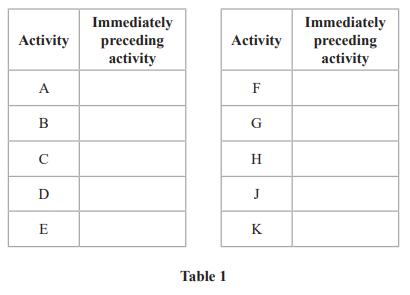
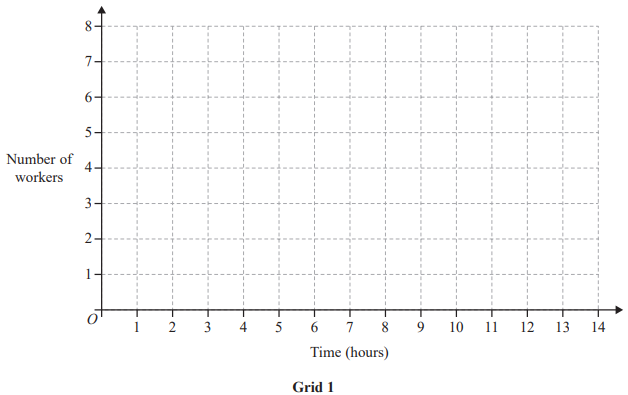
The table above shows the activities required for the completion of a building project. For each activity, the table shows the time it takes, in days, and the immediately preceding activities. Each activity requires one worker. The project is to be completed in the shortest possible time.
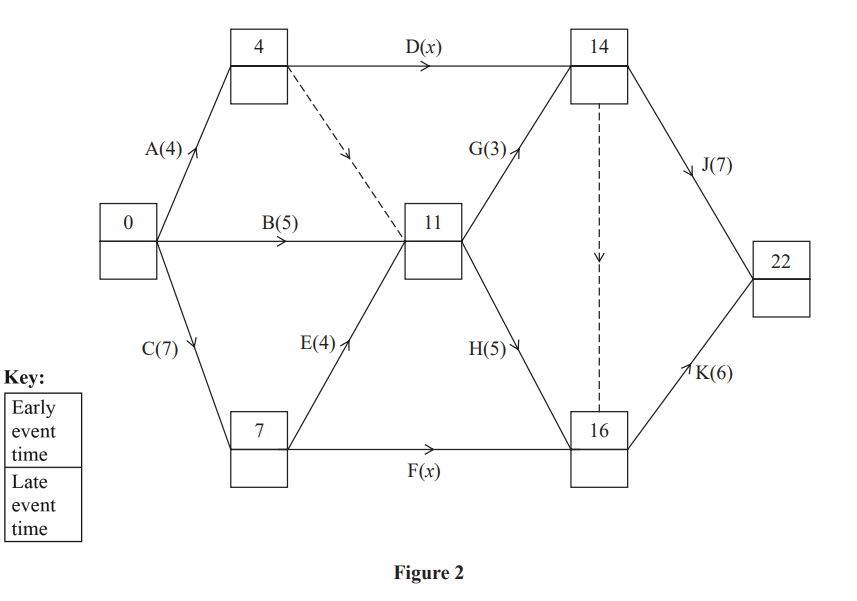
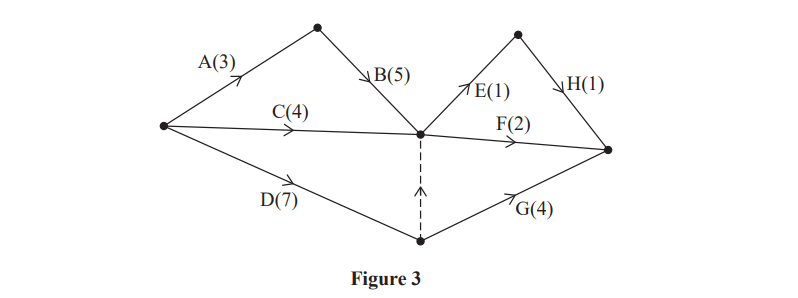
q3-8fmo-27-june-2018

Figure 2

Figure 2 shows a partially completed activity network used to model the project. The activities are represented by the arcs and the number in brackets on each arc is the time taken, in days, to complete the corresponding activity.

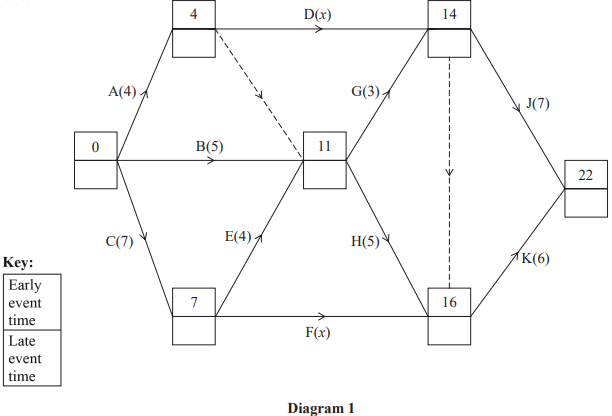
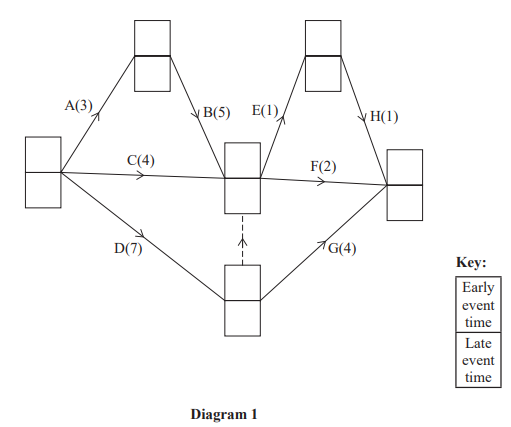
Add the missing activities and necessary dummies to Diagram 1 in the answer book (opens in a new tab).

1b
Sme Calculator
3 marks

Complete Diagram 1 in the answer book (opens in a new tab) to show the early event times and the late event times.

1c
Sme Calculator
1 mark

State the critical activities.

1d
Sme Calculator
3 marks

At the beginning of the project it is decided that activity G is no longer required.

Explain what effect, if any, this will have on

(i) the shortest completion time of the project if activity G is no longer required, 

(ii) the timing of the remaining activities.

2a
Sme Calculator
5 marks

Activity

Immediately preceding activities

A

-

B

-

C

A

D

A

E

A

F

B, C

G

B, C

H

D

I

D, E, F, G

J

D, E, F, G

K

G

Draw the activity network described in the precedence table above, using activity on arc.
Your activity network must contain the minimum number of dummies.

2b
Sme Calculator
1 mark

Every activity shown in the precedence table has the same duration.

Explain why activity B cannot be critical.

2c
Sme Calculator
1 mark

State which other activities are not critical.

3a
Sme Calculator
2 marks
q4-fig-3-june-2019-9fm0-3d

Figure 3

The network in Figure 3 shows the activities that need to be undertaken to complete a project. Each activity is represented by an arc and the duration of the activity, in days, is shown in brackets. The early event times and late event times are to be shown at each vertex and one late event time has been completed for you.

The total float of activity H is 7 days.

Explain, with detailed reasoning, why x = 11

3b
Sme Calculator
3 marks

Determine the missing early event times and late event times, and hence complete Diagram 1 in your answer book (opens in a new tab).

3c
Sme Calculator
1 mark

Each activity requires one worker and the project must be completed in the shortest possible time using as few workers as possible.

Calculate a lower bound for the number of workers needed to complete the project in the shortest possible time.

3d
Sme Calculator
3 marks

Schedule the activities using Grid 1 in the answer book (opens in a new tab).

4a
Sme Calculator
5 marks

Activity

Immediately preceding activities

A

B

C

D

A

E

C

F

B, C, D

G

A

H

B, C, D

I

B, C, D, G

J

B, C, D, G

K

E, H

Draw the activity network described in the precedence table above, using activity on arc. Your activity network must contain only the minimum number of dummies.

4b
Sme Calculator
1 mark

Given that all the activities shown in the precedence table have the same duration,

State the critical path for the network.

5a
Sme Calculator
2 marks
q2-fig1-oct-2020-8fm0-27

Figure 1

A project is modelled by the activity network shown in Figure 1. The activities are represented by the arcs. The number in brackets on each arc gives the time, in hours, to complete the corresponding activity. Each activity requires one worker. The project is to be completed in the shortest possible time.

Complete the precedence table in the answer book. (opens in a new tab)

5b
Sme Calculator
3 marks

Complete Diagram 1 in the answer book (opens in a new tab) to show the early event times and the late event times.

5c
Sme Calculator
2 marks

(i) State the minimum project completion time. 

(ii) List the critical activities. 

5d
Sme Calculator
1 mark

Calculate the maximum number of hours by which activity H could be delayed without affecting the shortest possible completion time of the project. You must make the numbers used in your calculation clear.

5e
Sme Calculator
2 marks

Calculate a lower bound for the number of workers needed to complete the project in the minimum time. You must show your working.

5f
Sme Calculator
3 marks

Draw a cascade chart for this project on Grid 1 in the answer book (opens in a new tab).

5g
Sme Calculator
1 mark

Using the answer to (f), explain why it is not possible to complete the project in the shortest possible time using the number of workers found in (e).

6a
Sme Calculator
2 marks
fig1-november-2020-9fm0-3d

Figure 1

The network in Figure 1 shows the activities that need to be undertaken to complete a project. Each activity is represented by an arc and the duration, in hours, of the corresponding activity is shown in brackets.

Explain why each of the dummy activities is required.

6b
Sme Calculator
2 marks

Complete the table in the answer book (opens in a new tab) to show the immediately preceding activities for each activity.

6c
Sme Calculator
6 marks

(i) Complete Diagram 1 in the answer book (opens in a new tab) to show the early event times and the late event times.

(ii) State the minimum completion time for the project.

(iii) State the critical activities.

6d
Sme Calculator
3 marks

Each activity requires one worker. Each worker is able to do any of the activities. Once an activity is started it must be completed without interruption.

On Grid 1 in the answer book (opens in a new tab), draw a resource histogram to show the number of workers required at each time when each activity begins at its earliest possible start time.

6e
Sme Calculator
2 marks

Determine whether or not the project can be completed in the minimum possible time using fewer workers than the number indicated by the resource histogram in (d). You must justify your answer with reference to the resource histogram and the completed Diagram 1.

7a
Sme Calculator
2 marks
fig-1-oct-2021-8fm0-27

Figure 1

A project is modelled by the activity network shown in Figure 1. The activities are represented by the arcs. The number in brackets on each arc gives the time, in hours, to complete the corresponding activity. The exact duration, x, of activity N is unknown, but it is given that 5 space less than space x space less than space 10.

Each activity requires one worker. The project is to be completed in the shortest possible time.

Complete the precedence table in the answer book (opens in a new tab).

7b
Sme Calculator
4 marks

Complete Diagram 1 in the answer book (opens in a new tab) to show the early event times and the late event times.

7c
Sme Calculator
1 mark

List the critical activities.

7d
Sme Calculator
1 mark

It is given that activity J can be delayed by up to 4 hours without affecting the shortest possible completion time of the project.

Determine the value of x. You must make the numbers used in your calculation clear.

7e
Sme Calculator
4 marks

Draw a cascade chart for this project on Grid 1 in the answer book (opens in a new tab).

8a
Sme Calculator
4 marks
fig-2-november-2021-9fm0-3d

Figure 2

A project is modelled by the activity network shown in Figure 2. The activities are represented by the arcs. The number in brackets on each arc gives the time, in hours, to complete the corresponding activity.

Complete Diagram 1 in the answer book (opens in a new tab) to show the early event times and the late event times.

8b
Sme Calculator
2 marks

Each activity requires one worker and the project must be completed in the shortest possible time using as few workers as possible.

Calculate a lower bound for the number of workers needed to complete the project in the shortest possible time. You must show your working.

8c
Sme Calculator
3 marks

Schedule the activities using Grid 1 in the answer book (opens in a new tab).

9a
Sme Calculator
2 marks
fig-5-november-2021-9fm0-3d

Figure 5

Figure 5 shows a partially completed activity network for a project that consists of 14 activities.

Complete the precedence table in the answer book (opens in a new tab) for the 8 activities in Figure 5.

9b
Sme Calculator
4 marks

The precedence table for the remaining 6 activities is given below.

Activity

Immediately preceding activities

I

D, E, G, H

J

D, E, G, H

K

E, G, H

L

I, J, K

M

J, K

N

J, K

Complete the activity network in the answer book (opens in a new tab) for the project. Your completed activity network must contain only the minimum number of dummies.

9c
Sme Calculator
2 marks

Given that all 14 activities have the same duration,

explain why activity D cannot be critical.

10a
Sme Calculator
3 marks
fig-4-specimen-2017-9fm0-3d

Figure 4

A project is modelled by the activity network shown in Figure 4. The activities are represented by the arcs. The number in brackets on each arc gives the time, in days, to complete that activity. Each activity requires one worker. The project is to be completed in the shortest possible time.

Calculate the early time and the late time for each event, using Diagram 1 in the answer book (opens in a new tab).

10b
Sme Calculator
3 marks

On Grid 1 in the answer book (opens in a new tab), complete the cascade (Gantt) chart for this project.

10c
Sme Calculator
3 marks

On Grid 2 in the answer book (opens in a new tab), draw a resource histogram to show the number of workers required each day when each activity begins at its earliest time.

10d
Sme Calculator
3 marks

The supervisor of the project states that only three workers are required to complete the project in the minimum time.

Use Grid 2 to determine if the project can be completed in the minimum time by only three workers. Give reasons for your answer.

11a
2 marks
Flowchart depicting nodes connected by arrows with labels A to K and numbers indicating event times. Key explains early and late event times.

The network in Figure 2 shows the activities that need to be completed for a project. Each activity is represented by an arc and the duration of the activity, in days, is shown in brackets. The early event times are shown in Figure 2.

Complete Table 1 below to show the immediately preceding activities for each activity.

Two tables titled 'Activity' and 'Immediately preceding activity' with rows A to E in the first table and F to K in the second.
11b
1 mark

It is given that 4 less than x less or equal than m

State the largest possible integer value of m.

11c
3 marks

(i) Complete Diagram 1 below to show the late event times.

(ii) State the activities that must be critical.

Flowchart diagram showing nodes connected by arrows with labels A to K and values in brackets. A key explains early and late event times.
11d
1 mark

Calculate the total float for activity G.

11e
2 marks

The resource histogram in Figure 3 shows the number of workers required when each activity starts at its earliest possible time. The histogram also shows which activities happen at each time.

Bar chart showing number of workers over time. Time axis from 0 to 22; worker count from 0 to 8. Various labelled bars indicate different worker shifts.

Complete Table 2 below to show the number of workers required for each activity of the project.

Two-column table with activities labelled A to K and corresponding empty columns for the number of workers, labelled Table 2 at the bottom.
11f
5 marks

Draw a Gantt chart on Grid 1 below to represent the activity network.

Horizontal line numbered from 0 to 22 at intervals of 2, with vertical dashed lines extending downwards. Labelled "Grid 1" below.
12a
3 marks
Flowchart diagram with nodes A to H and directional arrows indicating pathways with numbered values from 1 to 7, showing interconnections. Labelled as Figure 3.

The network in Figure 3 shows the activities that need to be undertaken to complete a project. Each activity is represented by an arc and the duration, in hours, of the corresponding activity is shown in brackets.

(i) Complete Diagram 1 in the answer book to show the early event times and the late event times.

Flowchart diagram showing a network of processes: A, B, C, D, E, F, G, H with times in brackets. Key explains early and late event times.

(ii) State the minimum completion time of the project.

12b
4 marks

The table below lists the number of workers required for each activity in the project.

Activity

Number of workers

A

2

B

1

C

2

D

2

E

3

F

2

G

1

H

3

Each worker is able to do any of the activities. Once an activity is started it must be completed without interruption. It is given that each activity begins at its earliest possible start time.

(i) On Grid 1 in the answer book, draw a resource histogram to show the number of workers required at each time.

Blank line graph titled 'Grid 1', with time in hours (1-14) on the x-axis and number of workers (0-8) on the y-axis, featuring a grid layout.

(ii) Hence state the time interval(s) when six workers are required.

13a
5 marks

The precedence table below shows the twelve activities required to complete a project.

Activity

Immediately preceding activities

A

B

C

D

A

E

A, B

F

D, E

G

A, B, C

H

F, G

I

D, E

J

D, E

K

F, G, I, J

L

I

Draw the activity network described in the precedence table, using activity on arc. Your activity network must contain the minimum number of dummies only.

13b
1 mark
Gantt chart showing tasks A to L over time, using a scale from 0 to 26. Tasks are aligned by start times, some overlap, and shaded sections indicate progress.

Figure 6 shows a partially completed cascade chart for the project. The non‑critical activities F, J and K are not shown in Figure 6.

The time taken to complete each activity is given in hours and the project is to be completed in the minimum possible time.

State the critical activities.

13c
1 mark

Given that the total float of activity F is 2 hours,

State the duration of activity F.

13d
2 marks

The duration of activity J is x hours, and the duration of activity K is y spacehours, where x space greater than space 0 and y space greater than space 0

(i) State, in terms of y space, the maximum possible total float for activity K.

(ii) State, in terms of x and y space, the total float for activity J.

14a
5 marks

The precedence table below shows the twelve activities required to complete a project.

Activity

Immediately preceding activities

A

B

C

D

A

E

A, B

F

D, E

G

A, B, C

H

F, G

I

D, E

J

D, E

K

F, G, I, J

L

I

Draw the activity network described in the precedence table, using activity on arc. Your activity network must contain the minimum number of dummies only.

14b
1 mark
Gantt chart showing tasks A to L over time, using a scale from 0 to 26. Tasks are aligned by start times, some overlap, and shaded sections indicate progress.

Figure 6 shows a partially completed cascade chart for the project. The non‑critical activities F, J and K are not shown in Figure 6.

The time taken to complete each activity is given in hours and the project is to be completed in the minimum possible time.

State the critical activities.

14c
1 mark

Given that the total float of activity F is 2 hours,

State the duration of activity F.

14d
2 marks

The duration of activity J is x hours, and the duration of activity K is y spacehours, where x space greater than space 0 and y space greater than space 0

(i) State, in terms of y space, the maximum possible total float for activity K.

(ii) State, in terms of x and y space, the total float for activity J.

15a
5 marks

The precedence table below shows the 12 activities required to complete a project.

Activity

Immediately preceding activities

A

B

C

D

A

E

A, B, C

F

A, B, C

G

C

H

D, E

I

D, E

J

D, E

K

F, G, J

L

F, G

Draw the activity network described in the precedence table, using activity on arc.

Your activity network must contain the minimum number of dummies only.

15b
4 marks

Each of the activities shown in the precedence table requires one worker. The project is to be completed in the minimum possible time.

Diagram with horizontal bars labelled A to L aligned on a 0 to 20 number line. Bars F and G are shaded. It is titled "Figure 3".

Figure 3 shows a schedule for the project using three workers.

(i) State the critical path for the network.

(ii) State the minimum completion time for the project.

(iii) Calculate the total float on activity B.

(iv) Calculate the total float on activity G.

15c
2 marks

Immediately after the start of the project, it is found that the duration of activity I, as shown in Figure 3, is incorrect. In fact, activity I will take 8 hours. The durations of all the other activities remain as shown in Figure 3.

Determine whether the project can still be completed in the minimum completion time using only three workers when the duration of activity I is 8 hours. Your answer must make specific reference to workers, times and activities.