1a2 marks
The diagram below shows part of the graph where .
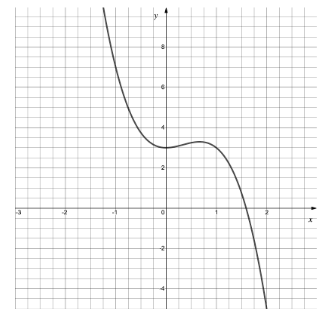
(i) Find
(ii) Find
1b3 marks
Write down an interval, in the form , such that , explain clearly your choice of values for a and b.
Was this exam question helpful?
Exam code: H240
The diagram below shows part of the graph where .
(i) Find
(ii) Find
Write down an interval, in the form , such that , explain clearly your choice of values for a and b.
Was this exam question helpful?
A solution to the equation is , correct to two significant figures.
(i) Write down the lower bound, l, and the upper bound, u, of 3.1.
(ii) Assuming is continuous in the interval , what can you say about the values of and ?
Was this exam question helpful?
Show that the equation can be rewritten as
Starting with , use the iterative formula
to find values for and , giving each to four decimal places where appropriate.
Was this exam question helpful?
The functionis defined as
Use the sign change rule to show there is a root, , of in the interval .
(i) Find
(ii) Show that, in this instance, the Newton-Raphson method would be given by the iteration
(i) Use the Newton-Raphson method with to find values of and , giving each to five decimal places.
(ii) Use your answers to part (i) to estimate to the highest degree of accuracy possible.
Was this exam question helpful?
The diagram below shows part of the graph with equation .
The trapezium rule is to be used to estimate the shaded area of the graph which is given by the integral
(i) Given that 4 strips are to be used, calculate the width of each strip, h.
(ii) Complete the table of values below, giving each entry correct to three significant figures.
x | 1 | 1.25 | 1.5 | 1.75 | 2 |
y | 3.90 |
|
| 4.48 |
|
(iii) Use the trapezium rule with the values from the table in part (ii) to find an estimate of the shaded area.
Was this exam question helpful?
The graph of where is shown below. θ is measured in radians and -

Given that .
(i) Find and .
(ii) Explain how, in this case, the change of sign rule fails to locate a root of in the interval (1.5 , 1.6).
Was this exam question helpful?
A student is trying to find a solution to the equation using an iterative formula.
The student rearranges into the form .
The diagram below shows a sketch of the graphs of and .

The student is trying to find the root , starting with an initial estimate . Show on the diagram, how the iterative formula will converge and find the root . Mark the -axis with the positions of and .
Was this exam question helpful?
The diagram below shows part of the graph with equation .

The trapezium rule is to be used to estimate the shaded area of the graph which is given by the integral
(i) All of the values in the table below will be used in the trapezium rule. Write down the number of ordinates that will be used, the number of strips and the width of each strip. x 4 5 6 7 8 9 10 y 1.59 2.08 2.52 2.92 3.30 3.70 4.00
(ii) Apply the trapezium rule, using the values above, to find an estimate of the shaded area.
(iii) State, with a reason, whether your answer to part (ii) is an over-estimate or an under-estimate.
Was this exam question helpful?
The diagram below shows part of the graph where

(i) Find and , giving your answers to three significant figures.
(ii) Briefly explain the significance of your results from part (i).
One of the solutions to the equation is , correct to three significant figures.
(i) Write down the upper and lower bound of 2.55.
(ii) Hence, use the sign change rule to confirm that this is a solution (to three significant figures) to the equation .
Was this exam question helpful?
Show that the equation can be rewritten as
Starting with , use the iterative formula
to find a root of the equation , correct to two decimal places.
Was this exam question helpful?
The function is defined as
Use the sign change rule to show there is a root to the equation in the interval .
Find .
Use the Newton-Raphson method with to find the root in the interval correct to three decimal places.
Was this exam question helpful?
The diagram below shows part of the graph with equation .

The trapezium rule is to be used to estimate the shaded area of the graph which is given by the integral.
Given that 4 strips are to be used, calculate h, the width of each strip.
Complete the table of values below, giving each entry correct to three significant figures.
x | 5 | 6.25 | 7.5 | 8.75 | 10 |
y | 3.05 |
| 4.04 |
|
|
Find an estimate of the shaded area using the values from the table in part (b).
State whether your answer to part (c) is an overestimate or an underestimate.
Was this exam question helpful?
Part of the graph of is shown below, where is measured in radians.
Explain why the change of sign rule would fail if attempting to locate a root of the function using the values of θ = 1.55 and θ = 1.65.
Was this exam question helpful?
The diagram below shows the graphs of format('truetype')%3Bfont-weight%3Anormal%3Bfont-style%3Anormal%3B%7D%3C%2Fstyle%3E%3C%2Fdefs%3E%3Ctext%20font-family%3D%22Times%20New%20Roman%22%20font-size%3D%2218%22%20font-style%3D%22italic%22%20text-anchor%3D%22middle%22%20x%3D%224.5%22%20y%3D%2216%22%3Ey%3C%2Ftext%3E%3Ctext%20font-family%3D%22math17f39f8317fbdb1988ef4c628eb%22%20font-size%3D%2216%22%20text-anchor%3D%22middle%22%20x%3D%2218.5%22%20y%3D%2216%22%3E%3D%3C%2Ftext%3E%3Ctext%20font-family%3D%22Times%20New%20Roman%22%20font-size%3D%2218%22%20font-style%3D%22italic%22%20text-anchor%3D%22middle%22%20x%3D%2231.5%22%20y%3D%2216%22%3Ex%3C%2Ftext%3E%3C%2Fsvg%3E) and .
and .

The iterative formula
is to be used to find an estimate for a root, , of the function.
Write down an expression for .
Using an initial estimate, , show, by adding to the diagram above, which of the two points (S or T) the sequence of estimates will converge to.
Hence deduce whether is the -coordinate of point S or point T.
Find the estimates and , giving each to three decimal places.
Confirm that α = 4.146 correct to three decimal places.
Was this exam question helpful?
The diagram below shows the graph of , , where α and β are roots of the function.

The Newton-Raphson method is to be used to estimate the values of α and β.
Draw a line on the diagram to indicate a starting value () that would lead the Newton-Raphson method to fail in finding either root. (It is not required that you state the value of .)
Show that
Use the Newton-Raphson method with to find β correct to five significant figures.
Was this exam question helpful?
The diagram below shows the graph with equation .

The area shaded is to be estimated using the trapezium rule where .
(i) Write down the number of strips to be used.
(ii) Write down the number of ordinates to be used.
Apply the trapezium rule as described above to estimate the shaded area, giving your answer to three significant figures.
Describe a way in which the estimate calculated in part (b) could be improved.
Was this exam question helpful?
The diagram below shows part of the function where.

Correct to three significant figures, and.
Explain why using the sign change rule with these values would not necessarily be helpful in finding the root close to .
Using suitable values of x, show that there is a root close to .
Show that the root close to is 0.982, correct to three significant figures.
Was this exam question helpful?
The diagram below shows a sketch of the graphs , and .

An iterative formula is used to find roots to the equation .
On the diagram above show that the iterative formula
would converge to the root close to when using a starting value of .
(i) Use in the iterative formula from part (a) to find three further approximations to the root close to. Give each approximation correct to three significant figures.
(ii) Comment on your approximations and what they suggest about convergence to the root close to .
Confirm that the root close to is 3.49 correct to three significant figures.
Was this exam question helpful?
The function is defined as
, where is in radians.
Find .
Use the Newton-Raphson method with to find a root, α, of the equation , correct to four decimal places.
The graph of has a local maximum point at . Briefly explain why the Newton-Raphson method would fail if the exact value of β was used for .
Was this exam question helpful?
The diagram below shows part of the graph with equation

Use the trapezium rule with 5 strips to find an estimate for the shaded area, giving your answer to three significant figures.
Was this exam question helpful?
The diagrams below show the graphs of four different functions.


Match each graph above with the correct statement below.
The sign change rule with values of and would indicate a root but has failed due to the discontinuity (asymptote) at .
The sign change rule with values of and would indicate no root but has failed because there are two roots in the interval (1 , 5).
The sign change rule with values of and would indicate no root but fail as there are two roots in the interval (3 , 5).
The sign change rule with values of and would indicate no root but has failed to find the root as the graph has a turning point at .
Was this exam question helpful?
The diagram below shows the graphs of and .

Show on the diagram, using the value of indicated, how an iterative process will lead to a sequence of estimates that converge to the x-coordinate of the point P. Mark the estimates and on your diagram.
By finding a suitable iterative formula, use to estimate a root to the equation correct to two significant figures.
Confirm that your answer to part (b) is correct to two significant figures.
Was this exam question helpful?
The diagram below shows part of the graph of where .

Write down the x-coordiante of the point marked M on the graph.
The first two positive roots of the function , α and β, are marked on the graph above. The Newton-Raphson method is to be used to find a sequence of estimates for the root β.
Indicate on the graph above a value of in the interval (α , β) that would lead to the Newton-Raphson method converging to the root (i) α and (ii) β.
Using the Newton-Raphson method with , find four more estimates for the root β.
Verify that your final estimate gives the value of β correct to five significant figures.
Was this exam question helpful?
Use two separate diagrams to show how the trapezium rule can lead to an underestimate or an overestimate when used to estimate the area under a curve.
Use the trapezium rule with to find an estimate for the area bounded by the curve with equation , the lines with equations and and the x-axis.
Give your answer to three significant figures.
The integral
can be evaluated exactly by applying the method of integration by parts (twice). Suggest a reason why it may be preferrable to use a numerical method, such as trapezium rule, to estimate the integral rather than use integration by parts to find its exact value.
Was this exam question helpful?
The diagram below shows the graph of where the function is defined by

The function has a root close to .
Using the iterative formula
with , find an estimate of the root near to six decimal places
Given that, use the Newton-Raphson method with to find an estimate of the root near to six decimal places.
Justify which of the methods in this case was more efficient at finding the root close to to six decimal places.
Was this exam question helpful?
Use the two diagrams below to show how rectangles can be used to give an upper and lower bound when estimating the area under a curve using the trapezium rule.


Was this exam question helpful?
The diagram below shows part of the graph with equation .

A student searches for a root of the equation .
They find that and that .
The student concludes that there is a root in the interval .
Explain why the student’s conclusion is incorrect.
Verify that is a solution to the equation
Explain why the sign change rule would fail if searching for the root of the equation .
Was this exam question helpful?
The function, is defined by
Show that the equation can be written in the form
On the same diagram sketch the graphs of and .
The equation has a root, α, close to .
The iterative formula xn+1=e-xn+1 with x0=2 is to be used to find correct to three significant figures.
Show, using a diagram and your answer to part (b), that this formula and initial x value will converge to the root α.
(i) Find the values ofand , giving each correct to three significant figures.
(ii) How many iterations are required before and agree to two decimal places?
The root lies in the interval .
Write down the values of p and q such that can be deduced accurate to two decimal places from the interval.
Was this exam question helpful?
The function f(x) is defined as
Show that
Use the Newton-Raphson method with to find a root of the equation correct to five significant figures.
Write down the exact value of a root to the equation .
Was this exam question helpful?
The trapezium rule is to be used to find an estimate for the integral
The table below shows values for x and f(x), rounded to three significant figures where appropriate.
x | 4 | 4.5 | 5 | 5.5 | 6 | 6.5 | 7 | 7.5 | 8 |
f(x) | 3.16 | 3.39 | 3.61 | 3.81 | 4 | 4.18 | 4.36 | 4.53 | 4.69 |
Using the values in the table find
(i) an estimate for the integral using 2 strips,
(ii) an estimate for the integral using 4 strips,
(iii) an estimate for the integral using 8 strips.
Justify which of the estimates from part (a) will be the most accurate estimate for the integral.
Was this exam question helpful?
Sketch three separate graphs with values of and , to show how the sign change rule would fail to find a root α in the interval (p , q) for the following reasons:.
(i) Sign change rule indicates a root but there isn’t one due to a discontinuity in the graph.
(ii) Sign change rule indicates no root but there is a root at a turning point.
(iii) Sign change rule indicates no root but there are in fact two roots in the interval p , q.
On each diagram, clearly labelled p, q and the root α.
Was this exam question helpful?
Sketch two separate diagrams to show how an iterative formula of the form can diverge in two different ways when being used to find an estimate for a root to the equation .
Was this exam question helpful?
Draw a diagram to show how the Newton-Raphson method produces a series of estimates that converge to a root, α. On your diagram you should indicate the values α, x0, x1 and x2.
Use the Newton-Raphson method with to find a solution to equation
correct to four significant figures.
Verify that there is another solution in the interval (0.605 , 0.615) and state the value of the root to the highest degree of accuracy possible.
Was this exam question helpful?
The diagram below shows the graph of

Use the trapezium rule with h = 0.2 to find an estimate of the integral
to three significant figures.
Using the integration feature on your calculator, find the value of
Give your answer to three significant figures.
Assuming your calculator provides the exact answer to the integral, find the percentage error of your estimate from part (a).
Was this exam question helpful?
The diagram below shows the graph of where the function is defined by

The function f(x) has a root close to .
Estimates for this root could be found using iteration or the Newton-Raphson method.
(i) Suggest a suitable starting value for both methods.
(ii) Rearrange f(x) into the form
(iii) Find an expression for f '(x)
Using your answers to part (a) use an iterative method to find the root of close to to four decimal places.
Using your answers to part (a) use the Newton-Raphson method to find the root of close to to four decimal places.
Comment on the efficiency of the two methods in finding the root close to to four decimal places.
Was this exam question helpful?
The diagram below shows a sketch of the graph of

The graph has a local maximum point at (2 , 32) as indicated on the diagram.
Use the trapezium rule with 5 ordinate values to estimate the area shaded.
Using the appropriate working values from part (a), find an upper and lower bound for the area shaded.
Suggest a reason why using the trapezium rule in this case is not appropriate.
Was this exam question helpful?