Half-Life (WJEC GCSE Physics): Revision Note
Exam code: 3420

Half-Life
Activity
Objects containing radioactive nuclei are called sources of radiation
Sources of radiation decay at different rates which are defined by their activity
The activity of a source is defined as
The rate at which the unstable nuclei from a source of radiation decay
Activity is measured in becquerels
The symbol for becquerels is Bq
1 becquerel is equal to 1 nucleus in the source decaying in 1 second
Half-Life
It is impossible to know when one particular unstable nucleus will decay
But the rate at which the activity of a sample decreases can be known
This is known as the half-life
Half-life is defined as:
The time it takes for the number of nuclei of a sample of radioactive isotopes to decrease by half
In other words, the time it takes for the activity of a sample to fall to half its original level
Different isotopes have different characteristic half-lives and half-lives can vary from a fraction of a second to billions of years in length
Decay Curves
Scientists can measure the half-lives of different isotopes accurately
To determine the half-life of a sample, a decay curve can be plotted, the procedure for this is:
Measure the initial activity A0 of the sample at time t = 0
Record the activity at equal intervals of time
Plot a graph of activity A against time t
Using the graph, determine the time taken for the activity to decrease to half its original value - this is the half-life
On a decay curve, the y-axis could be either the activity A or the number of undecayed nuclei N, but the x-axis will always be time t
Determining Half-Life using a Decay Curve
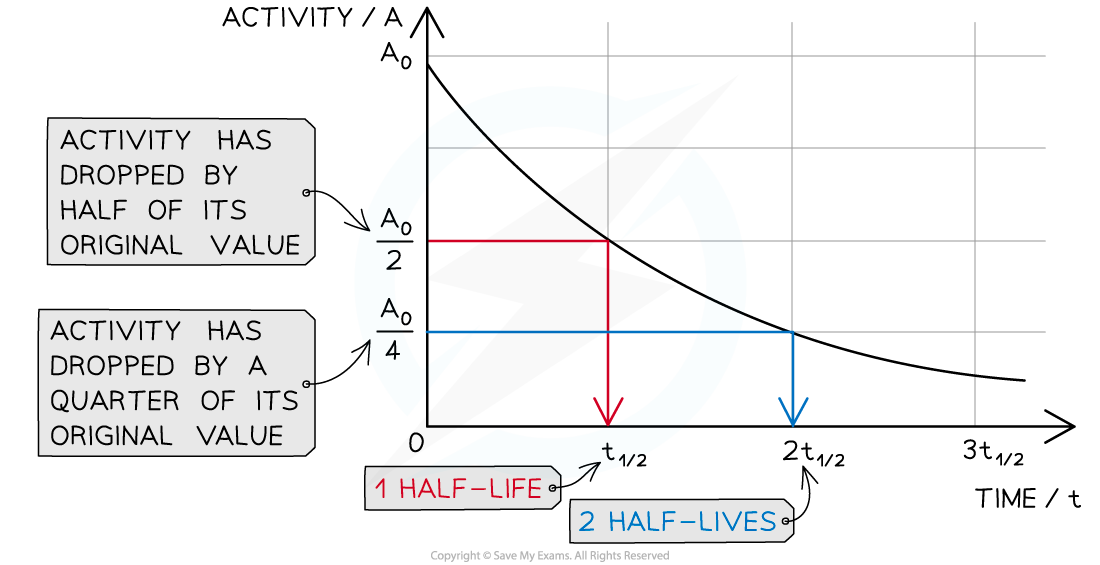
The graph shows how the activity of a radioactive sample changes over time. Each time the original activity halves, another half-life has passed
The time it takes for the activity of the sample to decrease from 100 % to 50 % is the half-life
It is the same length of time as it would take to decrease from 50 % activity to 25 % activity
The half-life is constant for a particular isotope
Worked Example
The radioisotope technetium is used extensively in medicine. The graph below shows how the activity of a sample varies with time.

Determine the half-life of this material.
Answer:
Step 1: Draw lines on the graph to determine the time it takes for technetium to drop to half of its original activity
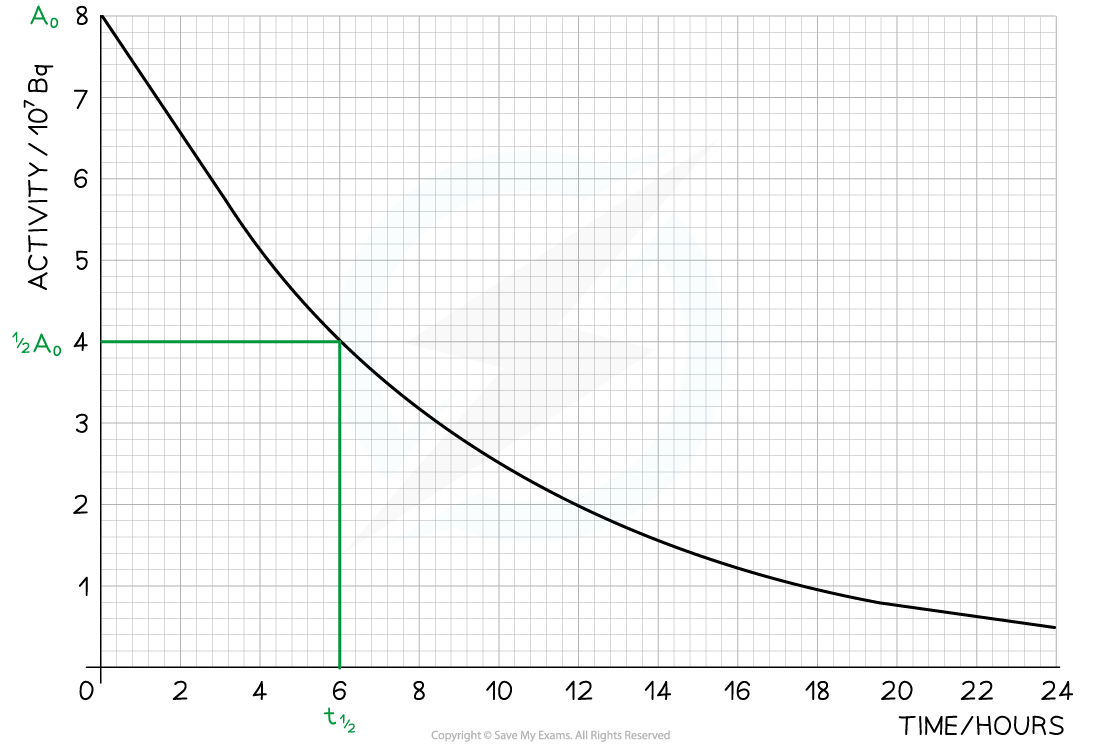
Step 2: Read the half-life from the graph
From the graph, the initial activity is A0 = 8 × 10⁷ Bq
The time taken to decrease to half this value, or ½ A0 = 4 × 10⁷ Bq, is 6 hours
Therefore, the half-life of this isotope is 6 hours

Unlock more, it's free!
Join the 100,000+ Students that ❤️ Save My Exams
the (exam) results speak for themselves:

Was this revision note helpful?