Combinations of Transformations (AQA A Level Maths: Pure): Exam Questions

Exam code: 7357

3 hours38 questions
1
4 marks

The diagram below shows the graph of y=f(x).

The stationary point A(2 ,8) is marked on the diagram.

q1-2-10-combinations-of-transformations-a-level-only-edexcel-a-level-pure-maths-easy

On separate diagrams, sketch the following graphs

(i) y=2f(x)+1

(ii) y=12f(x+1)

On each diagram, state the coordinates of the image of point A under the given transformations.

2
2 marks

A graph has the equation y=f(x).

For each of the transformations described below, find the equation of the graph in terms of f(x).

(i) A translation of y=f(x) by (23)

(ii) A horizontal stretch of y=f(x) by a scale factor of 2, followed by a vertical stretch of scale factor 3.

3
4 marks

Describe, in order, a sequence of transformations that maps the graph of y=f(x) on to each of the following equations below:

(i) y=3f(x)1

(ii) y=13f(x1)

4
4 marks

Describe, in order, a sequence of transformations that maps the graph of y=f(x) on to each of the following equations below:

(i) y=3f(x+2)

(ii) y=f(x)1

5
4 marks

The equation y=f(x), where f(x)=(x2)2, is shown below.

q6-2-10-cobinations-of-transformations-a-level-only-edexcel-a-level-pure-maths-easy

The points A and B are the points where the graph meets the coordinate axes.

(i) Find the coordinates of A and B.

(ii) The graph of y=f(x) is transformed to the graph of y=f(x)4. Find the coordinates of the images of points A and B.

6a
2 marks

The diagram shows the graph of y=f(t), where f(t)=cos t0°t360°.

q7a-2-10-combinations-of-transformations-a-level-only-edexcel-a-level-pure-maths-easy

(i) Write down the minimum value of y.

(ii)  Write down the value of t for which this minimum occurs.

6b
2 marks

(i) Find the minimum value of y=3f(t45°) where 0°t360°.

(ii) Find the value of t for which this minimum occurs.

7
2 marks

The graph of y=f(x) is transformed in the following order:

  1. A reflection in the y-axis

  2. A vertical stretch of scale factor 4

  3. A translation by (02)

Find the equation of the graph after these transformations, in terms of f(x).

8
2 marks

The diagram below shows the graph of y=g(x) where

g(x)=1x,             x0

q9-2-10-combinations-of-transformations-a-level-only-edexcel-a-level-pure-maths-easy

(i) Write down the equations of the two asymptotes.

(ii) Find the equations of the two asymptotes on the graph of y=g(x1)+5.

9a
2 marks

The function g(x) is given by

g(x)=2x

On the same diagram, sketch the graphs of y=g(x) and y=g1(x).

9b
2 marks

(i) Find an expression for g1(x) in terms of x.

(ii) Describe the type of stretch that transforms y=g(x) to y=g1(x).

10a
1 mark

The graph of y=f(x) where f(x)=2x3 is shown below.

q3a-2-10-combinations-of-transformations-a-level-only-edexcel-a-level-pure-maths-easy

Find the coordinates of the points marked A and B.

10b
3 marks

(i) On the diagram in part (a), sketch the graph of y=|f(x1)|

(ii) Find the coordinates of the image of the points A and B under the transformation in part (b)(i).

11
4 marks

The diagram below shows the graph of y=f(x).

The stationary points are marked on the diagram.

q1-2-10-combinations-of-transformations-a-level-only-edexcel-a-level-pure-maths-medium

On separate diagrams, sketch the graphs with equations

(i) y=2f(x)4

(ii) y=f(x+1)+3

On each diagram, state the coordinates of the images of the points A and B under the given transformation.

12
2 marks

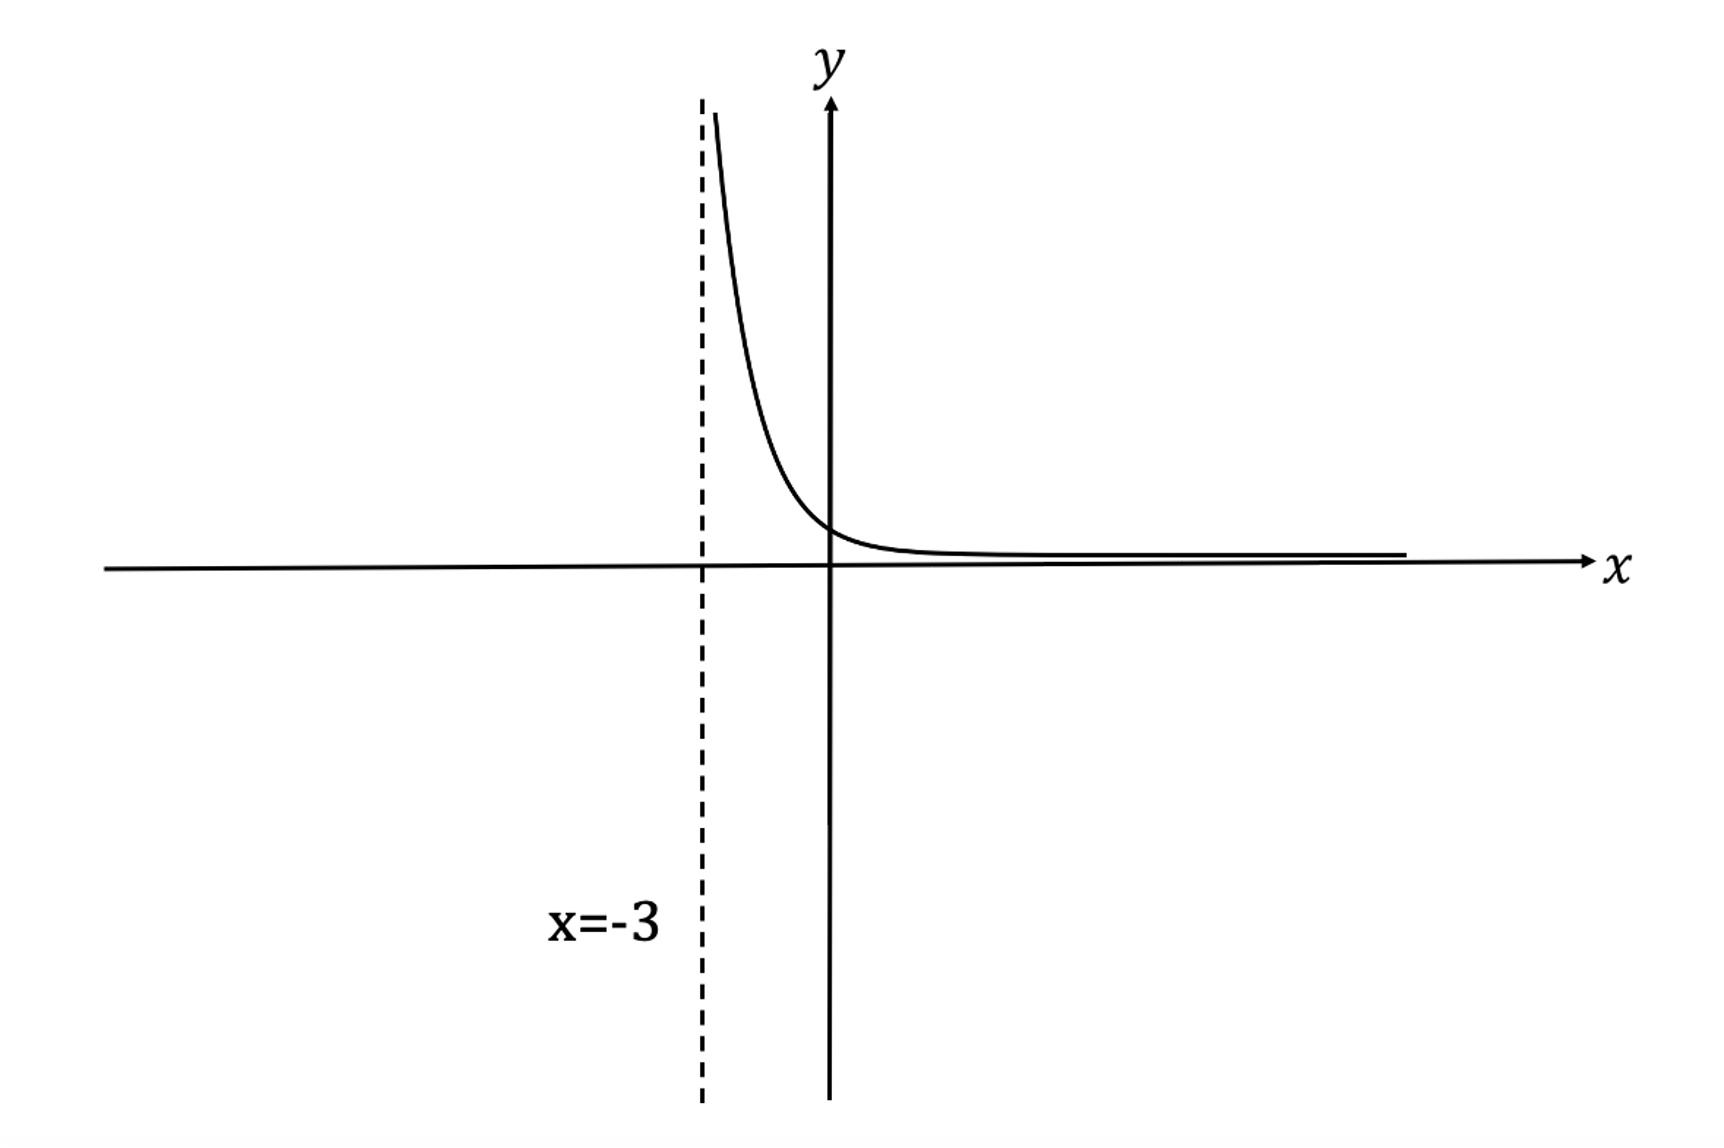
Here is the graph of the function  y=f(x)

Graph of a rational function with a vertical asymptote at x = -3 and a horizontal asymptote approaching the x-axis. Axes labelled x and y.

Sketch the graph of

y=f(x+2).

1
3 marks

The graph of y=f(x) is transformed in the following order:

  1. A horizontal stretch by scale factor 2

  2. A reflection in the x-axis

  3. A translation by (02)

Find the equation of the graph after these transformations, in terms of f(x).

2
3 marks

The point with coordinates (1 ,4) is the only stationary point on the curve with equation y=h(x).

Find the coordinates of the stationary point on the following curves:

(i) y=2h(x1)

(ii) y=h(x+1)+2

(iii) y=|h(3x)+2|

3
6 marks

The graph of y=f(x) is shown below.

The points A(2, 10) and B(4, 10) are the stationary points on the curve.

ib-aa-hl-2-6-q14m-image

Sketch each of the graphs below.

(i) y=f(2x1)

(ii) y=f(4x)

Label the coordinates of the images of the points A and B.

4
3 marks

Describe, in order, a sequence of transformations that maps the graph of y=ln x on to the graph of

y=5+ln(12x+4)

5
3 marks

The turning point on the graph of y=f(x) has coordinates (2 ,5) as shown on the diagram below.

q12-2-10-combinations-of-transformations-a-level-only-edexcel-a-level-pure-maths-medium

(i) On the diagram above, sketch the graph of y=|f(x)|+1 and label the coordinates of the turning point.

(ii) State the vertical distance between the turning points on the graphs of y=f(x) and y=|f(x)|+1

6a
2 marks

The diagram shows the graph of y=f(t), where

f(t)=sin(2t)            0°t180°

q7a-2-10-combinations-of-transformations-a-level-only-edexcel-a-level-pure-maths-medium

(i) Write down the maximum value of y on the graph of y=3f(t) for 0°t180°.

(ii) Write down the value of t for which this maximum value occurs.

6b
2 marks

(i) Find the minimum value of y on the graph of y=5f(t+30°) for 0°t180°.

(ii) Find the value of t for which this minimum value occurs.

6c
1 mark

The transformation f(at)+b maps y=f(t) on to the graph of y=2+sin t, where 0°t180°.

Find the values of a and b.

7
6 marks

The diagram below shows the graph of y=f(x).

The stationary points and x-intercepts are marked on the diagram.

q1-2-10-hard-aqa-a-level-maths-pure

On separate diagrams, sketch the graphs with equations

(i) y=f(x2)+2

(ii) y=f(x1)

On each diagram, state the coordinates of the images of the points A, B and C under the given transformation.

8a
2 marks

The equation y=f(x), where f(x)=(xa)2, with a>1, is shown below.

q6a-2-10-combinations-of-transformations-a-level-only-edexcel-a-level-pure-maths-medium

The points A and B are the points where the graph intercepts the coordinate axes.

Find, in terms of a, the coordinates of A and B.

8b
3 marks

Sketch the graph of y=f(x)

Label the coordinates of the images of the points A and B in terms of a.

8c
1 mark

Find the value of a such that the point A is three times as far from the origin as the point B.

9
3 marks

The graph y=f(x) is transformed in the following order:

  1. A translation by (20)

  2. A reflection in the y-axis

  3. A vertical stretch by a scale factor of 23

  4. A translation by (04)

Find the equation of the graph after these transformations, in terms of f(x).

10
4 marks

A function is given by

f(x)=3x22x

The curve y=f(x) is transformed to the curve y=g(x) by applying the following transformations to y=f(x) in order:

  1. Translation by (20)

  2. Vertical stretch of scale factor 4

  3. Translation by (03)

Find an expression for g(x) in the form ax2+bx+c where a, b and c are constants to be found.

1
4 marks

Describe, in order, a sequence of transformations that maps the graph of y=f(x) onto the following graphs:

(i) y=f(3x1)

(ii) y=2f(5x)

2
3 marks

A function is given by

f(x)=ln(2x+1)

A different function, g(x), is obtained by applying the following sequence of transformations to f(x) in order:

  1. A translation by (30)

  2. A horizontal stretch by a scale factor of 12

  3. A reflection in the x-axis

Find an expression for g(x), giving your answer in the form aln(bx+c) where a, b and c are integers.

3a
3 marks

A sketch of the graph with equation y=f(x), where

f(x)=(x24)2

is shown below.

q6a-2-10-combinations-of-transformations-a-level-only-edexcel-a-level-pure-maths-hard

The points A, B and C are the points where the graph meets the coordinate axes.

Sketch the graph of y=3f(2x), labelling the coordinates of the images of the three points A, B and C.

3b
3 marks

On the graph of y=f(x+a)+b where a and b are non-zero constants, none of the points A, B and C lie on the coordinate axes.

State the values that a and b cannot take.

4a
2 marks

The diagram shows the graph of y=f(t), where

f(t)=cos t              0°t360°

q7a-2-10-combinations-of-transformations-a-level-only-edexcel-a-level-pure-maths-hard

(i) Find the maximum value of y on the graph of y=2f(3t)

(ii) Find the value of t for which this maximum occurs.

4b
3 marks

Find in the form

af(bt+c)+d

where a, b, c and d are constants, a transformation that would map the graph of y=f(t) onto the graph of

y=24sin t                  0°t180°

5a
2 marks

The diagram below shows the graph of y=g(x) where

g(x)=2x+1x1,              x1

q8a-2-10-combinations-of-transformations-a-level-only-edexcel-a-level-pure-maths-medium

Find the equations of the asymptotes.

5b
2 marks

Find the equations of any asymptotes on the graph of y=g(2x)3

5c
1 mark

Find the range of the function h where

 h(x)=|g(3x)2|                    x13

6a
2 marks

The function g is given by

g(x)=1ax

where

  • a is a non-zero constant

  • the domain of g is x0

The graph of y=g(x) is shown below.

q8a-2-10-combinations-of-transformations-a-level-only-edexcel-a-level-pure-maths-hard

Find the equations of the asymptotes on the graph of y=3g(2x+1).

6b
2 marks

The function f is defined by

f(x)=2g(3+x3)4

  • The domain of f is xp

  • The range of f is f(x)q

Find the constants p and q.

7
3 marks

The point with coordinates (3 ,5) is the only stationary point on the curve with equation y=h(x).

Find the coordinates of the stationary point on the following curves:

(i) y=|h(2x)5|

(ii) y=h(14x+1)

(iii) y=215h(x2)

8a
2 marks

The minimum point on the graph of y=f(x) has coordinates (4 ,8), as shown on the diagram below.

q10a-2-10-combinations-of-transformations-a-level-only-edexcel-a-level-pure-maths-hard

Sketch the graph of y=|f(2x)|3 and label the coordinates of the local maximum point.

8b
Sme Calculator
2 marks

Find the exact distance between the minimum point on the curve y=f(x) and the maximum point on the curve y=|f(2x)|3.

9
4 marks

A function is given by

f(x)=e3xx6

The curve y=f(x) is transformed to the curve y=g(x) by applying the following transformations to y=f(x) in order:

  1. A horizontal stretch of scale factor 3

  2. The modulus of the function is then taken

  3. A reflection in the y-axis

Show that

g(x)=a|bex+x+c|

where a, b and c are constants to be found.

1
6 marks

The diagram below shows the graph of y=f(x).

The coordinates of the stationary points and intercepts with the axes are also shown, given in terms of a where a is a positive constant.

q1-2-10-combinations-of-transformations-a-level-only-edexcel-a-level-pure-maths-veryhard

On separate diagrams, sketch the graphs with the following equations:

(i) y=2f(x33)

(ii) y=12f(1+x)

On each diagram, state the coordinates of the images of the points A, B and C under the given transformation, in terms of a.

2a
3 marks

Describe, in order, a sequence of transformations that maps the graph of y=f(x)  on to the graph of

y=af(x+b)+c

where a, b and c are constants and a>1.

2b
2 marks

Explain how the answer to part (a) changes in the cases when

(i) a=1

(ii) a<0

3
4 marks

A function is given by

p(x)=2x+1                   x

The graph of y=p(x) is transformed in the following order:

  1. A horizontal stretch of scale factor k, where k>0

  2. A translation of (0m)

  3. A vertical stretch of scale factor 1k

The equation of the graph after these transformations is y=p1(x), where p1 is the inverse function of p.

Find the values of the constants k and m.

4a
3 marks

A sketch of the graph with equation y=f(x), where

f(x)=(x2a)2

with a>1 is shown below.

q7a-2-10-combinations-of-transformations-a-level-only-edexcel-a-level-pure-maths-veryhard

The points A, B and C are points where the graph meets the coordinate axes.

Find, in terms of a, the coordinates of A, B and C.

4b
4 marks

Sketch the graph of y=12f(x1)

Label the coordinates of the images of the three points A, B and C in terms of a.

4c
3 marks

The graph of

y=af(bx+c)+d

is such that

  • the images of the points A, B and C lie on their original coordinate axes

  • the image of B is three times its previous distance from the origin

  • the images of A and B are 20% of their previous distances from the origin

  • the x-coordinate of the point C is negative

Find a, b, c and d.

5
4 marks

The point with coordinates (a , a2) where a>0 is the only stationary point on the curve with equation y=h(x).

Find, in terms of a, the coordinates of the stationary point on the following curves:

(i) y=3h(x2)2

(ii) y=3|h(x)|

(iii) y=13[h(13x13)+1]

6a
Sme Calculator
4 marks

A sketch of the graph with equation y=f(x) where

f(x)=10xx216

is shown below.

  • The points A and B are the x-axis intercepts

  • The point C is the maximum point

q9a-2-10-combinations-of-transformations-a-level-only-edexcel-a-level-pure-maths-veryhard

On the same diagram, sketch the graph of

y=|14f(12x)|

Find the coordinates of the points «math xmlns=¨http://www.w3.org/1998/Math/MathML¨»«semantics»«mrow»«mi»A«/mi»«mo»`«/mo»«/mrow»«annotation encoding=¨application/vnd.wiris.mtweb-params+json¨»{¨fontFamily¨:¨Times New Roman¨,¨fontSize¨:¨18¨,¨autoformat¨:true,¨toolbar¨:¨«toolbar ref=`general`»«tab ref=`general`»«removeItem ref=`setColor`/»«removeItem ref=`bold`/»«removeItem ref=`italic`/»«removeItem ref=`autoItalic`/»«removeItem ref=`setUnicode`/»«removeItem ref=`mtext` /»«removeItem ref=`rtl`/»«removeItem ref=`forceLigature`/»«removeItem ref=`setFontFamily` /»«removeItem ref=`setFontSize`/»«/tab»«/toolbar»¨}«/annotation»«/semantics»«/math», B' and C', the images of the points A, B and C respectively.

6b
Sme Calculator
2 marks

The area of triangle ABC is k times the area of triangle A'B'C'.

Find k, giving a reason for your answer.

7a
2 marks

The diagram shows the graph of y=f(t), where

f(t)=cosec t            0°t360°

q8a-2-10-combinations-of-transformations-a-level-only-edexcel-a-level-pure-maths-veryhard
  • The vertical distance between the minimum point and the maximum point is 2

  • The horizontal distance between the minimum point and the maximum point is 180

Find, in terms of a, the vertical and horizontal distances between the minimum point and maximum point on the graph of

y=1af(at)              a0

7b
Sme Calculator
3 marks

The exact distance between the minimum point and maximum point on the graph of

y=1af(at)              a0

is given by

2ka

where k is a positive integer.

Find the value of k.