14 marks
State whether the following functions could represent exponential growth or exponential decay.
(i)
(ii)
(iii)
(iv)
Was this exam question helpful?
Exam code: 9709
State whether the following functions could represent exponential growth or exponential decay.
(i)
(ii)
(iii)
(iv)
Was this exam question helpful?
Write the following in the form , where is a constant and .
(i)
(ii)
(iii)
Was this exam question helpful?
Write the following in the form , where is a constant and .
(i)
(ii)
(iii)
Was this exam question helpful?
The diagram below shows a sketch of the graph of .
On the diagram, add the graph of , labelling the point at which the graph intersects the -axis.
Write down the equation of any asymptotes on the graph.

Was this exam question helpful?
By taking logarithms (base ) of both sides show that the equation
can be written in the form
Hence
(i) write the equation in the form
(ii) write the equation in the form
Was this exam question helpful?
The number of rare birds, , in a newly constructed nature reserve at time years after their release is modelled by the equation
where is a constant. Initially, 24 birds are released into the reserve.
State the value of .
Find the number of birds in the reserve when .
Find the time taken for the number of birds in the reserve to double.
Was this exam question helpful?
The acceleration, , of a rocket seconds after lift-off is modelled by the equation
where .
State the initial acceleration of the rocket.
Find the acceleration of the rocket when .
Find the time taken for the acceleration to reach .
Was this exam question helpful?
An exponential growth model for the number of bacteria in an experiment is of the form
is the number of bacteria and is the time in hours since the experiment began.
and are constants.
A scientist records the number of bacteria at hourly intervals over a four-hour period.
The results are shown in the table below.
, hours | 0 | 1 | 2 | 3 | 4 |
|---|---|---|---|---|---|
, no. of bacteria | 100 | 210 | 320 | 730 | 1580 |
(3 s.f.) | 4.61 | 5.35 | 5.77 | 6.59 | 7.37 |
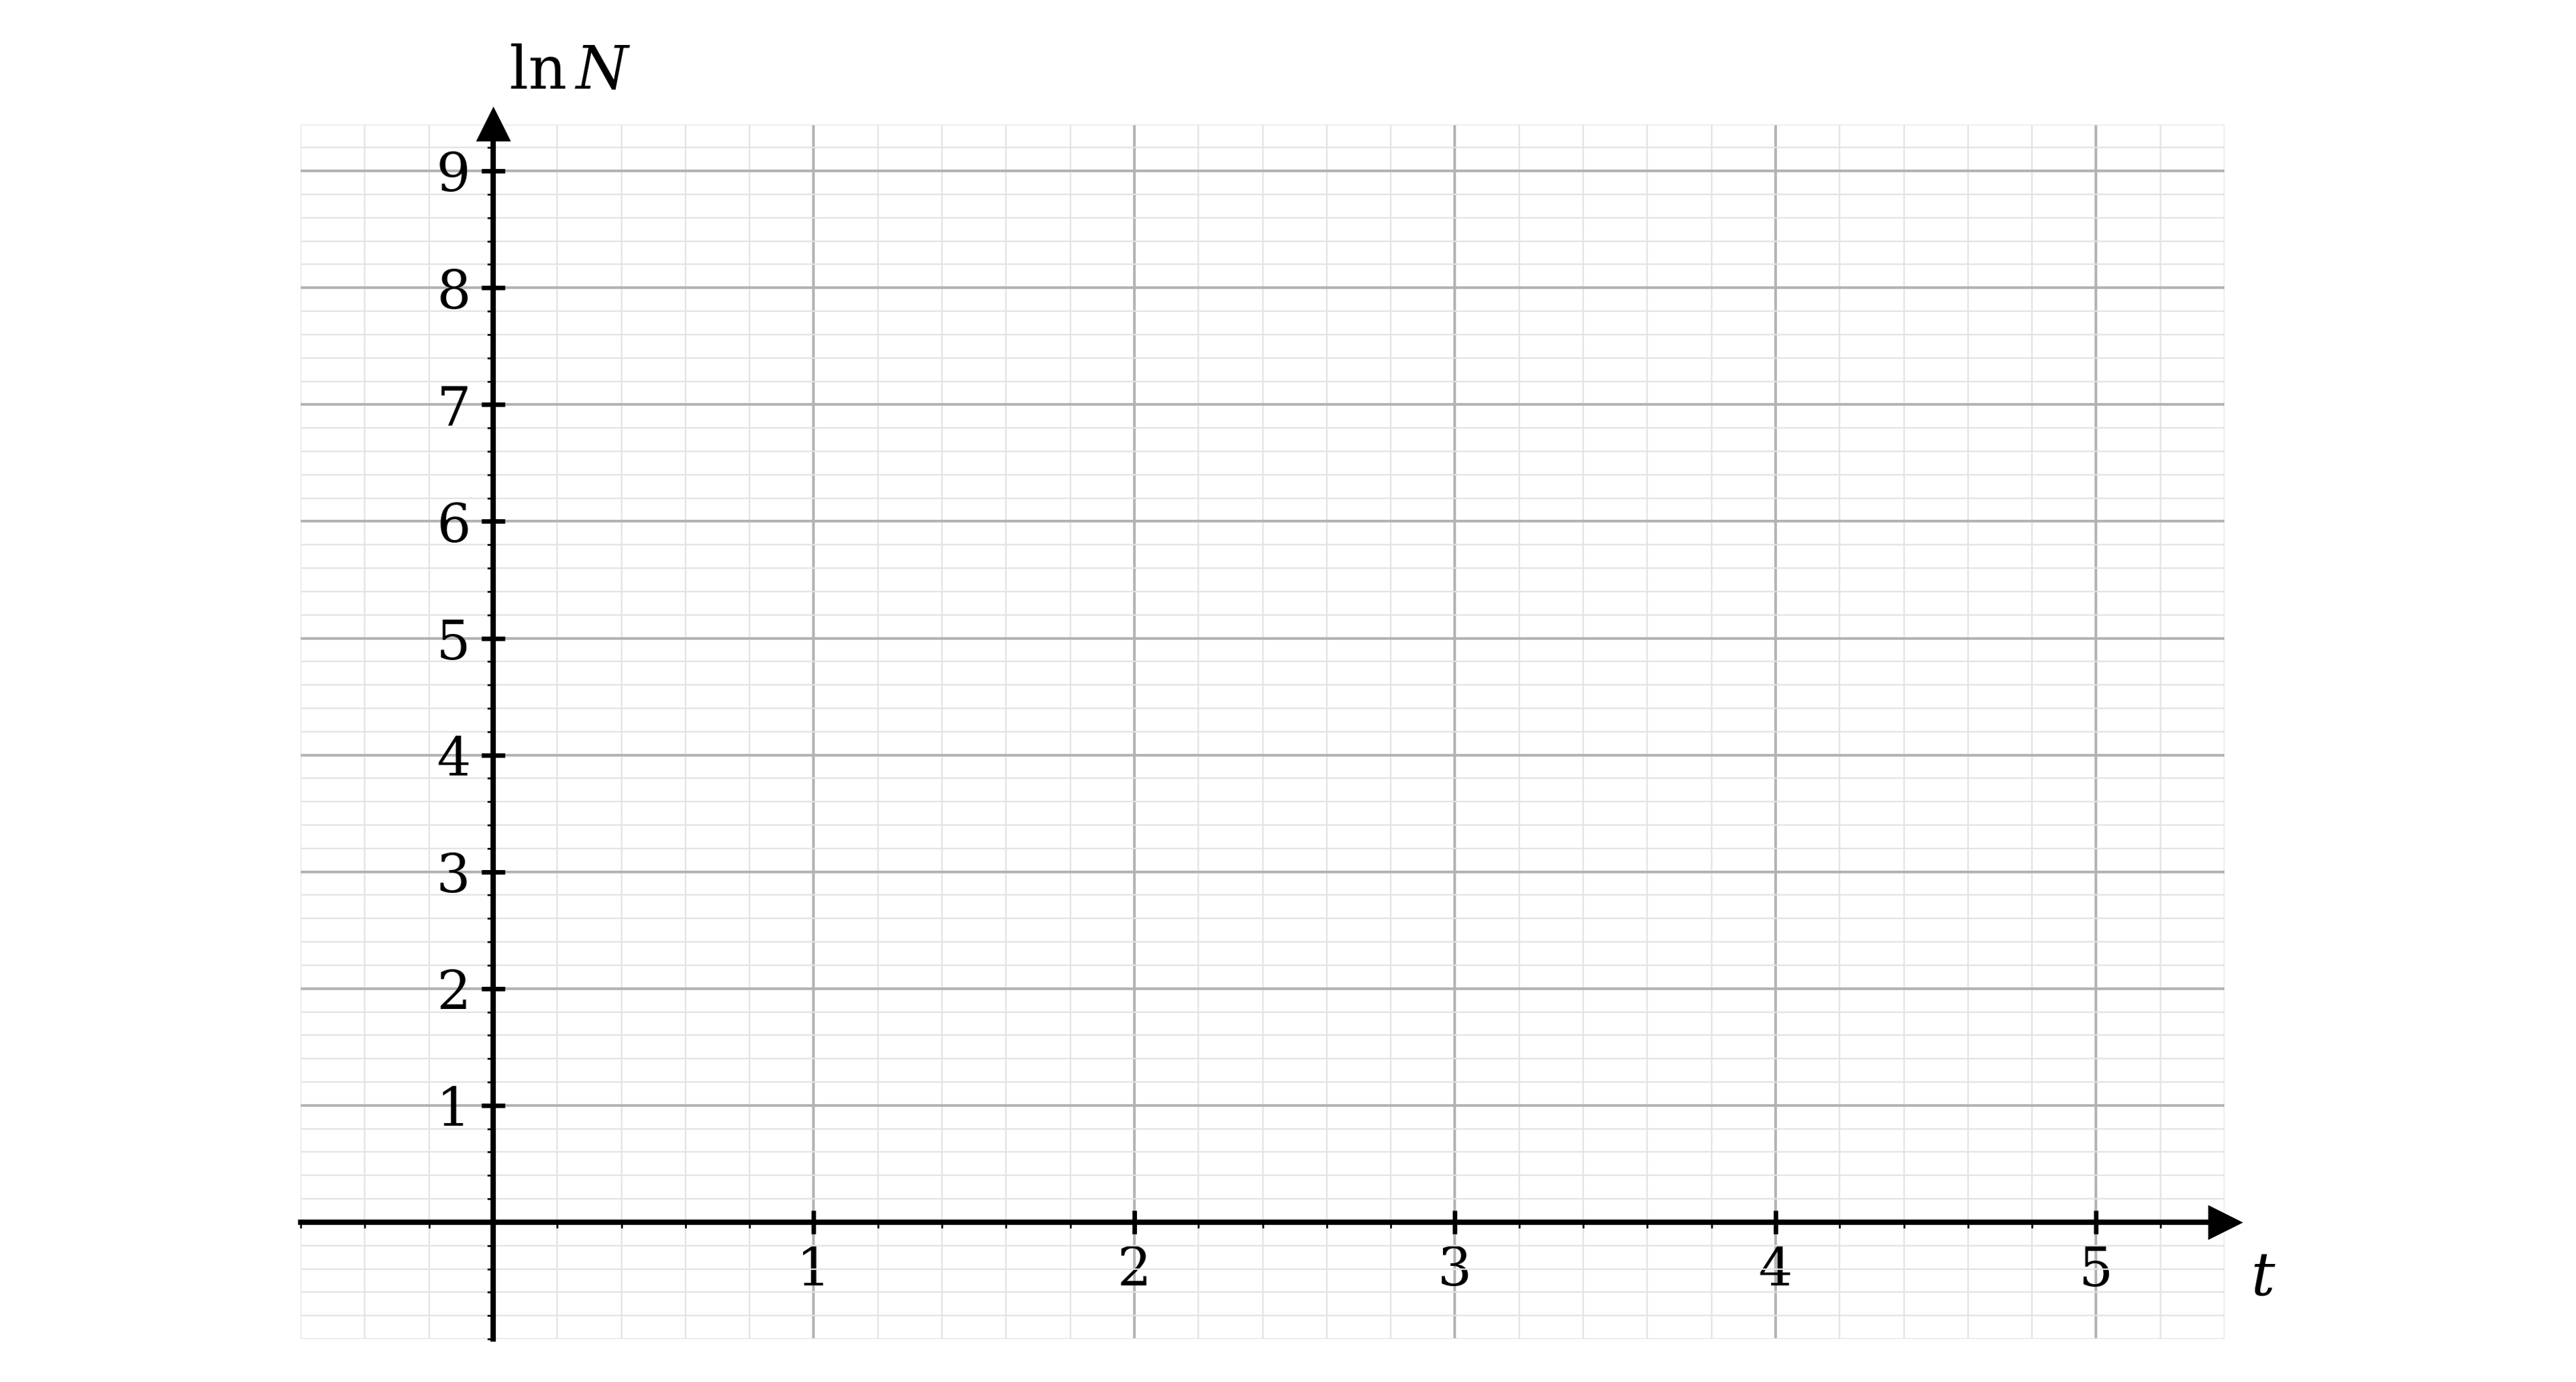
Plot the observations on the graph below, plotting against .
Using the points and , find an equation for a line of best fit in the form , where and are constants to be found.
Hence estimate the values of and .
Was this exam question helpful?
In an effort to prevent extinction, scientists released some rare birds into a newly constructed nature reserve.
The population of birds within the reserve is modelled by
where is the number of birds years after being released into the reserve.
State the number of birds the scientists released into the nature reserve.
According to this model, find the number of birds in the reserve after 3 years.
Find the time taken for the population of birds within the reserve to reach 500.
Was this exam question helpful?
Write in the form .
Write in the form .
State whether this would represent exponential growth or exponential decay.
Was this exam question helpful?
Write in the form .
Sketch the graph of .
State the coordinates of the -axis intercept.
Write down the equation of the asymptote.
Was this exam question helpful?
By taking logarithms (base ) of both sides show that the equation
can be written as
Given and , find the values of and .
Was this exam question helpful?
By taking logarithms (base 10) of both sides show that the equation
can be written as
Given and , find the values of and .
Was this exam question helpful?
By taking logarithms (base 2) of both sides show that the equation
can be written as
Given and , find the values of , and .
Was this exam question helpful?
A simple model for the acceleration of a rocket, , is given as
where is the time in seconds after lift-off and is a constant.
State what the constant represents.
After 10 seconds, the acceleration is . Find the value of .
Find the time taken for the acceleration of the rocket to reach .
Was this exam question helpful?
Carbon-14 is a radioactive isotope of the element carbon. Carbon-14 decays exponentially, losing mass as it decays, and is used in carbon dating to estimate the age of objects.
The time it takes the mass of carbon-14 to halve, called its half-life, is approximately 5700 years.
A model for the mass of carbon-14, g, in an object of age years is
where and are constants.
For an object initially containing 100 g of carbon-14, state the value of .
Explain briefly why, if , then will equal 50 g when years.
Using the values from part (b), show that the value of is , correct to three significant figures.
A different object currently contains 60 g of carbon-14. Find the mass of carbon-14 that will remain in the object in 2000 years' time.
Was this exam question helpful?
An exponential growth model for the number of bacteria in an experiment is of the form
is the number of bacteria and is the time in hours since the experiment began. , and are constants.
A scientist records the number of bacteria at various points over a six-hour period. The results are shown in the table below.
, hours | 0 | 2 | 4 | 6 |
|---|---|---|---|---|
, no. of bacteria | 100 | 180 | 340 | 620 |
(3 s.f.) | 4.19 | 4.73 | 5.31 | 5.85 |
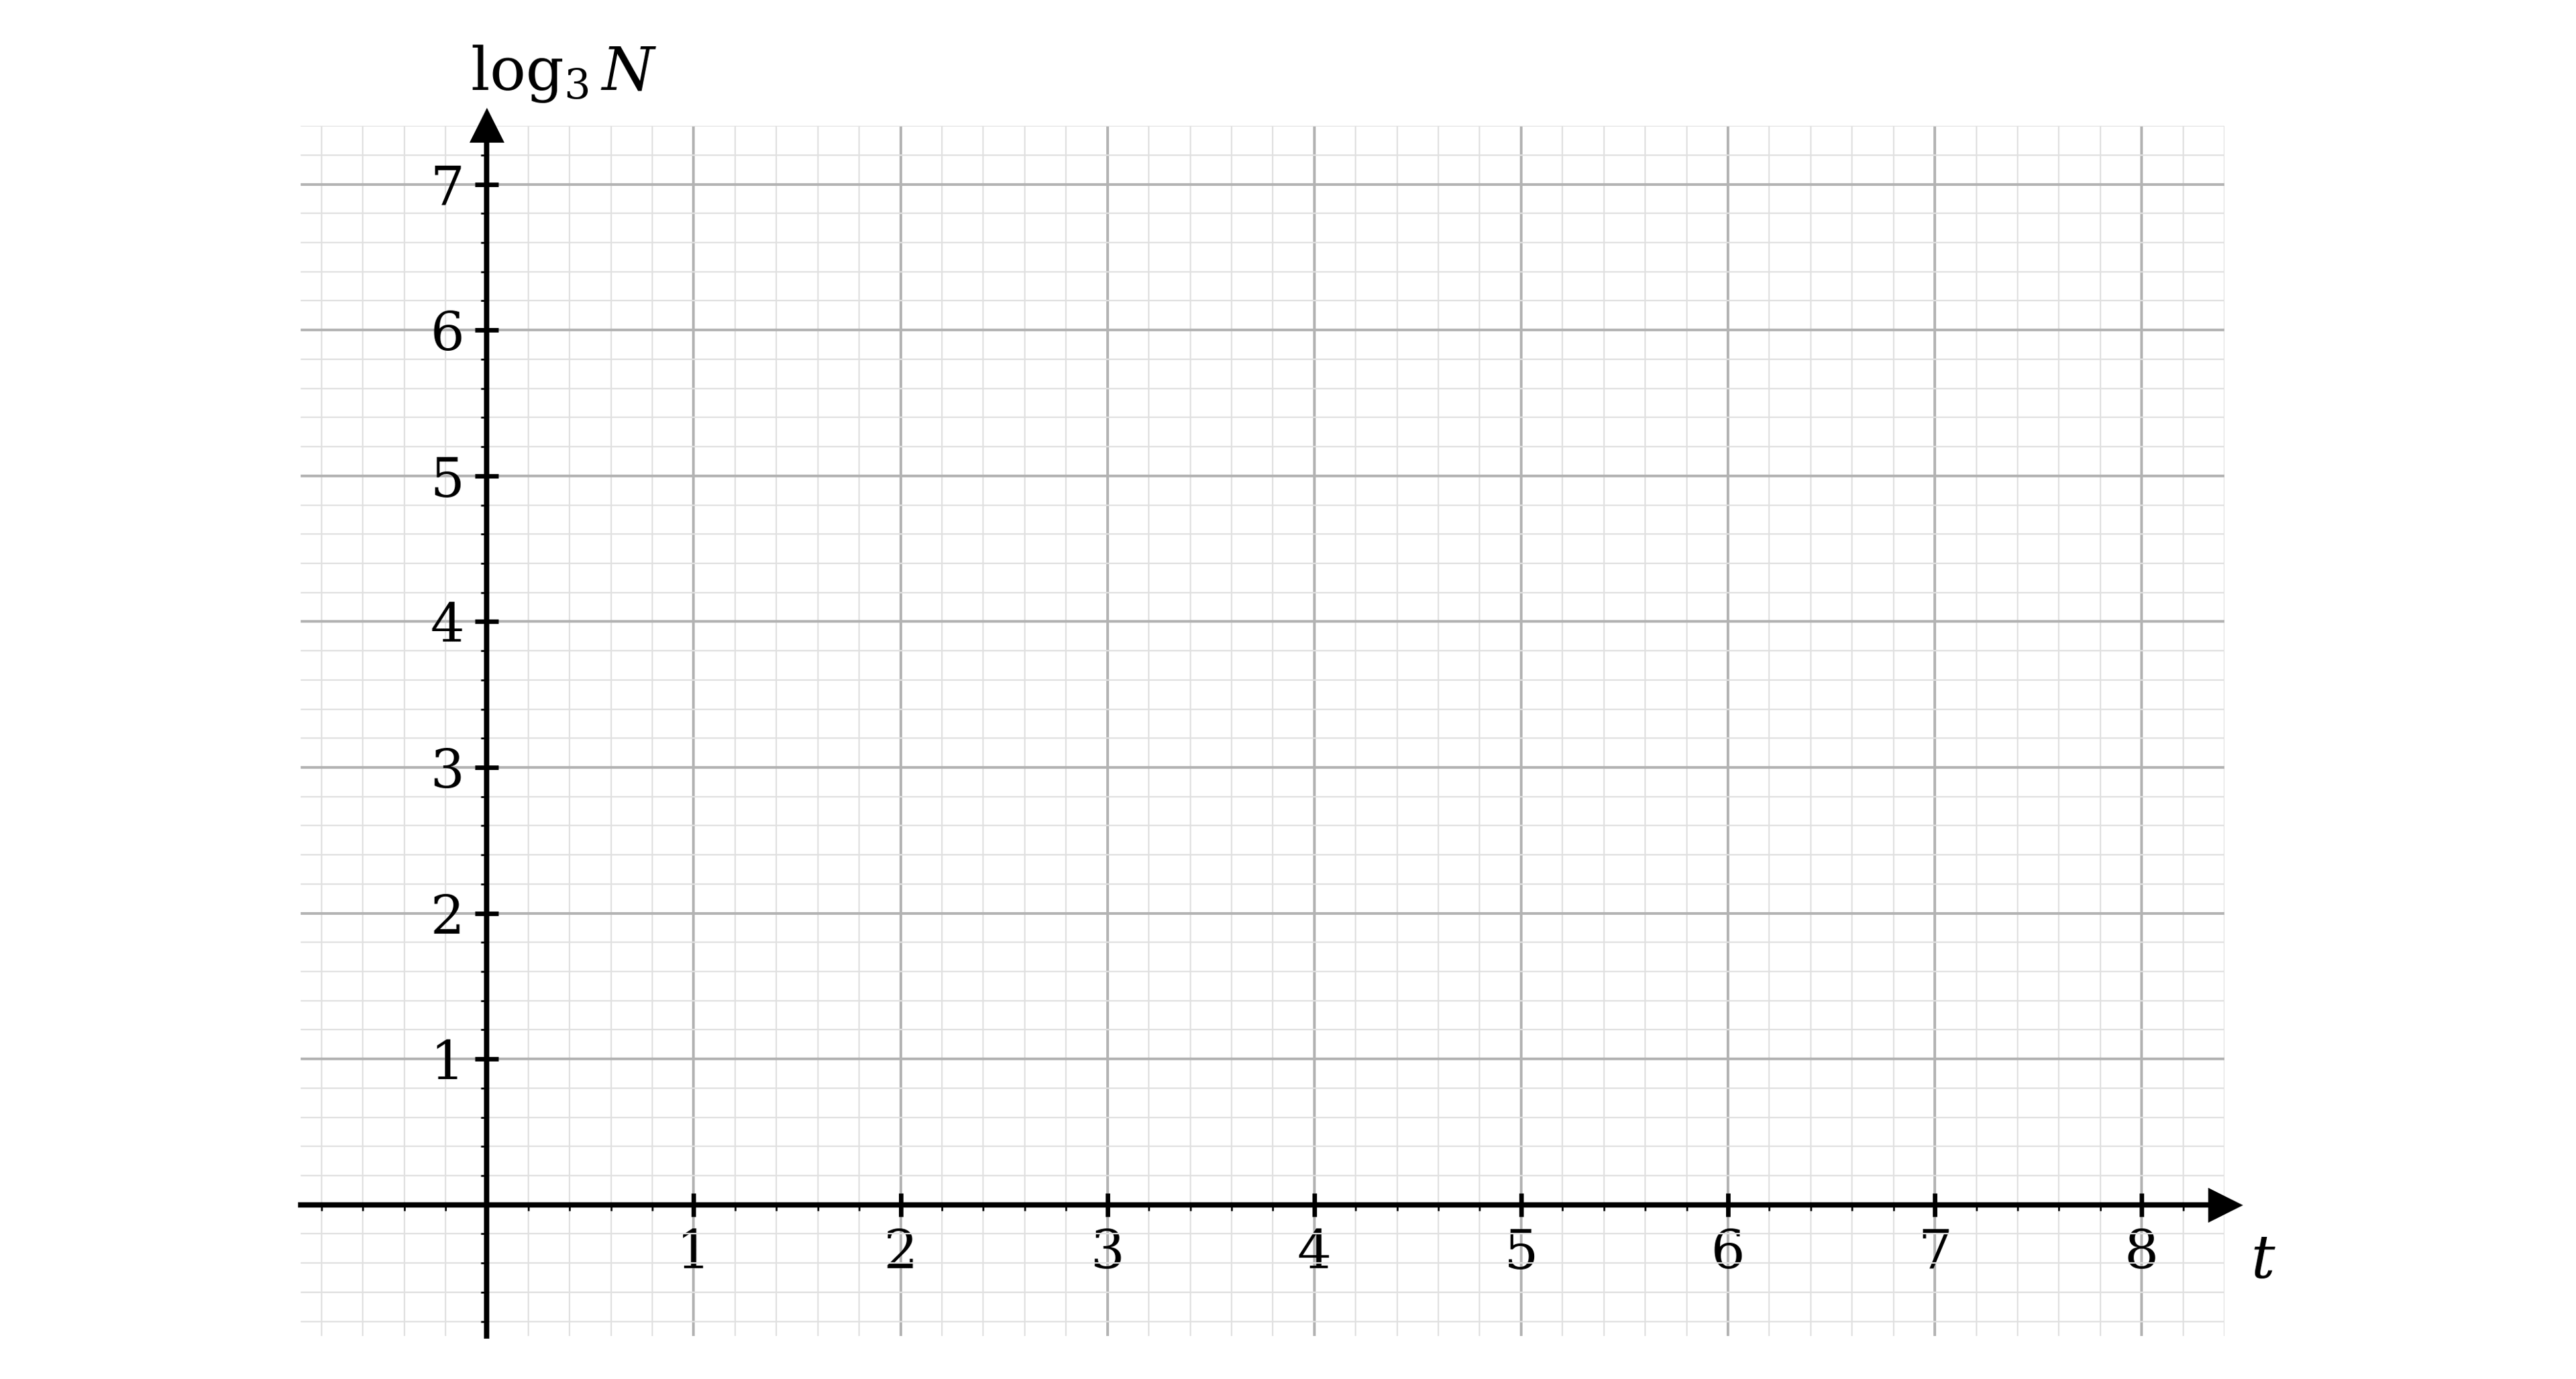
Plot the observations on the graph below, plotting against .
Using the points and , find an equation for a line of best fit in the form , where and are constants to be found.
The equation can be written in the form .
Use your answer to part (b) to estimate the values of , and .
Was this exam question helpful?
An exponential model of the form is used to model the amount of a pain-relieving drug, mg/ml, in a patient's bloodstream hours after the drug was administered by injection. and are constants.
The graph below shows values of plotted against , with a line of best fit drawn passing through the points and .
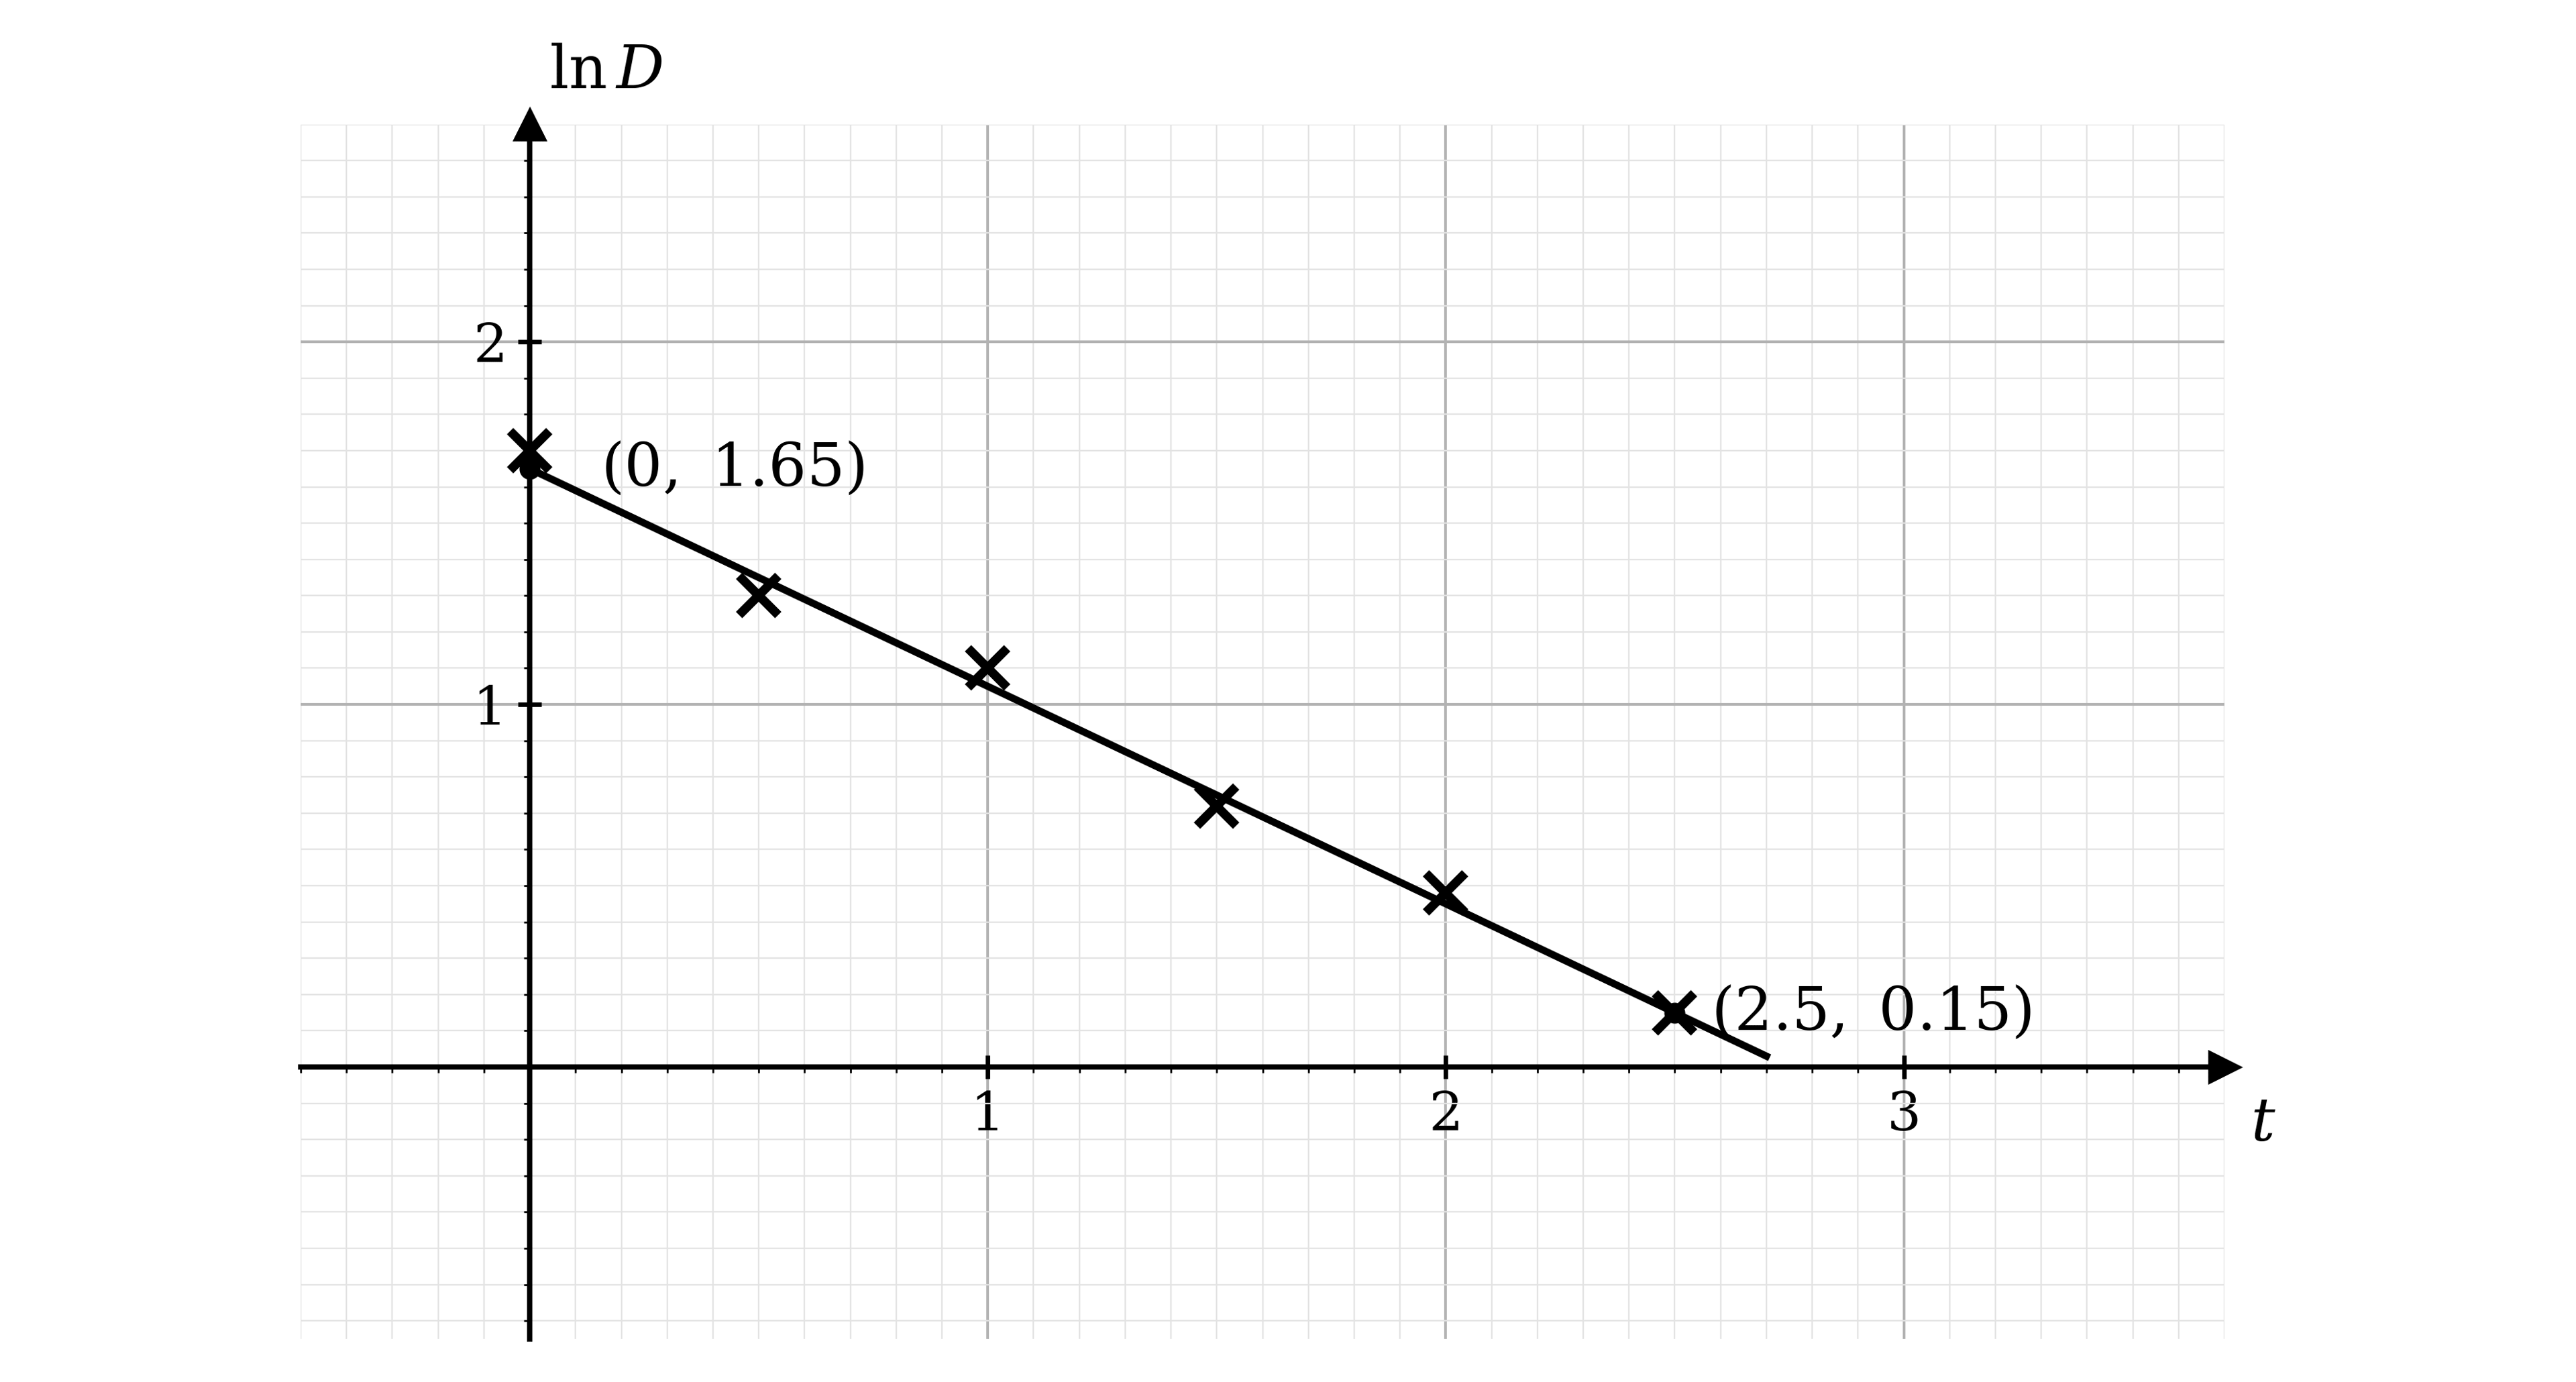
(i) Use the graph and line of best fit to estimate at time .
(ii) Work out the gradient of the line of best fit.
Use your answers to part (a) to write down an equation for the line of best fit in the form , where and are constants.
Show that can be rearranged to give .
Hence find estimates for the constants and .
Find the time when the amount of the pain-relieving drug in the patient's bloodstream is 1.5 mg/ml.
Was this exam question helpful?
A small company makes a profit of $2500 in its first year of business and $3700 in the second year. The company decides they will use the model
to predict future years' profits, where the profit, in dollars, in the year of business is , and and are constants.
Write down two equations connecting and .
Find the values of and .
Find the predicted profit for years 3 and 4.
Show that
can be written in the form
Was this exam question helpful?
Write in the form , giving the value of correct to three significant figures.
Write in the form , giving the value of correct to three significant figures.
State, and justify, whether this would represent exponential growth or decay.
Was this exam question helpful?
Show that the equation
can be written as
Rewrite the equation in the form .
Was this exam question helpful?
Show that the equation
can be written as
Rewrite the equation in the form .
Was this exam question helpful?
The annual profits, in dollars, of a small company in the first 4 years of business are given in the table below.
, years in business | 1 | 2 | 3 | 4 |
|---|---|---|---|---|
, annual profit | 3100 | 4384 | 5369 | 6200 |
Using this data the company uses the model
to predict future years' profits, where and are constants.
Use data from the table to find the values of and .
Show that , where and take the values found in part (a).
State a potential problem with using the model to predict the profit in the company's 12th year of business.
Was this exam question helpful?
Write in the form .
Sketch the graph of .
State the coordinates of the -axis intercept.
Write down the equation of the asymptote.
Was this exam question helpful?
Show that the equation
can be written as
Rewrite the equation in the form .
Was this exam question helpful?
Scientists introduced a small number of rare breed deer to a large wildlife sanctuary.
The population of deer within the sanctuary is modelled by
where is the number of deer years after first being introduced to the sanctuary.
State the number of deer the scientists introduced to the sanctuary.
Find the time taken for the deer population to double.
Give one criticism of the model for population growth.
The scientists suggest that the population of deer should be separated after either 25 years or when their population exceeds 400, whichever comes first.
Find the earliest time at which the deer should be separated.
Was this exam question helpful?
A simple model for the acceleration of a rocket, , is given as
where is the time in seconds after lift-off and is a constant.
After 4 seconds the acceleration of the rocket is . Find the value of .
Find the time at which the acceleration of the rocket has increased by 200% of its initial value.
Sketch the graph of the acceleration of the rocket against time, stating the coordinates of the point that shows the initial acceleration of the rocket.
Was this exam question helpful?
Carbon-14 is a radioactive isotope of the element carbon. Carbon-14 decays exponentially, losing mass as it decays, and is used in carbon dating to estimate the age of objects.
The time it takes the mass of carbon-14 to halve, called its half-life, is approximately 5700 years.
A model for the mass of carbon-14, g, in an object originally containing 100 g, at time years is
where is a constant.
Find the value of , giving your answer correct to three significant figures.
The object is considered as having no radioactivity once the mass of carbon-14 it contains falls below 0.5 g. Find the age the object would have to be in order to be considered non-radioactive.
A different object currently contains 25 g of carbon-14. Find the mass of carbon-14 that will remain in the object in 500 years' time.
Was this exam question helpful?
An exponential growth model for the number of bacteria in an experiment is of the form
is the number of bacteria and is the time in hours since the experiment began. , and are constants.
A scientist records the number of bacteria at various points over a six-hour period. The results are in the table below.
, hours | 0 | 2 | 4 | 6 |
|---|---|---|---|---|
, no. of bacteria | 200 | 350 | 600 | 1100 |
Use your calculator to evaluate for each value of in the table, giving your values correct to three significant figures.
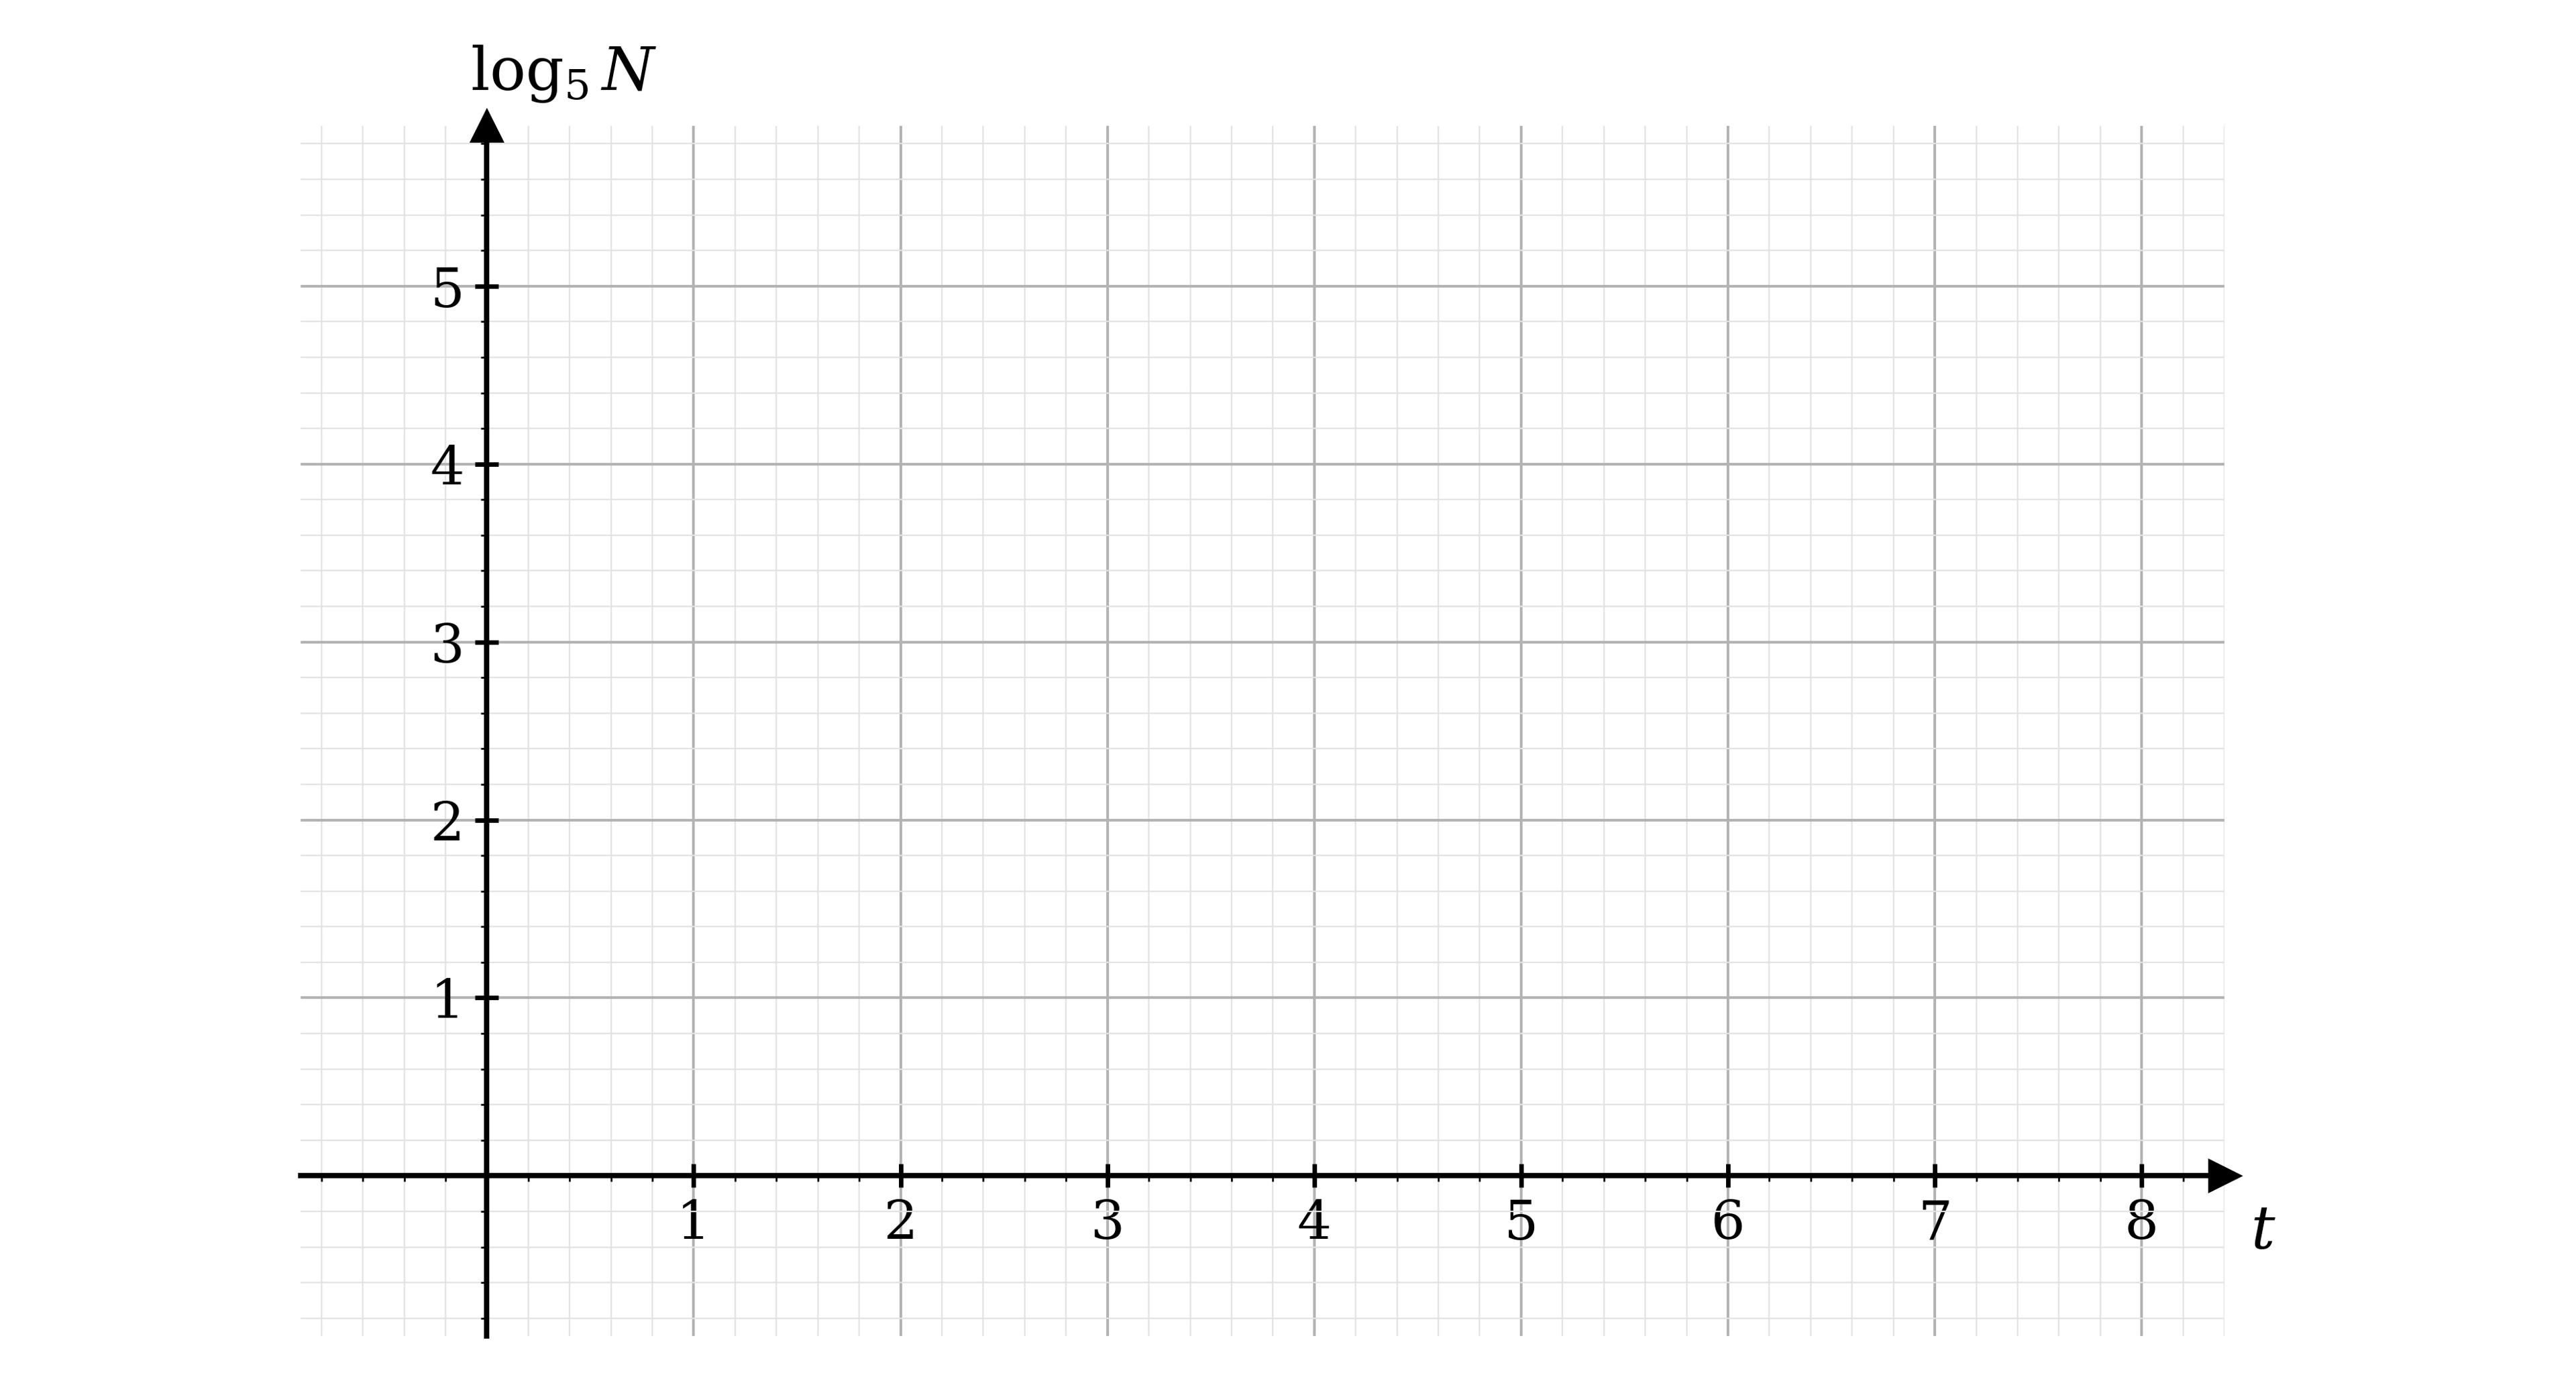
Plot the observations on the graph below, plotting against . Draw a line of best fit.
Find an equation for your line of best fit in the form .
Estimate the values of , and .
Was this exam question helpful?
An exponential model of the form
is used to model the amount of a pain-relieving drug, mg/ml, in a patient's bloodstream hours after the drug was administered by injection. and are constants.
The graph below shows values of plotted against .

Using the points marked and , find an equation for the line of best fit, giving your answer in the form , where and are constants to be found.
Hence find estimates for the constants and .
The patient is allowed a second injection of the drug once the amount of drug in the bloodstream falls below 1% of the initial dose.
Find, correct to the nearest minute, how long it is until the patient is allowed a second injection of the drug.
Was this exam question helpful?
Write in the form , giving the value of correct to three significant figures.
(i) Write in the form , giving the values of and correct to three significant figures where necessary.
(ii) State, and justify, whether this would represent exponential growth or decay.
(iii) Write down the initial value of .
Was this exam question helpful?
Rewrite the equation in the form .
Sketch the graph of by plotting against .
Was this exam question helpful?
Rewrite the equation in the form .
Sketch the graph of against .
Was this exam question helpful?
Scientists introduced a small number of apes into a previously unpopulated forest.
The population of apes in the forest is modelled by
where is the number of apes months after first being introduced to the forest.
State, with a reason, whether you would expect the value of to be positive or negative.
After 8 months, the number of apes in the forest has increased by 50%. Find the value of .
Scientists believe the forest cannot sustain a population of apes greater than 3000. Find the length of time for which the model for the population of the apes is reliable.
Was this exam question helpful?
An exponential growth model for the number of bacteria in an experiment is of the form
is the number of bacteria and is the time in hours since the experiment began. , and are constants.
A scientist records the number of bacteria at various points over a six-hour period. The results are in the table below.
, hours | 0 | 1.5 | 3 | 4.5 | 6 |
|---|---|---|---|---|---|
, no. of bacteria | 120 | 190 | 360 | 680 | 1230 |
Use your calculator to evaluate for each value of in the table, giving your values correct to three significant figures.
By plotting against , drawing a line of best fit and finding its equation, estimate the values of , and .
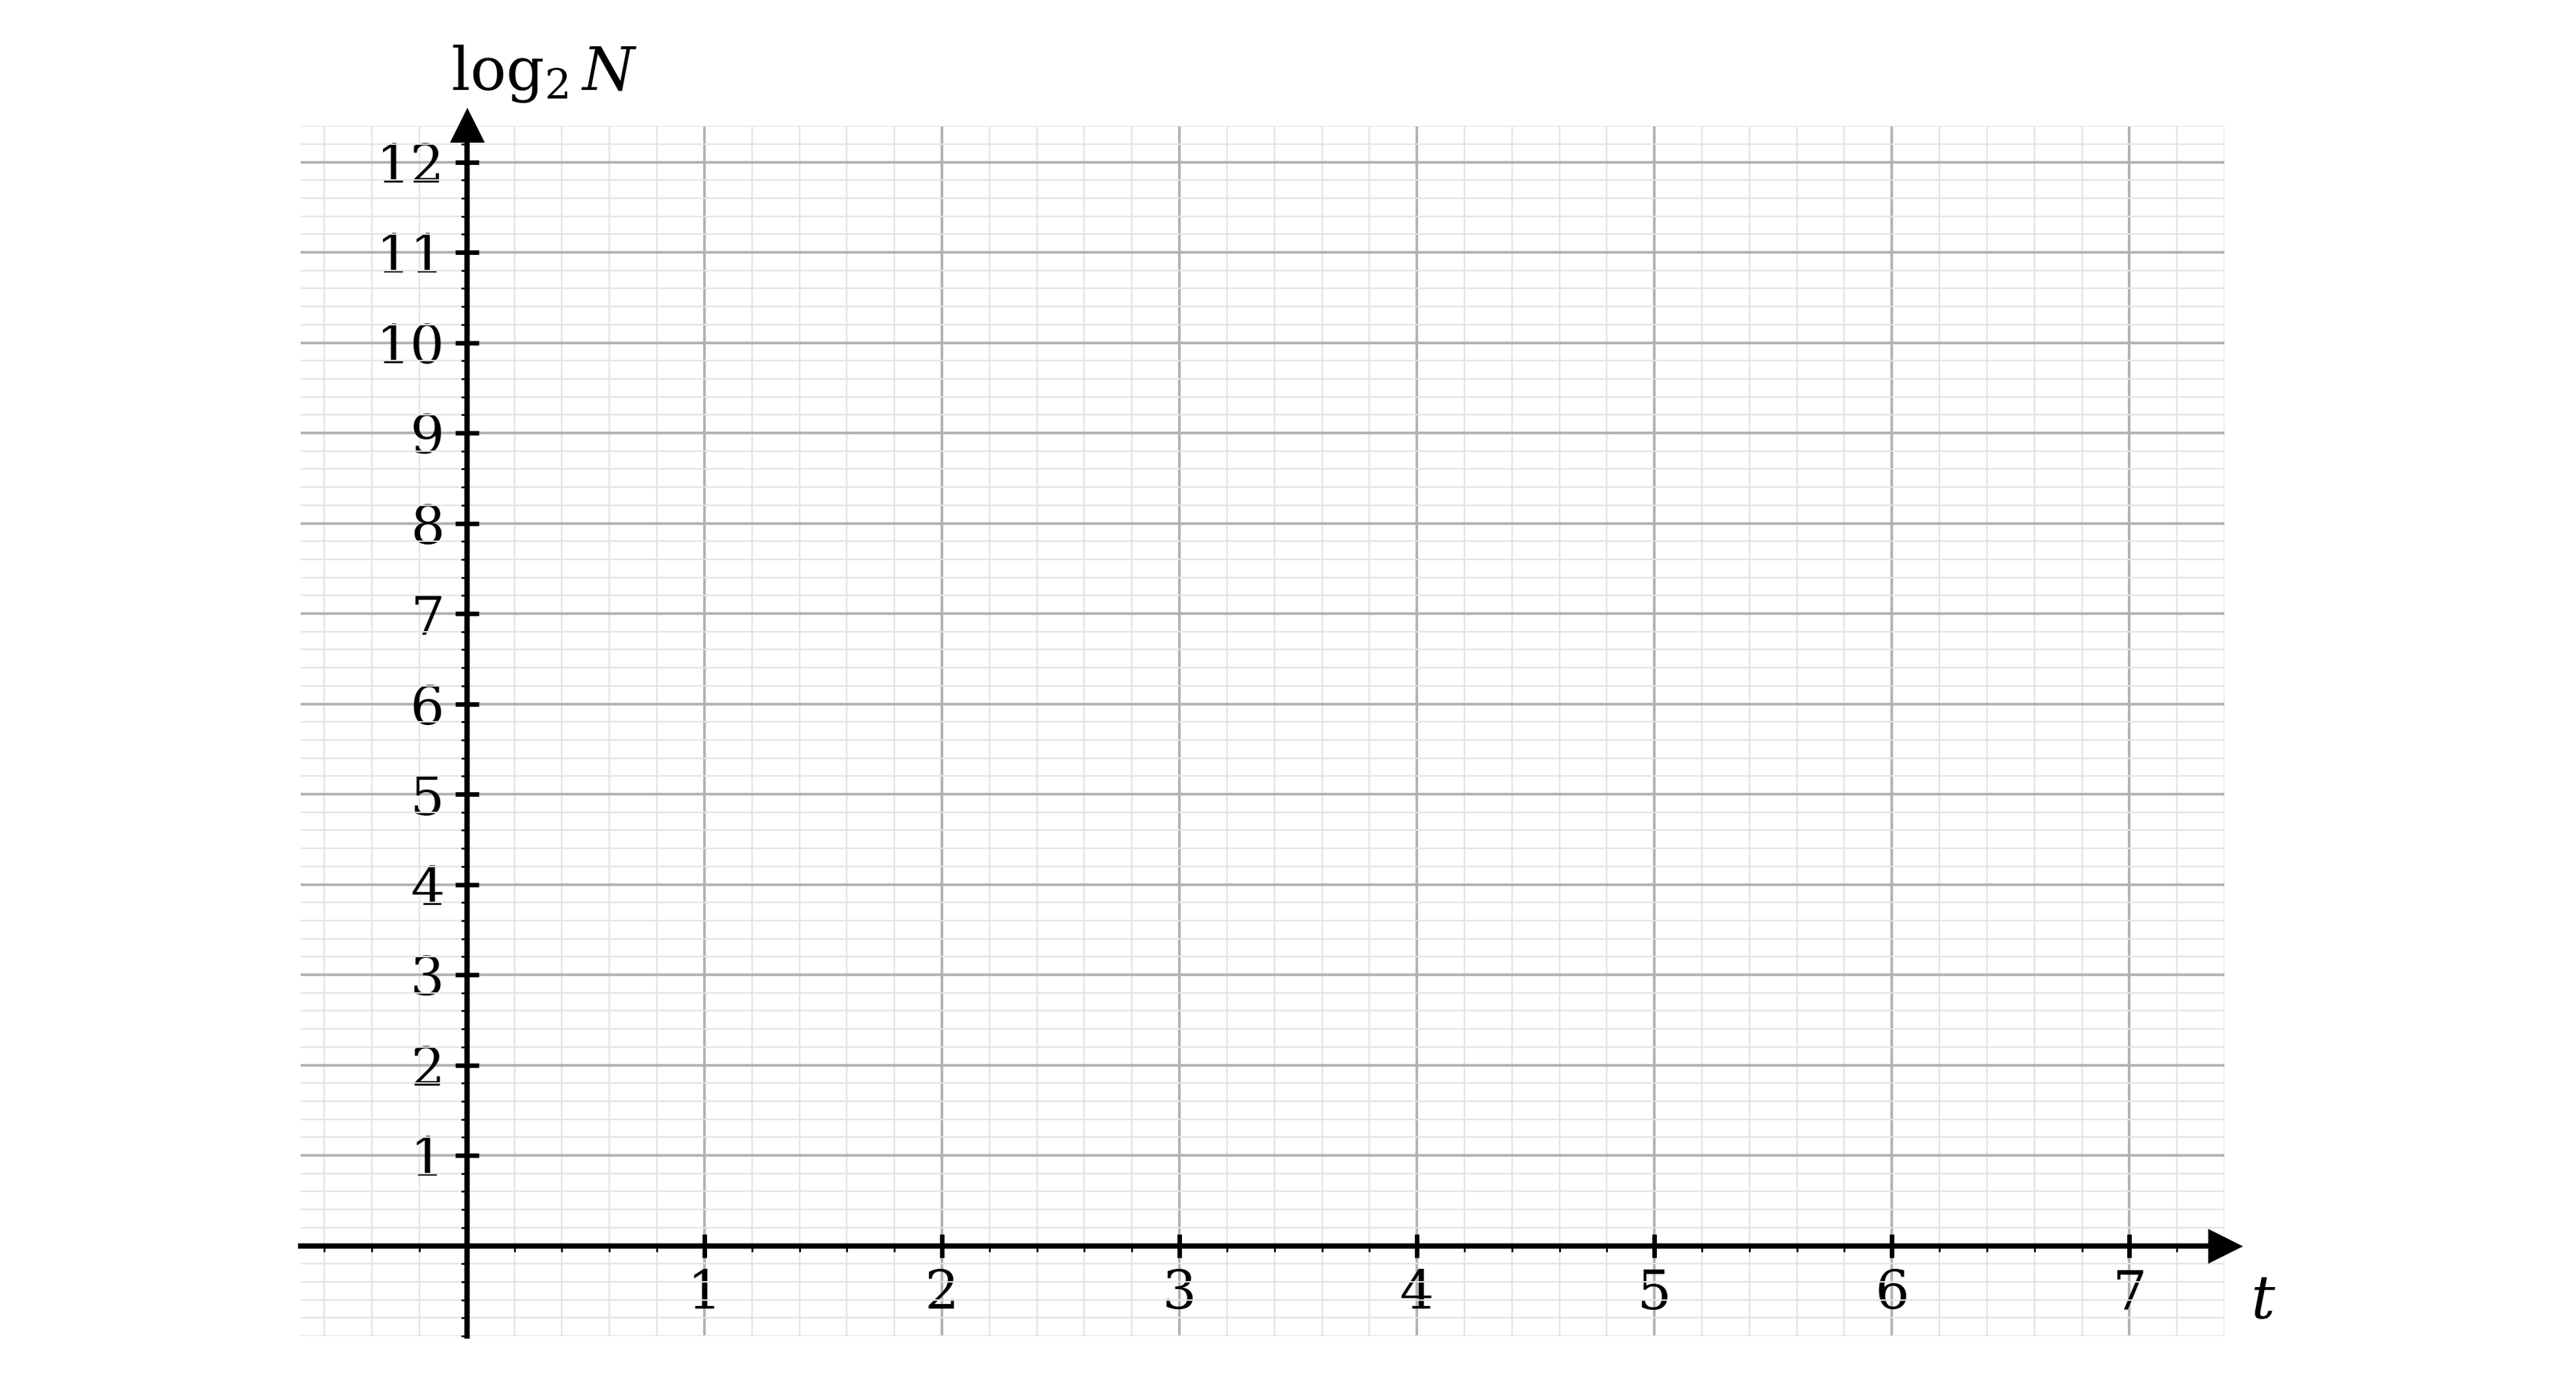
Find what the model predicts for the value of after twelve hours, and comment on the reliability of this prediction.
Was this exam question helpful?
Sketch the graph of .
State the coordinates of any points where the graph intercepts the coordinate axes.
Write down the equations of any asymptotes.
Was this exam question helpful?
Rewrite the equation in the form , where is an integer and and are rational numbers.
Sketch the graph of against .
Was this exam question helpful?
A manufacturer claims their flask will keep a hot drink warm for up to 7 hours. In this sense, warm is considered to be or higher.
Assuming a hot drink is made at and its temperature inside the flask is after exactly 7 hours, find
(i) a linear model for the temperature of the drink inside the flask of the form , and
(ii) an exponential model for the temperature of the drink inside the flask of the form
where is the temperature of the drink in the flask after hours and , , and are constants.
Compare the rate of change of the temperature of the drink inside the flask for both models after 3 hours.
A user of the flask suggests that hot drinks are only kept warm for 5 hours. Suggest a reason why the user's experience may not match the claims of the manufacturer.
Was this exam question helpful?
A simple model for the acceleration of a rocket, , is given as
where is the time in seconds after lift-off, and and are constants.
Negative time is often used in rocket launches as a way of counting down until lift-off. Despite this, the model above is still not suitable for use with negative values of . Explain briefly why.
After 5 seconds the acceleration of the rocket is and after 20 seconds its acceleration is . Find the values of and .
A space enthusiast suggests that a linear model, of the form , would be more suitable. Using the figures in part (b), explain why the enthusiast's model is unrealistic.
Was this exam question helpful?
Carbon-14 is a radioactive isotope of the element carbon. Carbon-14 decays exponentially, losing mass as it decays, and is used in carbon dating to estimate the age of objects.
The time it takes carbon-14 to halve, called its half-life, is approximately 5700 years.
A model for the mass of carbon-14, g, in an object at time years is
where and are constants.
Explain briefly the meaning of the constant .
Find the value of , giving your answer in the form , where and are integers to be found.
An object currently contains 200 g of carbon-14. Find the mass of carbon-14, correct to the nearest gram, that remains in the object in 20 000 years' time.
The half-life of carbon-14 is believed to be accurate only to years.
A fossilised bone currently contains g of carbon-14. It is estimated the bone would have originally contained g of carbon-14.
Find upper and lower estimates for the age of the bone, giving your answers correct to two significant figures.
Was this exam question helpful?
An exponential model of the form
is used to model the concentration of a pain-relieving drug, mg/ml, in a patient's bloodstream hours after the drug was administered by injection. and are constants.
The graph below shows values of plotted against , with a line of best fit drawn passing through the points and .
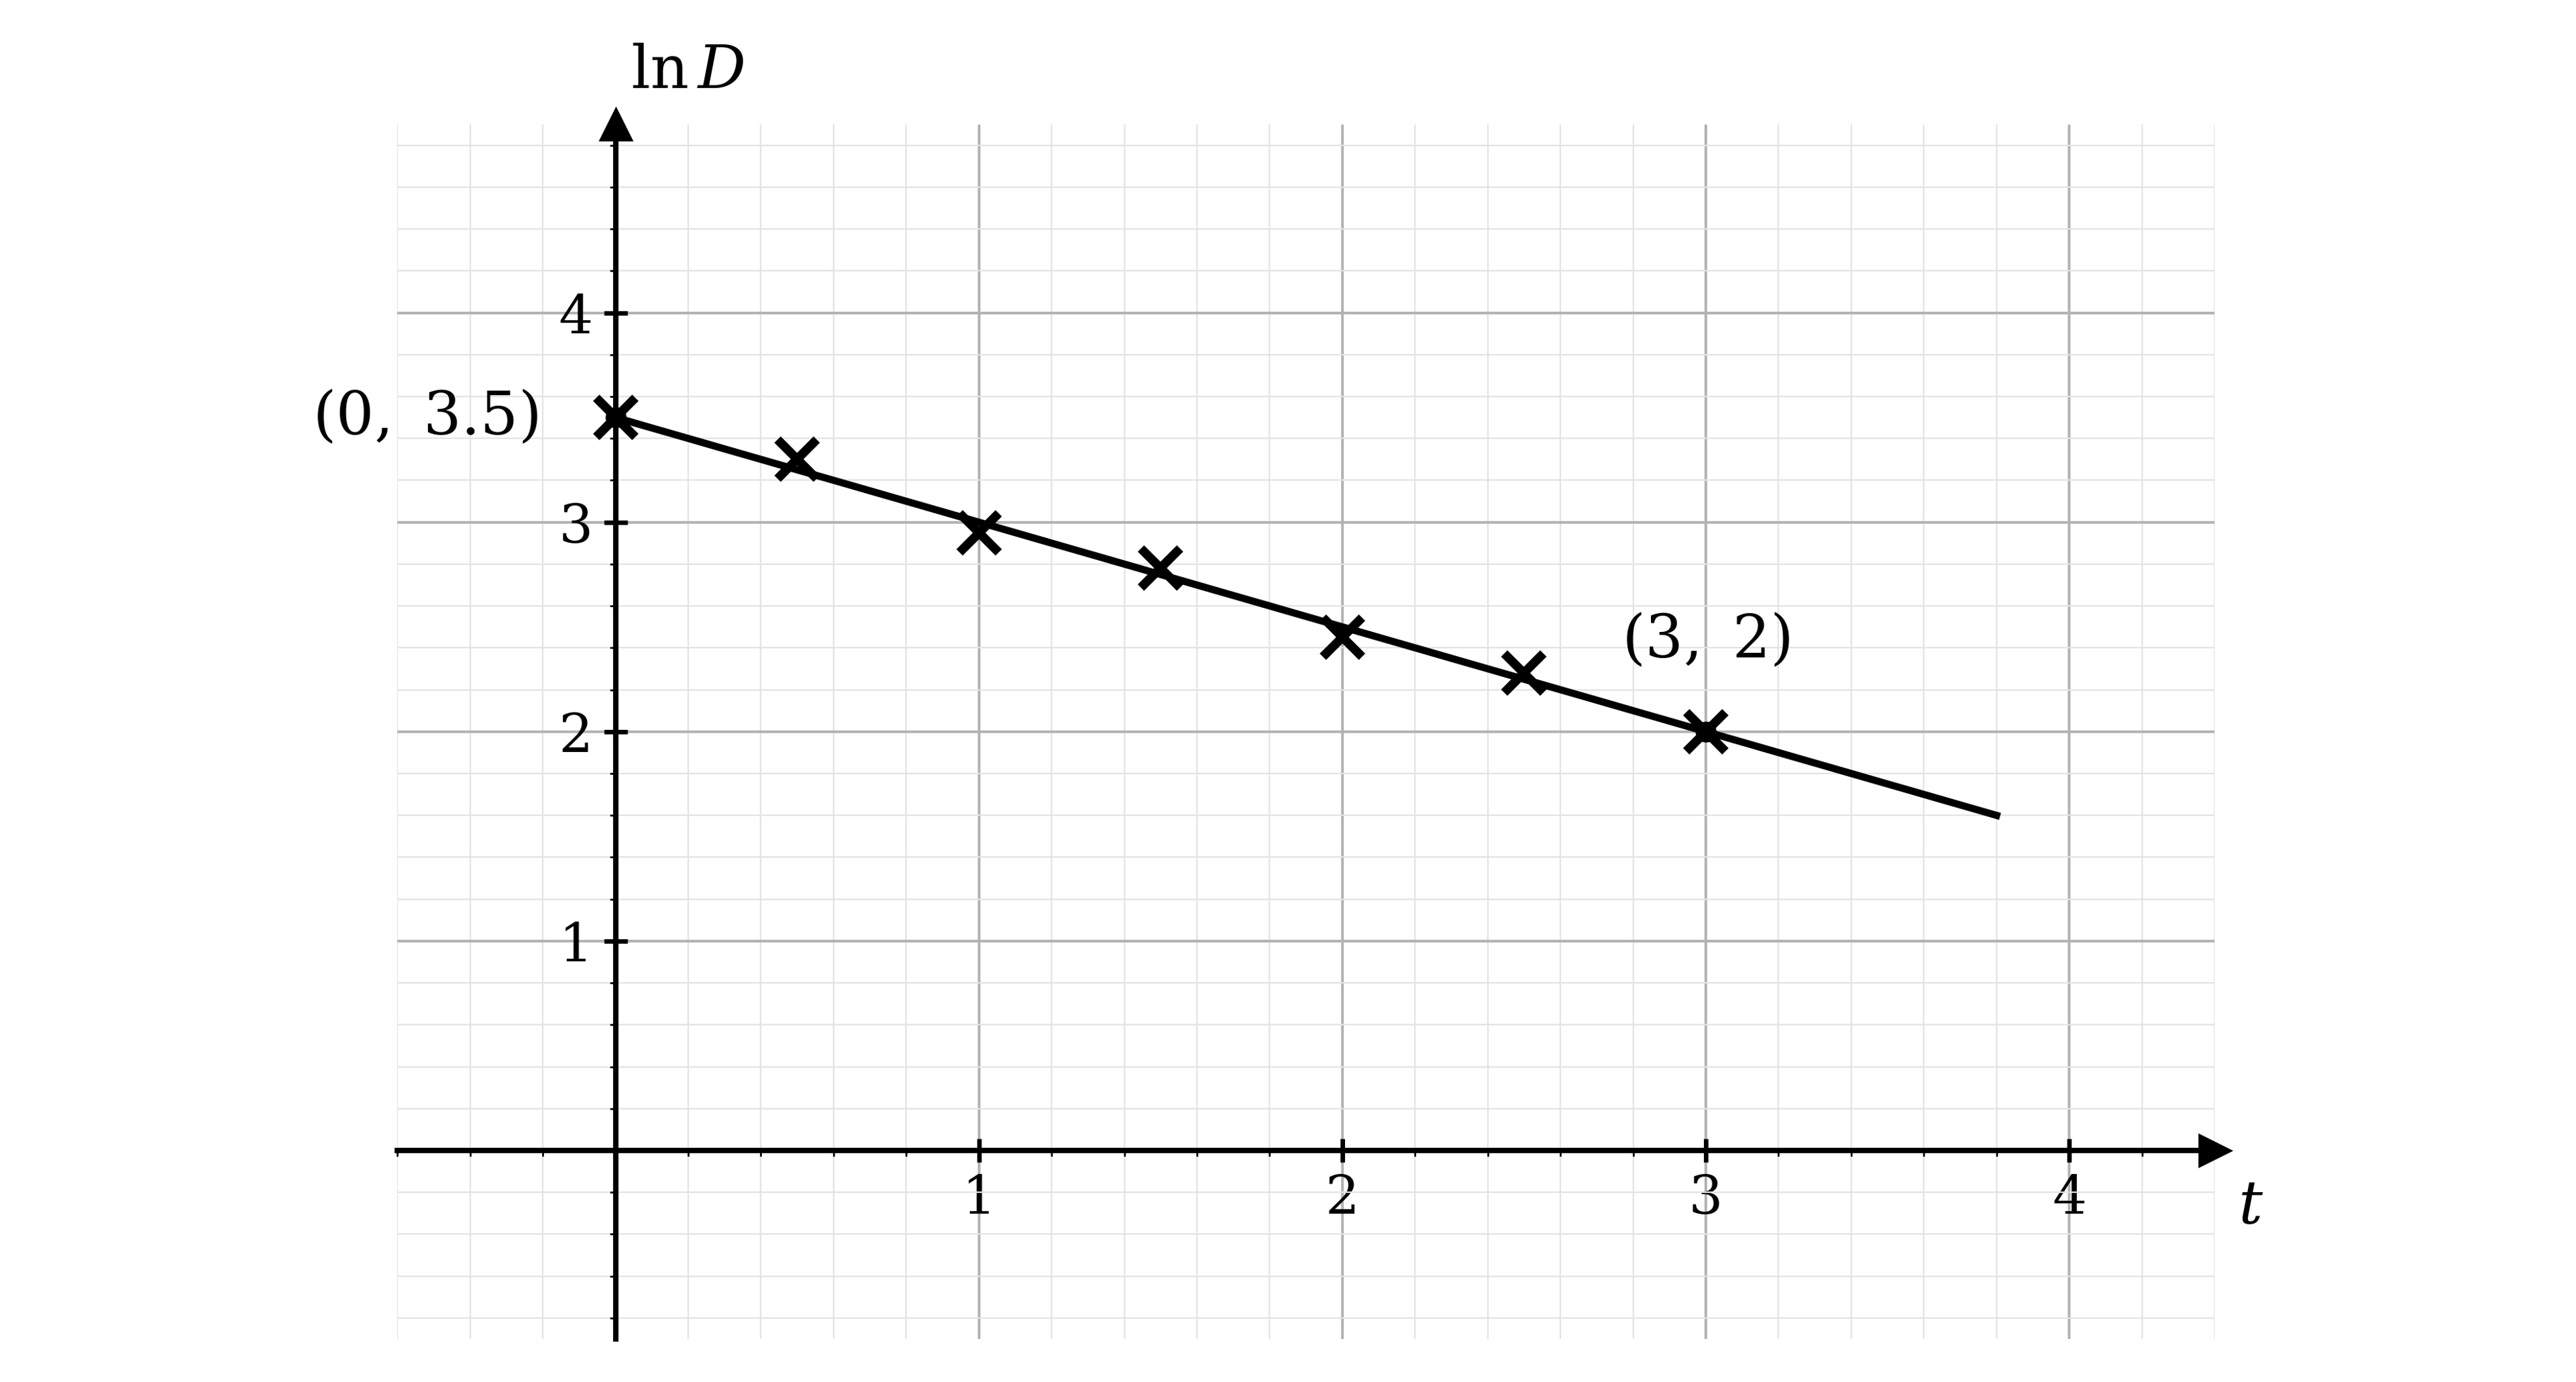
Find estimates for the constants and .
Find the time, correct to the nearest minute, at which the rate of decrease of the concentration of the drug in the patient's bloodstream is 12 mg/ml per hour.
Was this exam question helpful?
The annual profits, in dollars, of a small company in the first 4 years of business are given in the table below.
, years in business | 1 | 2 | 3 | 4 |
|---|---|---|---|---|
, where is the annual profit | 3.74 | 3.86 | 3.94 | 4.01 |
Using this data the company uses the model
to predict future years' profits, where and are constants.
Use the results in the table to estimate the values of and .
Was this exam question helpful?