The Oxygen Dissociation Curve (Cambridge (CIE) AS Biology): Revision Note
Exam code: 9700

The oxygen dissociation curve
The oxygen dissociation curve shows the rate at which oxygen associates and dissociates with haemoglobin at different partial pressures of oxygen (pO2)
Partial pressure of oxygen refers to the pressure exerted by oxygen within a mixture of gases
It is a measure of oxygen concentration
Haemoglobin is referred to as being saturated when all of its oxygen binding sites are taken up with oxygen
This is when it contains four oxygen molecules
The ease with which haemoglobin binds and dissociates with oxygen can be described as its affinity for oxygen
When haemoglobin has a high affinity it binds easily and dissociates slowly
When haemoglobin has a low affinity for oxygen it binds slowly and dissociates easily
In other liquids, such as water, we would expect oxygen to become associated with water, or to dissolve, at a constant rate, providing a straight line on a graph
However, with haemoglobin, oxygen binds at different rates as the pO2 changes
This results in a curve when plotted
It can be said that haemoglobin's affinity for oxygen changes at different partial pressures of oxygen
Interpreting the curve
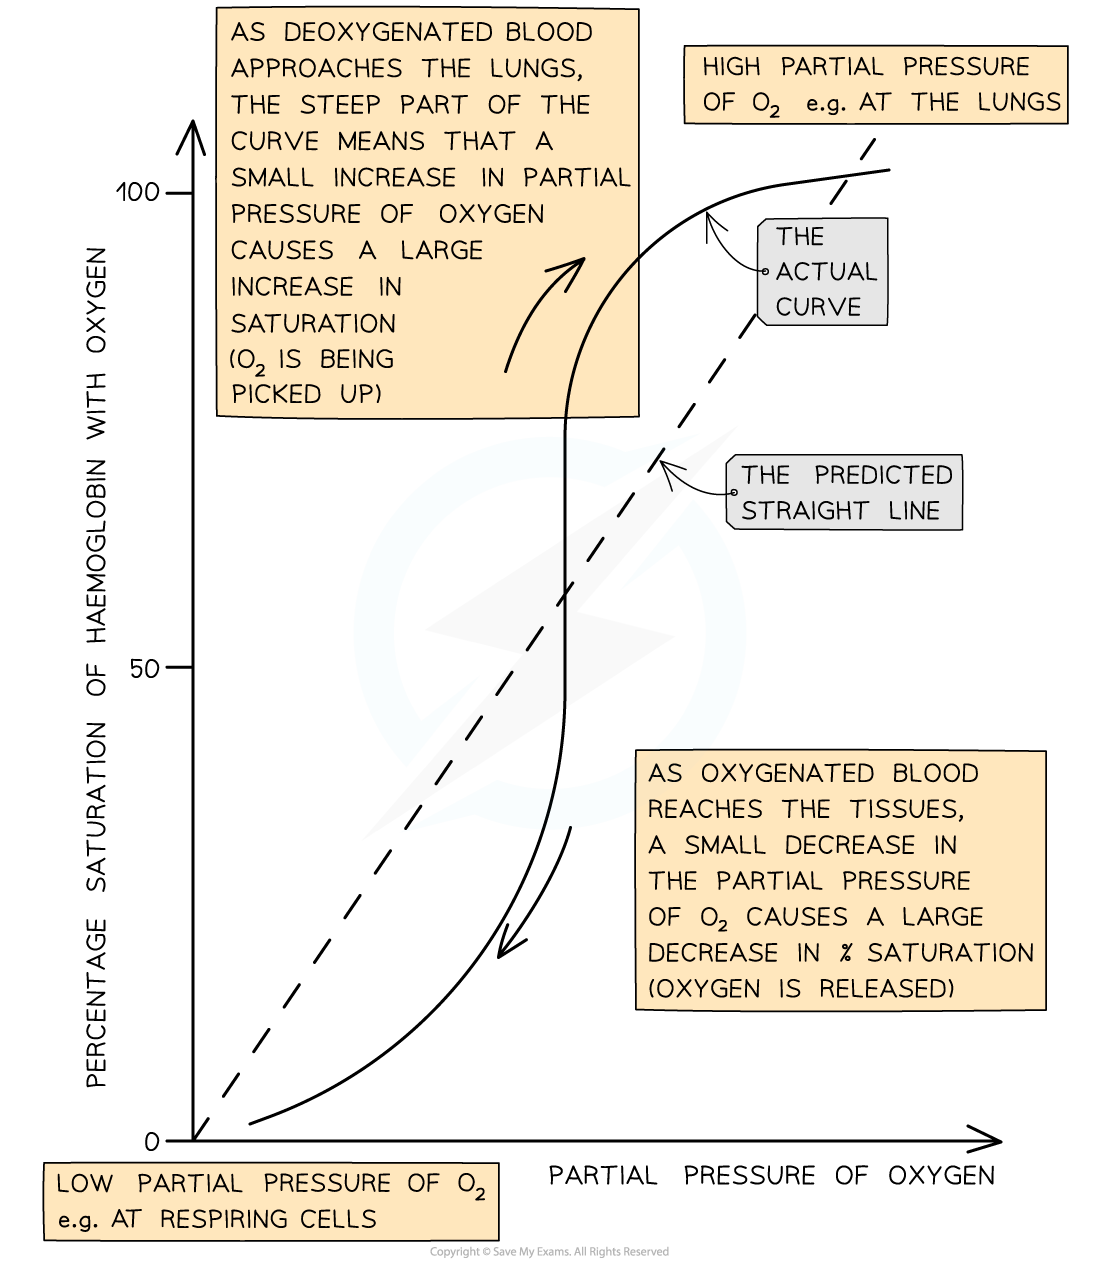
When the curve is read from left to right, it provides information about the rate at which haemoglobin binds to oxygen at different partial pressures of oxygen
At low pO2 (in the bottom left corner of the graph) oxygen binds slowly to haemoglobin
This means that haemoglobin cannot pick up oxygen and become saturated as blood passes through the body's oxygen-depleted tissues
Haemoglobin has a low affinity for oxygen at low pO2, so saturation percentage is low
At medium pO2 (in the central region of the graph) oxygen binds more easily to haemoglobin and saturation increases quickly
At this point on the graph a small increase in pO2 causes a large increase in haemoglobin saturation
At high pO2 (in the top right corner of the graph) oxygen binds easily to haemoglobin
This means that haemoglobin can pick up oxygen and become saturated as blood passes through the lungs
Haemoglobin has a high affinity for oxygen at high pO2, so saturation percentage is high
Note that at this point on the graph, increasing the pO2 by a large amount only has a small effect on the percentage saturation of haemoglobin
This is because most oxygen binding sites on haemoglobin are already occupied
When read from right to left, the curve provides information about the rate at which haemoglobin dissociates with oxygen at different partial pressures of oxygen
In the lungs, where pO2 is high
There is very little dissociation of oxygen from haemoglobin
At medium pO2, oxygen dissociates readily from haemoglobin, as shown by the steep region of the curve
This region corresponds with the partial pressures of oxygen present in the respiring tissues of the body, so release of oxygen is important for cellular respiration
At this point on the graph a small decrease in pO2 causes a large decrease in percentage saturation of haemoglobin, leading to easy release of plenty of oxygen to the cells
At low pO2 dissociation slows again
There are few oxygen molecules left on the binding sites, and the release of the final oxygen molecule becomes more difficult, in a similar way to the slow binding of the first oxygen molecule
Explaining the Oxygen Dissociation Curve
The curved shape of the oxygen dissociation curve for haemoglobin can be explained as follows
Due to the shape of the haemoglobin molecule it is difficult for the first oxygen molecule to bind to haemoglobin
This means that binding of the first oxygen occurs slowly
This explains the relatively shallow curve at the bottom left corner of the graph
After the first oxygen molecule binds to haemoglobin, the haemoglobin protein changes shape, or conformation
This makes it easier for the next oxygen molecules to bind
This speeds up binding of the remaining oxygen molecules and explains the steeper part of the curve in the middle of the graph
The shape change of haemoglobin leading to easier oxygen binding is known as cooperative binding
As the haemoglobin molecule approaches saturation it takes longer for the fourth oxygen molecule to bind due to the shortage of remaining binding sites
This explains the levelling off of the curve in the top right corner of the graph

Unlock more, it's free!
Join the 100,000+ Students that ❤️ Save My Exams
the (exam) results speak for themselves:

Was this revision note helpful?
Build on this topic
