12 marks

The curve with equation is translated so that the point at (0, 0) is mapped onto the point (4, 0).
Find an equation of the translated curve.
Was this exam question helpful?
Exam code: 1MA1
The curve with equation is translated so that the point at (0, 0) is mapped onto the point (4, 0).
Find an equation of the translated curve.
Was this exam question helpful?
The graph of is shown on both grids below.
i) On this grid, draw the graph of

[1]
ii) On the grid below, draw the graph of

[1]
Was this exam question helpful?

The diagram shows part of the curve with equation .
The coordinates of the minimum point of this curve are
Write down the coordinates of the minimum point of the curve with equation
i)
[1]
ii)
[1]
iii)
[1]
Was this exam question helpful?
The graph of is shown on the grid.

The graph G is a translation of the graph of .
Write down, in terms of , the equation of graph G.
The graph of has a maximum point at (-4, 3).
Write down the coordinates of the maximum point of the graph of
Was this exam question helpful?
The diagram shows a sketch of the curve with equation

There is only one maximum point on the curve.
The coordinates of this maximum point are (5, 7)
Write down the coordinates of the maximum point on the curve with equation
i)
[1]
ii)
[1]
Was this exam question helpful?
Here is the graph of

On the grid above, draw the graph of
Was this exam question helpful?
The curve with equation is transformed to the curve with equation by the single transformation
Describe fully the transformation
Was this exam question helpful?
On the axes, sketch the curve
You must show the coordinates of the -intercept.

Was this exam question helpful?
One of these is the graph of for
Choose the letter above the correct graph.

Was this exam question helpful?
(7, 28) is a point on the graph
Choose the point which must be on the graph
(7, 26)
(7, 30)
(5, 28)
(9, 28)
Was this exam question helpful?

The diagram shows part of the curve with equation .
The coordinates of the maximum point of the curve are (3, 5).
Write down the coordinates of the maximum point of the curve with equation
i)
[1]
ii)
[1]
iii)
[1]
The curve with equation is transformed to give the curve with equation
Describe the transformation.
Was this exam question helpful?
The diagram shows a sketch of the graph of

Write down the coordinates of the point .
On the same diagram, draw a sketch of the graph of
Was this exam question helpful?
Here is the graph of for

On the grid, sketch the graph of for
Was this exam question helpful?
Here is the graph of for

On the grid above, sketch the graph of for
Here is the graph of for

On the grid above, sketch the graph of for
Was this exam question helpful?
The graph of is shown on the grids.
On this grid, sketch the graph of

On this grid, sketch the graph of

Was this exam question helpful?
The graph of is shown on the grid.

On the grid above, sketch the graph of .
The graph of is shown on the grid.

The graph G is a translation of the graph of
Write down the equation of graph G.
Was this exam question helpful?
Here is the graph of for

In parts (a) and (b) the graph of is shown as a dashed line.
On the grid below, draw the graph of for

On the grid below, draw the graph of

Rita tries to draw the graph of for Here is her graph.

Give a reason why Rita’s graph is incorrect.
Was this exam question helpful?
Here is a sketch of
The curve passes through the points (–2, –10) (–1, –3) (0, –2) (1, –1) (2, 6)

On the grid, sketch the curve
Was this exam question helpful?
The curve with equation is reflected in the -axis.
Choose the equation of the reflected curve.
Was this exam question helpful?
The graph of for crosses the -axis in two places.
Write down the values of where this occurs.
...........................
Was this exam question helpful?
Sketch the graph of for .

Was this exam question helpful?
is a curve on a graph.
It is transformed to the curve .
Describe the single transformation that has been performed on the curve .
Was this exam question helpful?
Below is a sketch of the graph .
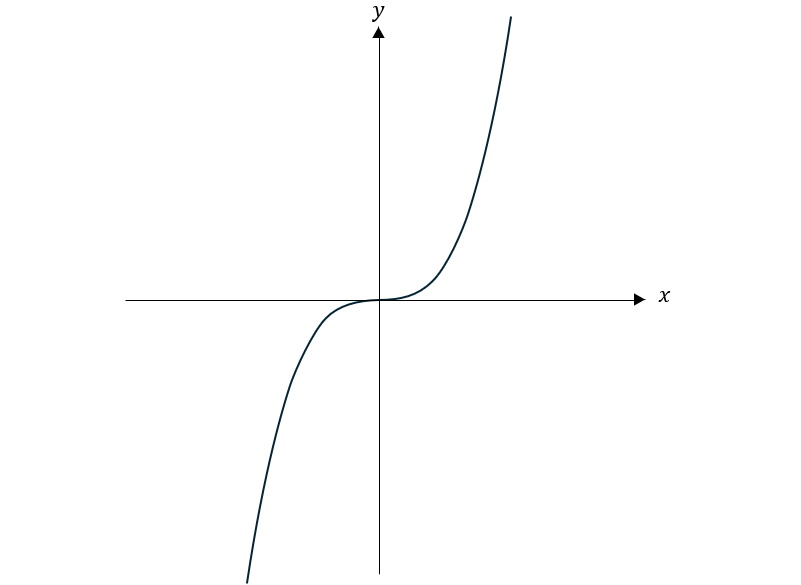
Describe the transformation from to .
Sketch the transformation on the axes above, labelling any points of intersection with the axes.
The graph of is reflected in the axis.
Write the equation of the reflected graph.
Was this exam question helpful?
The graph of is transformed to give the graph of
The point D on the graph is mapped to point R on the graph of
The co-ordinates of point D are
Find the co-ordinates of point R.
Was this exam question helpful?
The graph of is shown on each of the grids.
On this grid, sketch the graph of

On this grid, sketch the graph of

Was this exam question helpful?
The graph of is shown on both grids below

On the grid above, sketch the graph of

On this grid, sketch the graph of
Was this exam question helpful?
This is a sketch of the curve with the equation
The only minimum point of the curve is at .

Write down the coordinates of the minimum point of the curve with the equation
Write down the coordinates of the minimum point of the curve with the equation
Was this exam question helpful?

The graph of for values of from is shown above.
On the same axes, draw the graph of for values of from
Was this exam question helpful?
The graph of is transformed to give the graph of
The point on the graph of is mapped to the point on the graph of
The coordinates of point are
Find the coordinates of point .
Was this exam question helpful?
The graph of the curve with equation is transformed to give the graph of the curve with equation
The point on with coordinates is mapped to the point on .
Find the coordinates of .
Was this exam question helpful?
The graph of intersects the -axis at two points.
The coordinates of the two points are (–1, 0) and (6, 0)
The graph of passes through the point with coordinates (2, 0), where is a constant.
Find the two possible values of .
Was this exam question helpful?
The curve has equationwhere
The curve has equation where
By writing in the form , where and are constants, describe fully a series of transformations that map the curve onto the curve .
Was this exam question helpful?
The curve has equation where
The point is the maximum point on .
Write down the coordinates of .
The curve is transformed to the curve by a translation of Find an equation for the curve .
The curve is transformed to the curve .
The curve has equation
Describe fully the transformation that maps curve onto curve .
Was this exam question helpful?
The graph of for is drawn on the grid below.

Find the value of , the value of and the value of .
a = .......................................................
b = .......................................................
c = .......................................................
Was this exam question helpful?
The equation of a curve is
The curve is transformed to curve under the translation
Find an equation of curve .
You do need to simplify the equation.
Was this exam question helpful?
The graph of is translated 4 units to the right.
The translated graph has equation
Work out .
Give your answer in the form where and are integers.
Was this exam question helpful?
Curve has equation
Curve is a reflection in the -axis of curve .
Work out the equation of curve .
Give your answer in the form where and are integers.
Was this exam question helpful?
For all values of
On the grid, draw the graph of the composite function for

Was this exam question helpful?