National 5MathsSQARevision NotesAlgebraic SkillsSimultaneous EquationsGraphical Solution to Simultaneous Equations
Graphical Solution to Simultaneous Equations (SQA National 5 Maths): Revision Note
Exam code: X847 75

Solving simultaneous equations graphically
How do I solve linear simultaneous equations graphically?
The solutions to simultaneous equations can be seen on a graph of the two equations
If the graph is not provided, plot both equations on the same set of axes
To do this, you can use a table of values
or rearrange into y = mx + c if that helps
Find where the lines intersect (cross over)
The x and y solutions to the simultaneous equations are the x and y coordinates of the point of intersection
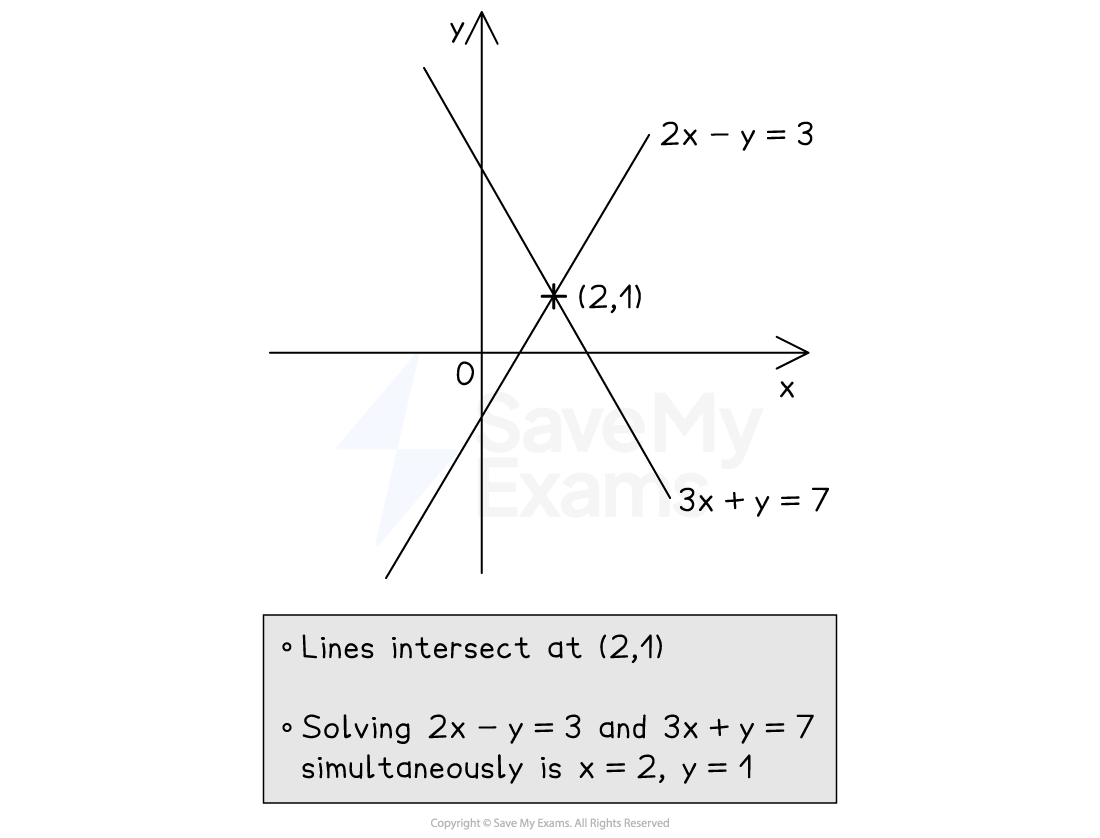
For example, to solve 2x - y = 3 and 3x + y = 4 simultaneously
First plot them both on the same axes (see graph)
Find the point of intersection, (2, 1)
The solution is x = 2 and y = 1

Unlock more, it's free!
Join the 100,000+ Students that ❤️ Save My Exams
the (exam) results speak for themselves:

Was this revision note helpful?
