Line of Best Fit (SQA National 5 Maths): Revision Note
Exam code: X847 75

Finding the equation of the line of best fit
What is a scattergraph?
Scattergraphs (sometimes called scatter diagrams or scatter plots) are used to plot pairs of data
For example, students' Maths grades against their Physics grades
The vertical and horizontal axes represent the two quantities being measured
Points are plotted as dots, •
They are not joined up
What is a line of best fit?
A line of best fit is a straight line drawn through a scattergraph
It shows the overall direction of the data
It represents the best estimate of the relationship between the two variables
In the exam, the line of best fit will be drawn for you on a scattergraph
You will need to find the equation of the line
The equation can then be used to estimate values for other data pairs
How do I find the equation of a line of best fit on a scattergraph?
In the exam, you will know the coordinates of two points on a scattergraph that lie on the line of best fit
You may be told the coordinate values in the context of the question
For example, "point A represents a student with a Maths score of 79 and a Physics score of 83"
Or you may be able to read the values off the grid on which the scattergraph is plotted
With the coordinates of those two points, use the usual method for finding the equation of a line
Start by finding the gradient
Then use to find the equation of the line
Use the variables that are defined in the question
These may not be and
Examiner Tips and Tricks
Be careful to get the coordinates for the '-variable' (variable on the horizontal axis) and '-variable' (variable on the vertical axis) the right way round!
Estimating values using a line of best fit
Once you know the equation of the line of best fit you can use it to
estimate values of the '-variable' (the variable on the vertical axis)
that correspond to values of the '-variable' (the variable on the horizontal axis)
To find an estimate
Substitute the value of the -variable into the equation of the line of best fit
and work out the value of the corresponding -variable
Examiner Tips and Tricks
Remember that a value worked out this way is only an estimate.
Worked Example
A local wildlife trust monitors the success of a new conservation area by recording the number of breeding pairs of a specific rare bird species over time.
The scattergraph shows the relationship between the time since the conservation area was established ( years) and the Number of breeding pairs ().
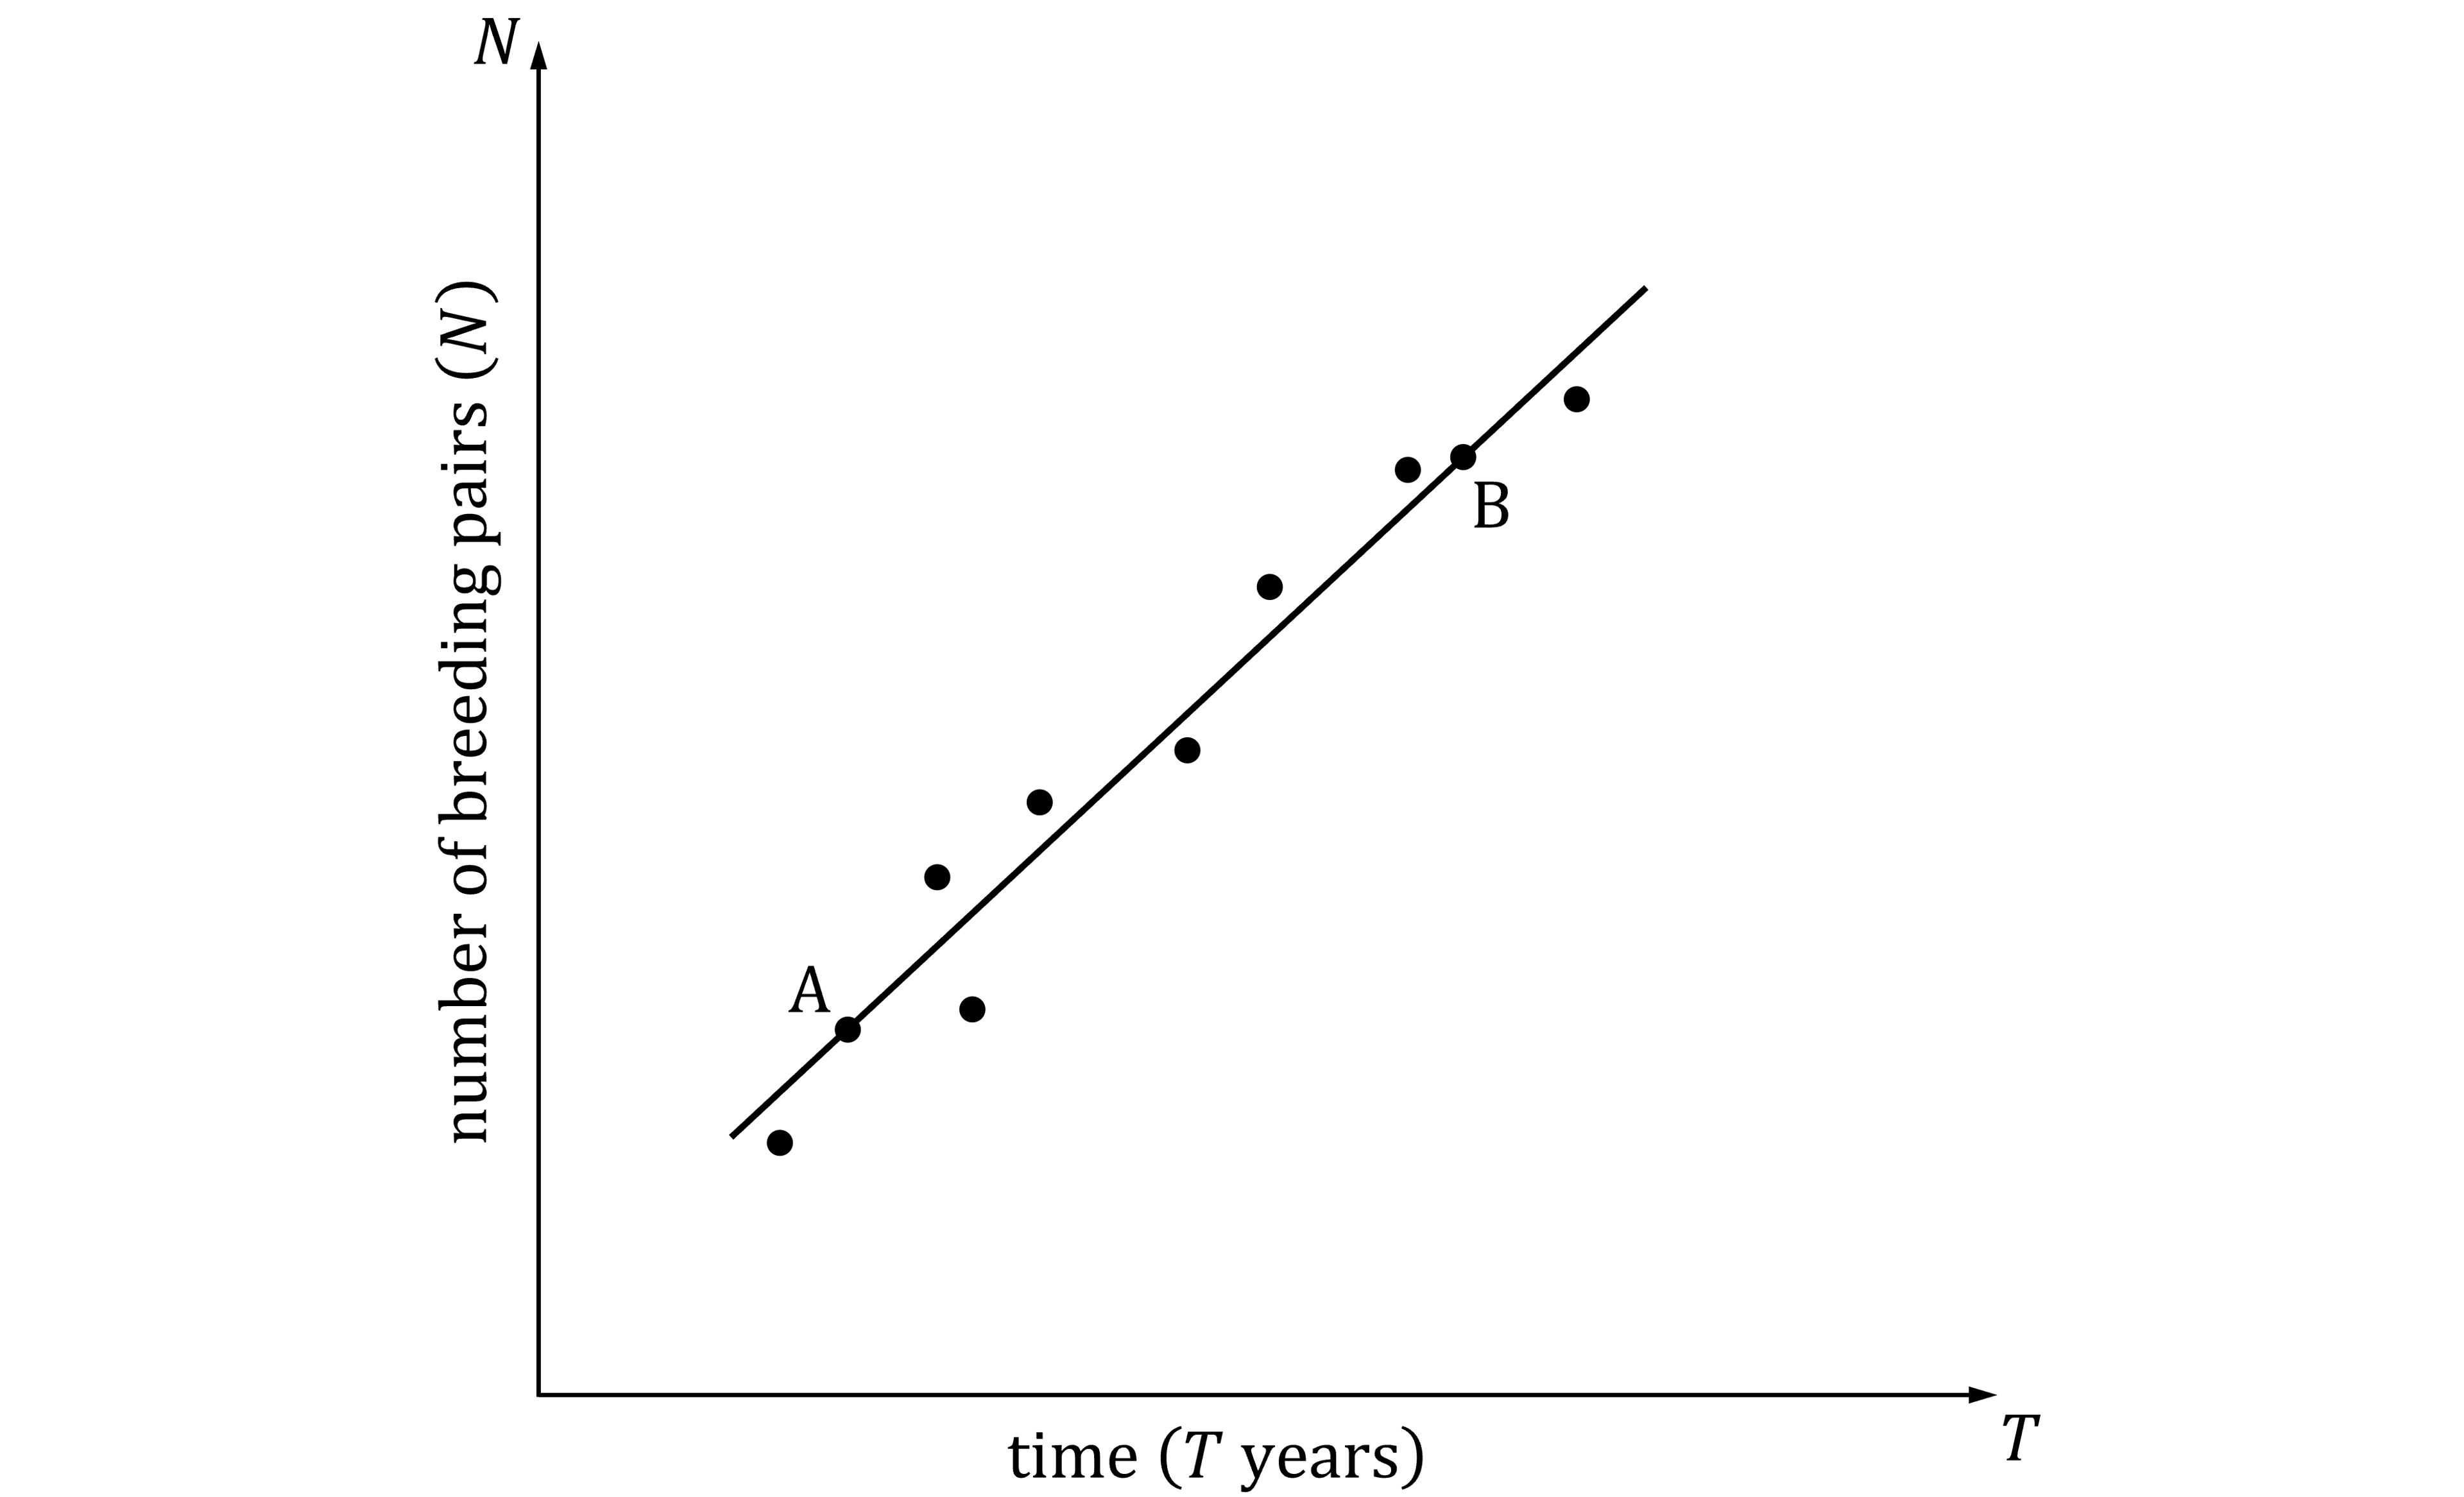
A line of best fit has been drawn.
Point A represents 14 breeding pairs recorded 5 years after the conservation area was established.
Point B represents 34 breeding pairs recorded 15 years after the conservation area was established.
(a) Find the equation of the line of best fit in terms of and . Give the equation in its simplest form.
No record was made of the number of breeding pairs 9 years after the establishment of the conservation area.
(b) Use your equation from part (a) to estimate the number of breeding pairs expected after 9 years.
Answer:
Part (a)
Use the information in the question to identify the coordinates of points A and B
is the '-variable' (variable on the horizontal axis)
is the '-variable' (variable on the vertical axis)
Find the gradient of the line between those two points
Substitute the gradient and coordinates into and simplify
Remember to use instead of and instead of
Using point as the point on the line gives
Expand the brackets and simplify
Part (b)
Substitute into the equation and find the corresponding value of
22 breeding pairs

Unlock more, it's free!
Join the 100,000+ Students that ❤️ Save My Exams
the (exam) results speak for themselves:

Was this revision note helpful?
Build on this topic
