Sketching Quadratics (SQA National 5 Maths): Revision Note
Exam code: X847 75

Sketching quadratics y = (ax - m)(bx - n)
What is the connection between the solutions of a quadratic equation and the corresponding quadratic graph?
There is an important connection between
the quadratic graph of
and the solutions of the corresponding quadratic equation
If is a solution to
then the graph of intercepts the -axis at
Remember that is the equation of the -axis
This means you can use a quadratic graph to find solutions to the corresponding quadratic equation
The -coordinates of its -axis intercepts (if any) are the solutions to the equation
It also means you can use the solutions to a quadratic equation to determine features of the corresponding quadratic graph
For example if the equation has two distinct solutions, then the graph intersects the -axis at two points
If the equation only has one solution, then the graph only touches the -axis at a single point
If the equation has no solutions, then the graph does not intersect the -axis (it is either wholly above or wholly below it)
How do I sketch a quadratic graph from an equation in factorised form?
It is easy to sketch the graph of a quadratic if its equation is given in factorised form
For example, to sketch the graph of
Solve by setting the brackets equal to zero and solving
So the quadratic intercepts the -axis at and
The axis of symmetry occurs midway between the -axis intercepts
So the axis of symmetry is
The turning point lies on the axis of symmetry
Substitute into the equation
So the turning point is at
The -axis intercept occurs when
Substitute into the equation
So the -axis intercept is at
That is all you need to sketch the graph!
If the turning point is below the -axis (i.e. has a negative -coordinate)
then the parabola is -shaped
If the turning point is above the -axis (i.e. has a positive -coordinate)
then the parabola is -shaped
Examiner Tips and Tricks
A sketch does not need to be 'perfect' or 'to scale', it just needs to show the main features of the graph:
Smooth parabola that is correctly shown as -shaped or -shaped
Axis intercepts and turning point labelled, and drawn on the correct sides of the - and -axes
Worked Example
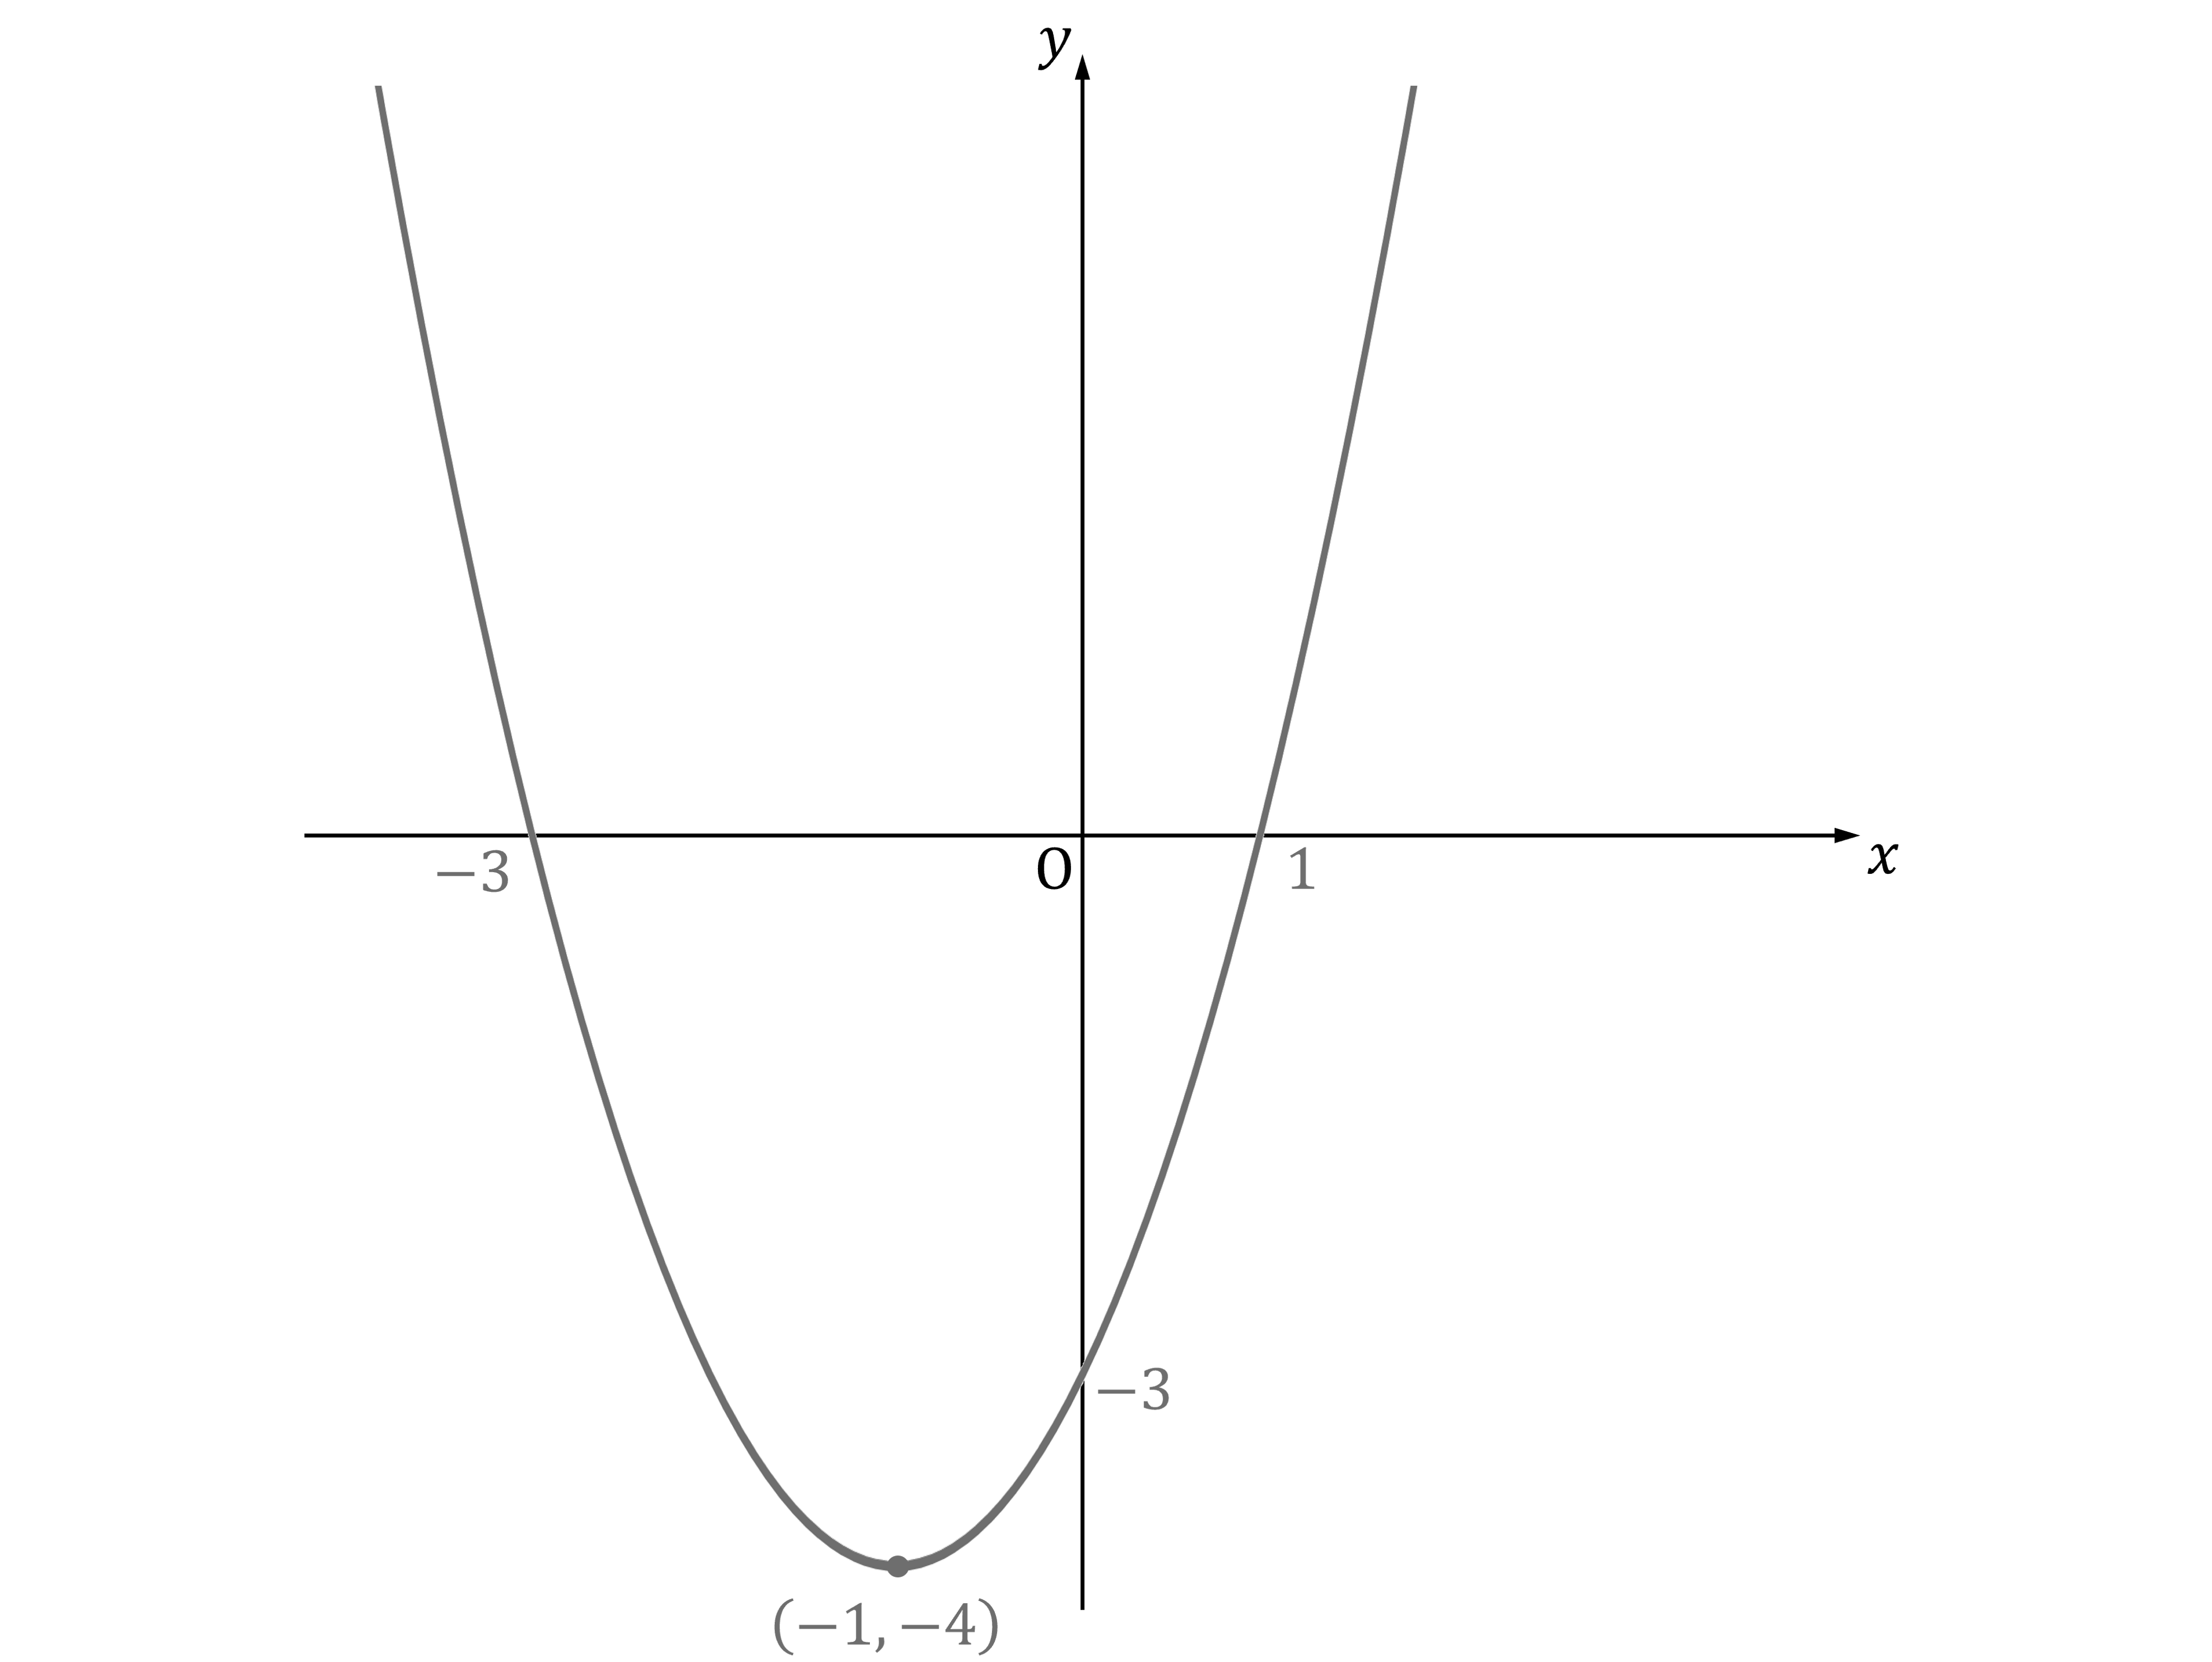
Sketch the graph of using the axes provided below.
On your sketch, show clearly the points of intersection with the -axis and the -axis, and the coordinates of the turning point.

Answer:
The roots will be the solutions to
The two solutions will be the solutions of each bracket set equal to zero
That lets you know the graph will cross the -axis at and
The intersection with the -axis will occur when
So the graph will cross the -axis at
Because a quadratic graph is symmetric, the -coordinate of the turning point will be halfway between the two -axis intercepts
So the -coordinate of the turning point will be
To find the -coordinate, substitute into the equation for the curve
So the turning point is at
Draw a smooth quadratic curve that shows those axis intercepts and the turning point
It will be an 'up' or -shaped parabola, because the first term if you expand is
Be sure to label the coordinates for the three axis intercepts and the turning point
Sketching quadratics y = k(x + p)² + q
How do I sketch a quadratic graph from an equation in completed square form?
It is easy to sketch the graph of a quadratic if its equation is given in completed square form
For example, to sketch the graph of
The turning point of is at
So the turning point of is at
The -axis intercept occurs when
Substitute into the equation
So the -axis intercept is at
The number in front of the bracket, , tells you the shape of the parabola
If is positive, the parabola is -shaped
If is negative, the parabola is -shaped
So is -shaped
That is all you need to sketch the graph!
Note that
is -shaped
and has its turning point above the -axis at
That means that it will not intercept the -axis
If you need to find -axis intercepts for a quadratic in form, you will need to set the quadratic equal to zero and then solve for
For example, for :
The -axis intercepts are at and
Worked Example
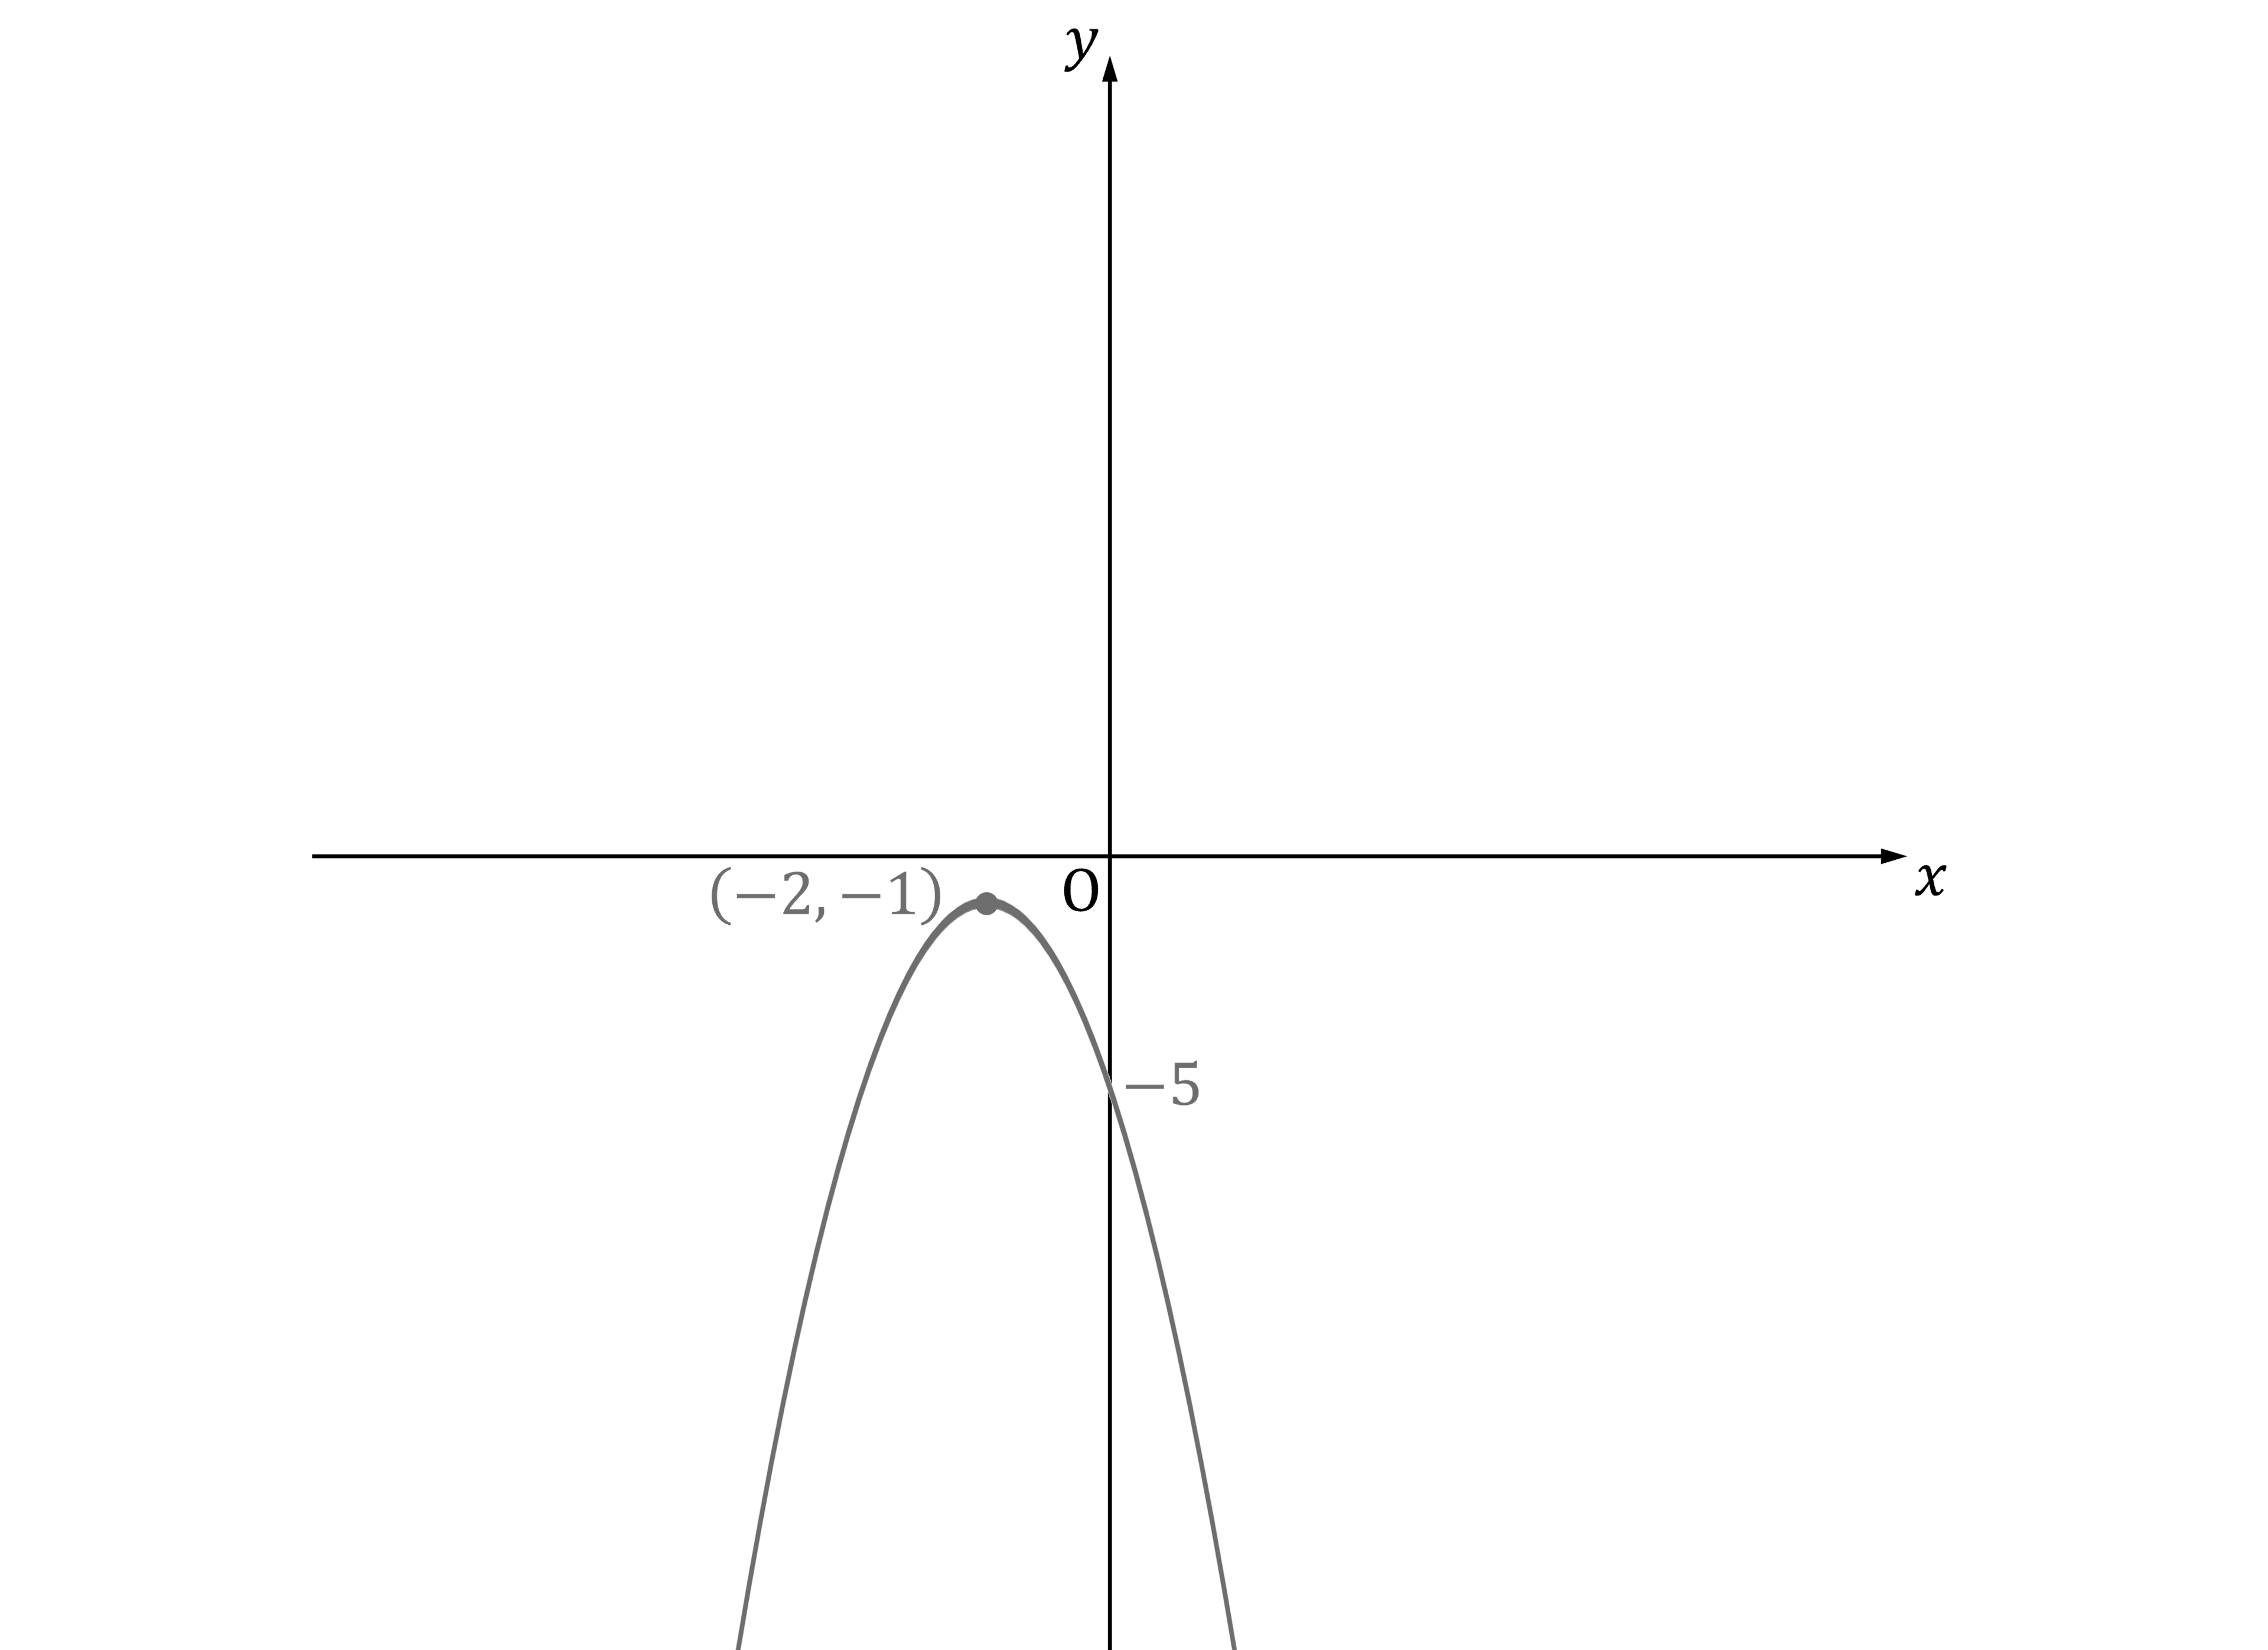
Sketch the graph of using the axes provided below.
On your sketch, show clearly the coordinates of the turning point, as well as any points of intersection with the coordinate axes.
Answer:
Compare it to the standard form with turning point at
turning point at
The intersection with the -axis will occur when
So the graph will cross the -axis at
Draw a smooth quadratic curve that shows that -axis intercepts and the turning point
It will be a 'down' or -shaped parabola, because there is a negative sign in front of the bracket
The turning point is below the -axis, so because of its shape the parabola will not intersect the -axis

Unlock more, it's free!
Join the 100,000+ Students that ❤️ Save My Exams
the (exam) results speak for themselves:

Was this revision note helpful?
Build on this topic
