Graphs of Basic Trigonometric Functions (SQA National 5 Maths): Revision Note
Exam code: X847 75

Graphs of the three basic trig functions
What trig graphs should I be familiar with?
You should be familiar with the graphs of the following trigonometric functions
The variable is like an angle
but the angle can go beyond acute to become obtuse or reflex
can even be negative, or take on values greater than 360°
Trig graphs have repeating (periodic) shapes and symmetries that you need to know
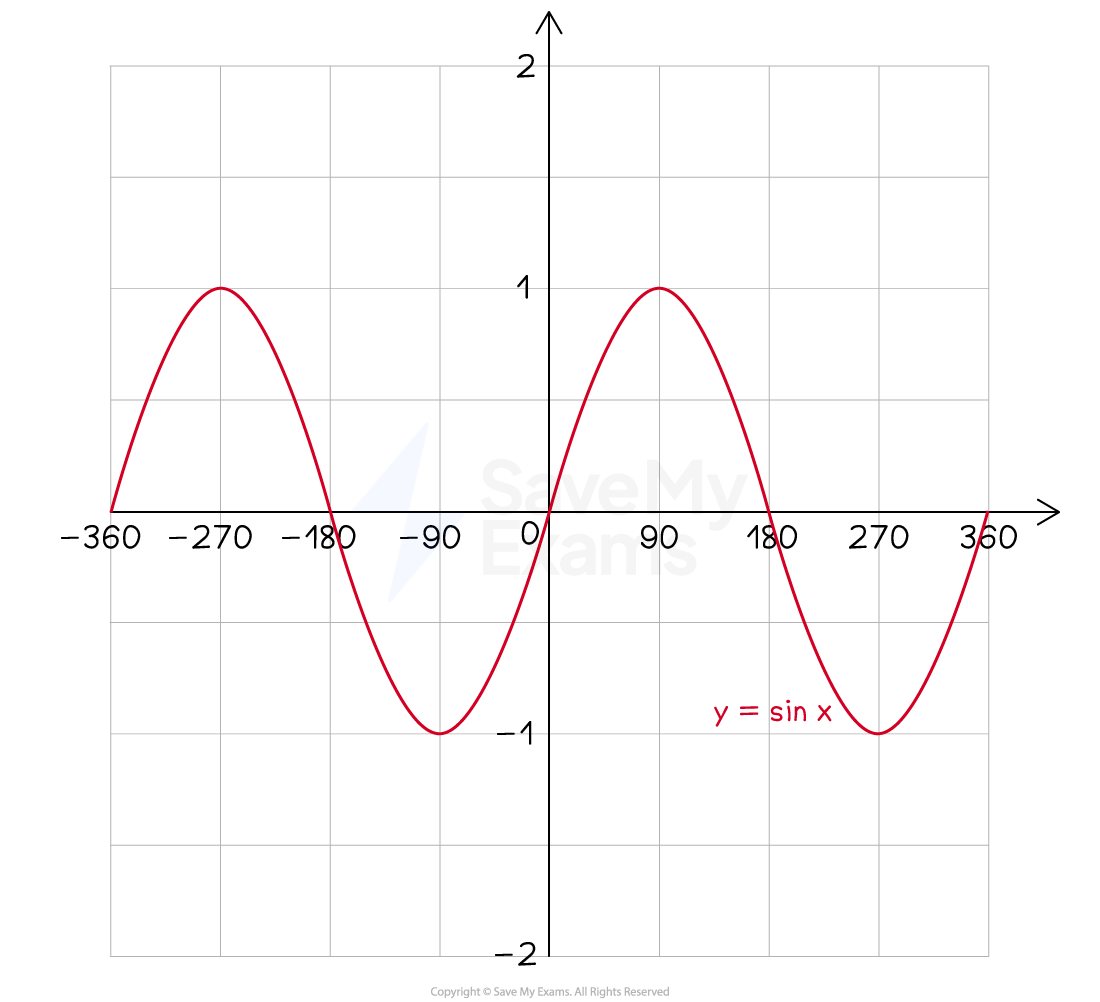
What does the graph of y = sin x look like?
The graph of is a wave that
oscillates between heights of 1 and -1
It has an amplitude of 1 (i.e. it goes a maximum of 1 above and below its 'middle line' on the -axis)
and repeats every 360° (its period is 360°)
It goes through the origin, (0, 0)
Then every 90° it cycles through the heights 1, 0, -1, 0, ...
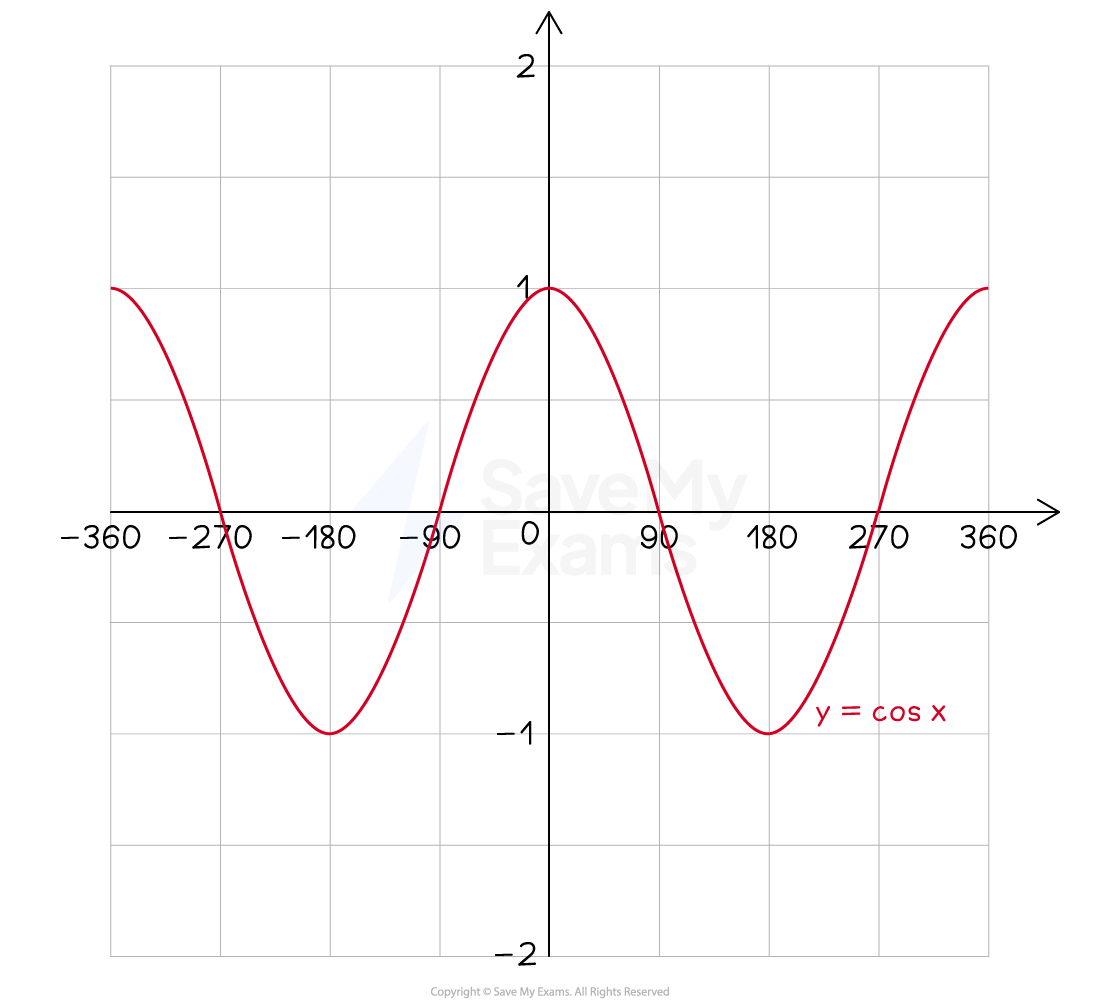
What does the graph of y = cos x look like?
The graph of is a wave that
oscillates between heights of 1 and -1
It has an amplitude of 1 (i.e. it goes a maximum of 1 above and below its 'middle line' on the -axis)
and repeats every 360° (its period is 360°)
It has a y-intercept of 1, coordinates (0, 1)
Then every 90° it cycles through the heights 0, -1, 0, 1, ...
is the same as translating by 90 to the left
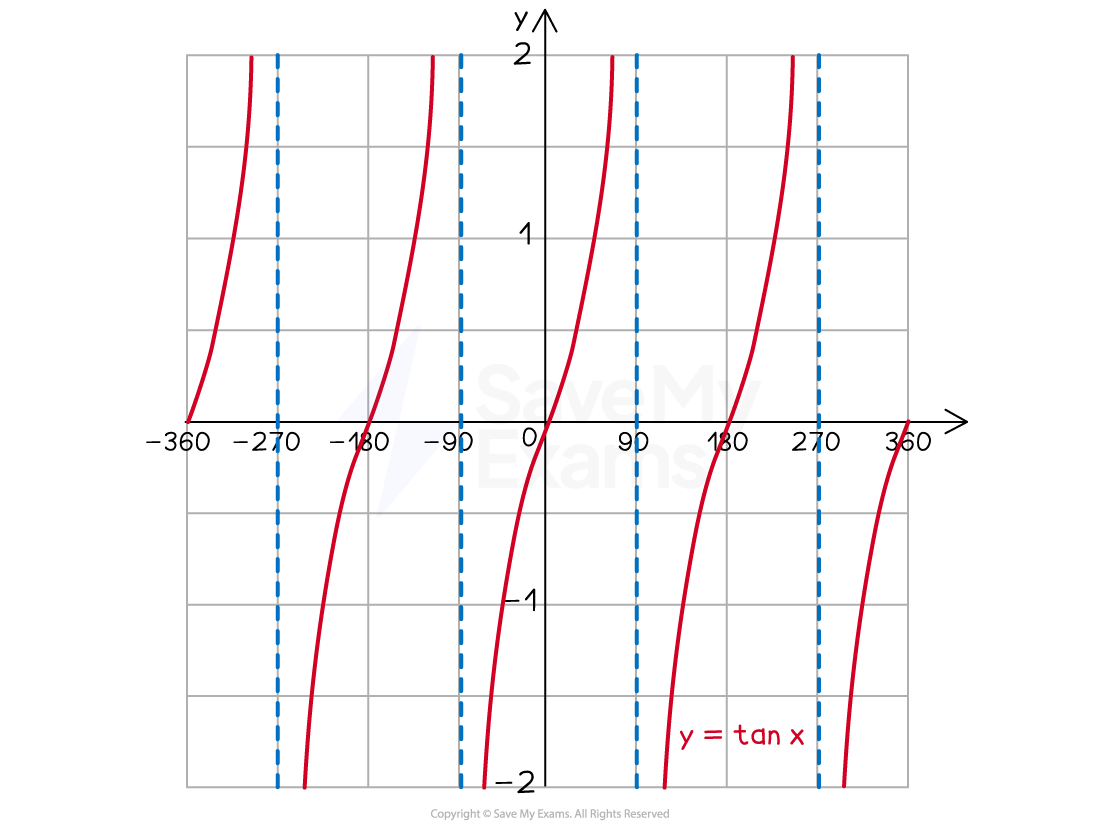
What does the graph of y = tan x look like?
The graph of is not a wave but consists of branches
that repeat every 180° (its period is 180°)
This is half the period of and
is sometimes drawn with dotted vertical lines that separate the branches
These are called asymptotes
These occur every 180° at , , ... (and , , ...)
The graph does not touch these lines, but gets closer and closer to them
has no maximum or minimum values
It can take on any positive or negative value (as well as zero)
A branch heads down towards on the right side of the asymptotes, and heads up towards on the left side of the asymptotes
goes through the origin, (0, 0)

Unlock more, it's free!
Join the 100,000+ Students that ❤️ Save My Exams
the (exam) results speak for themselves:

Was this revision note helpful?
Build on this topic
