Combinations of Transformations (Cambridge (CIE) A Level Maths: Pure 1): Exam Questions

Exam code: 9709

2 hours28 questions
1
4 marks

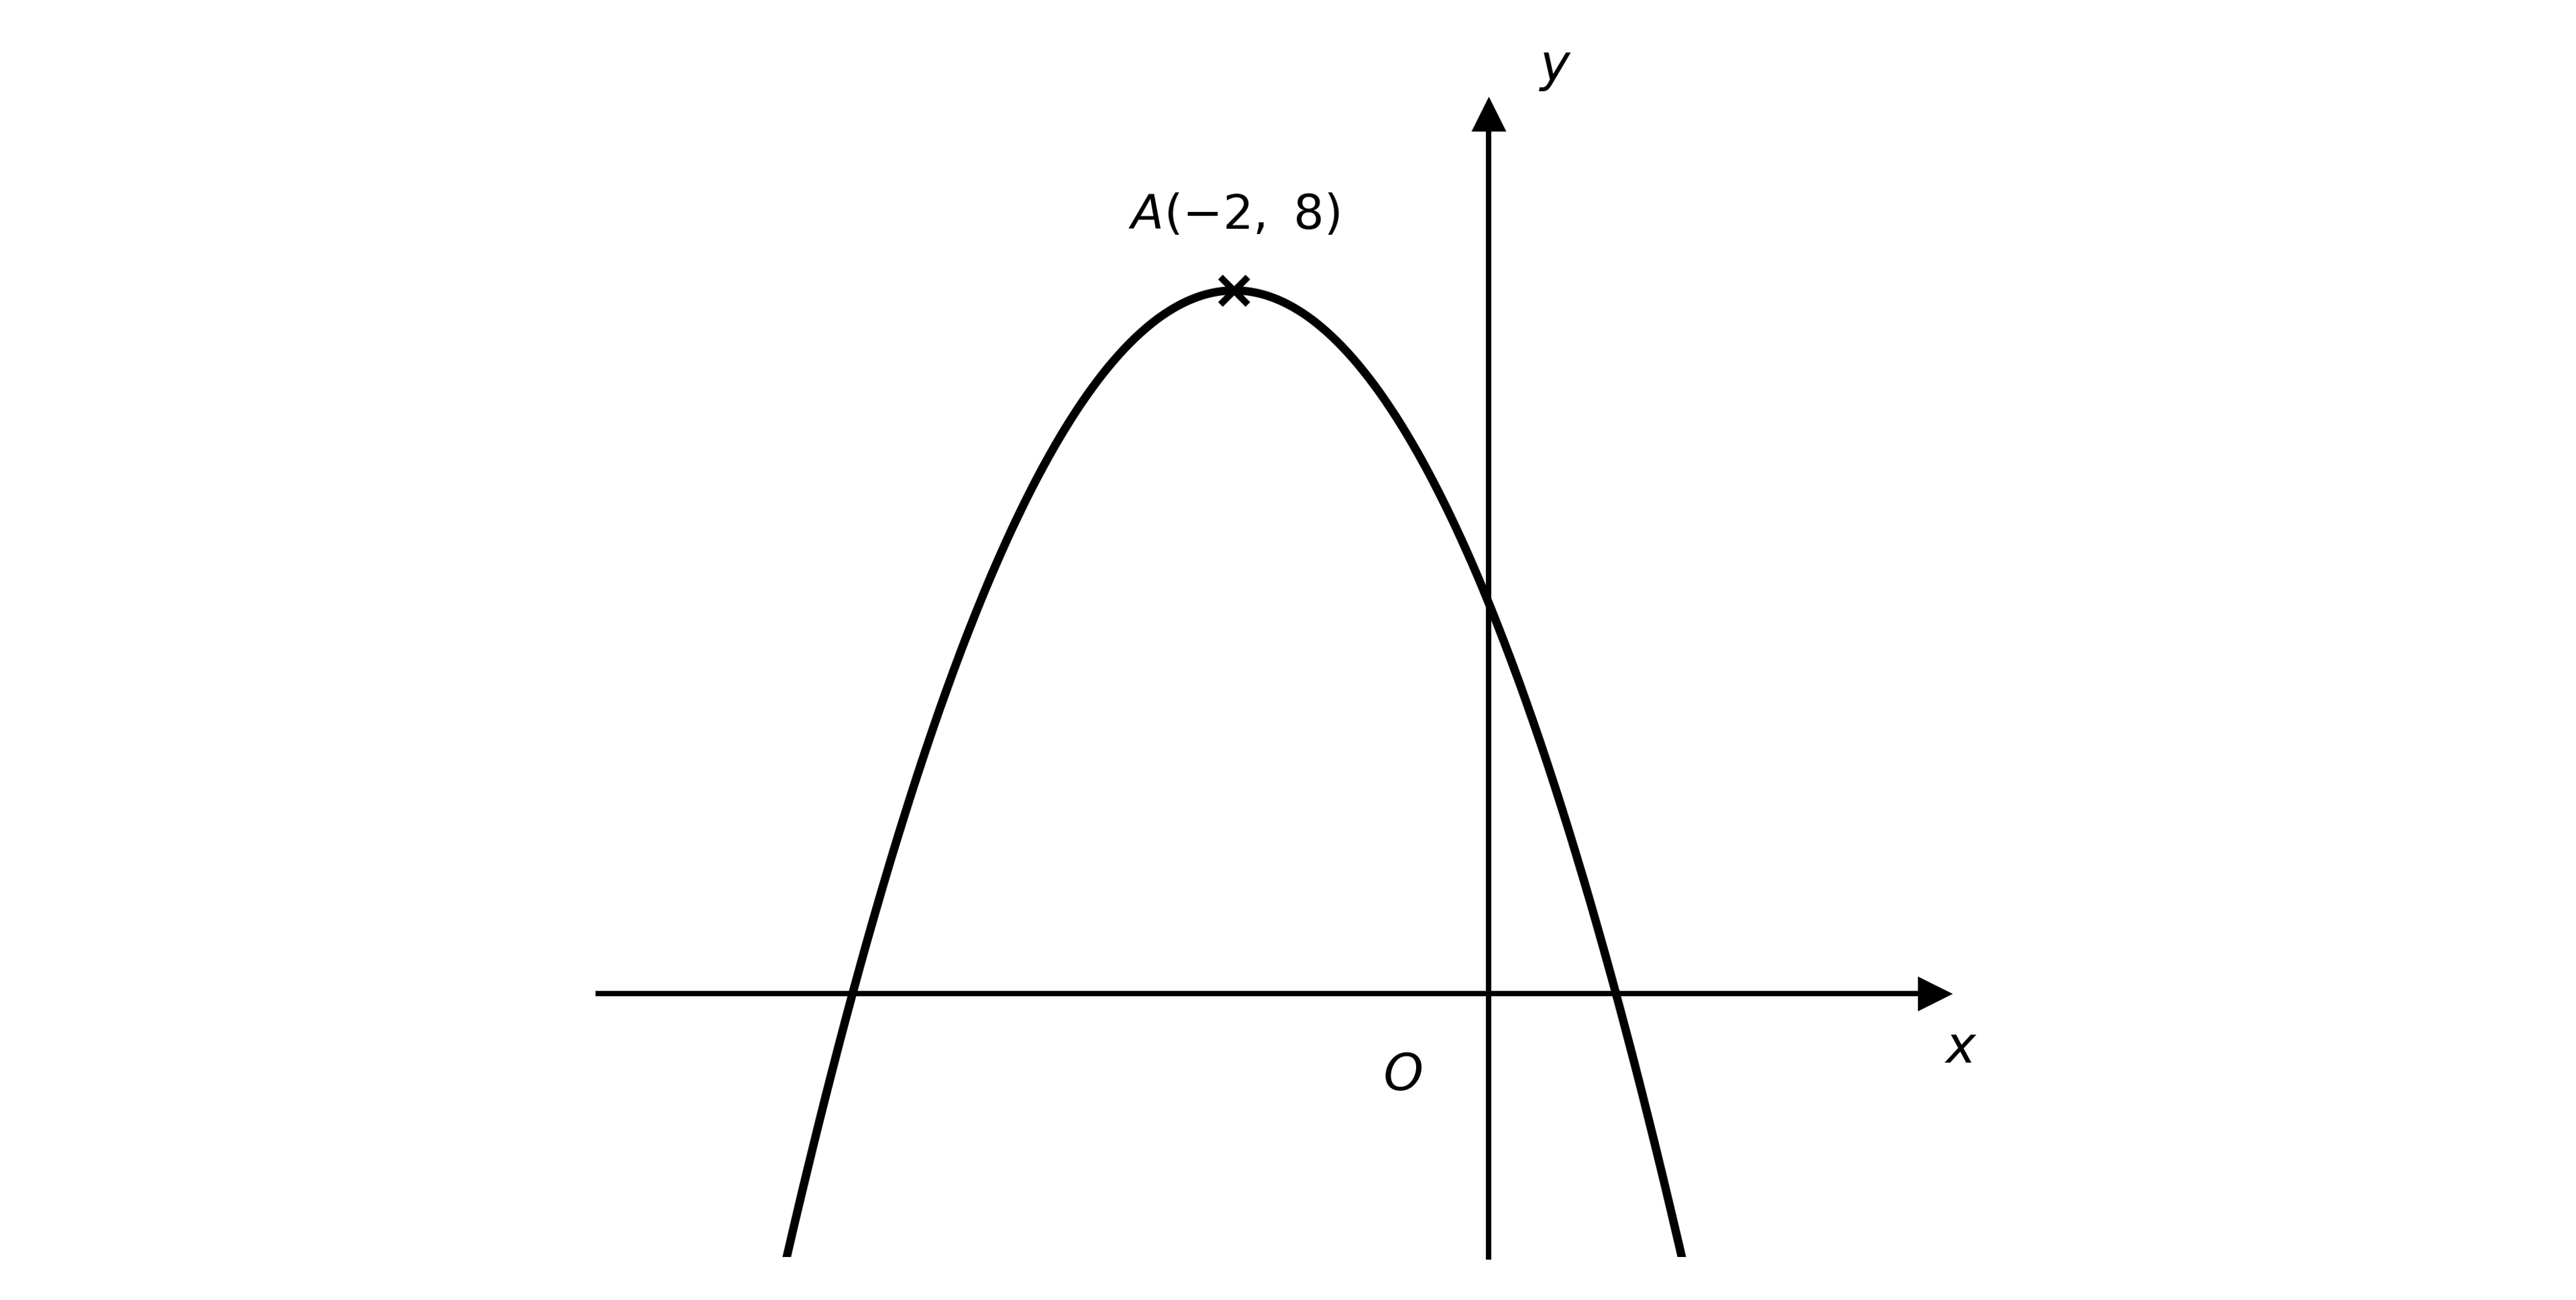
The diagram below shows the graph of y=f(x).

The stationary point A(2,8) is marked on the diagram.

Graph of y = f(x) showing a single maximum stationary point marked A at (-2, 8)

On separate diagrams, sketch the following graphs.

(i) y=2f(x)+1

(ii) y=12f(x+1)

On each diagram, state the coordinates of the image of point A under the given transformation.

2
4 marks

The graph of y=f(x) is transformed. In each case, write down, in terms of f(x), the equation of the resulting graph.

(i) a translation by (23)

(ii) a horizontal stretch with scale factor 2, followed by a vertical stretch with scale factor 3

3a
2 marks

The function g is defined by g(x)=2x.

On the same diagram, sketch the graphs of y=g(x) and y=g1(x), and indicate the line of symmetry.

Label the coordinates of any point where the graphs cross the coordinate axes.

3b
4 marks

(i) Write down an expression for g1(x) in terms of x.

(ii) Find an expression for g1(x) in terms of g(x), and state the single transformation this represents.

4
4 marks

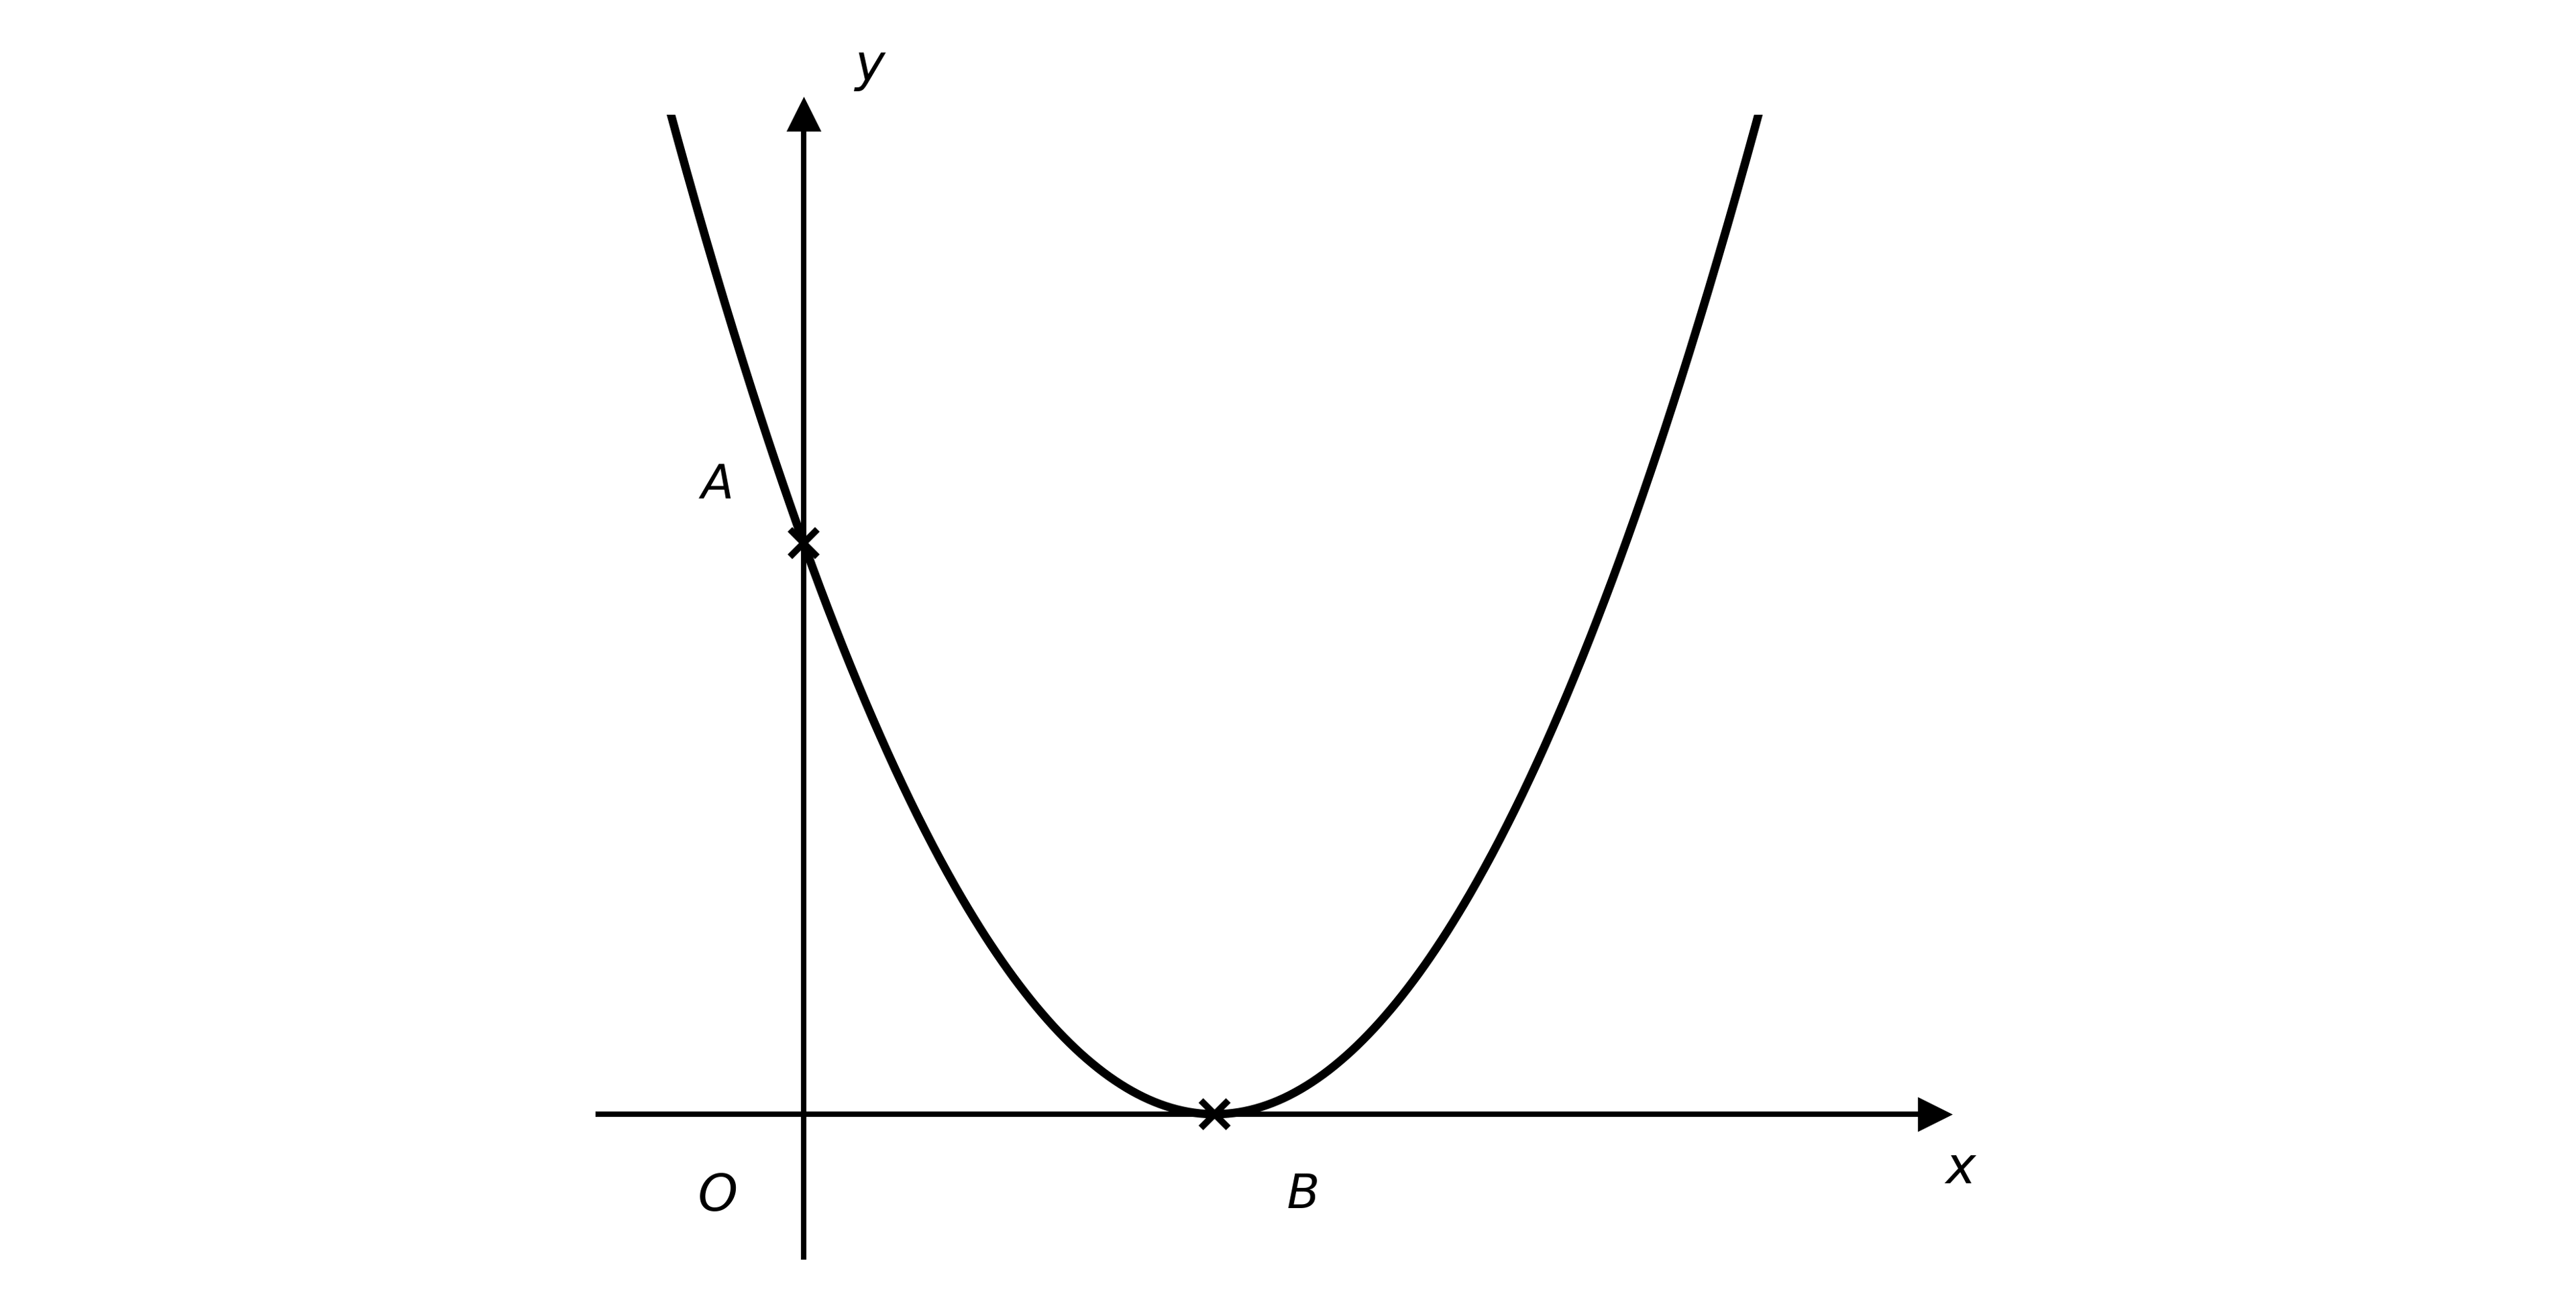
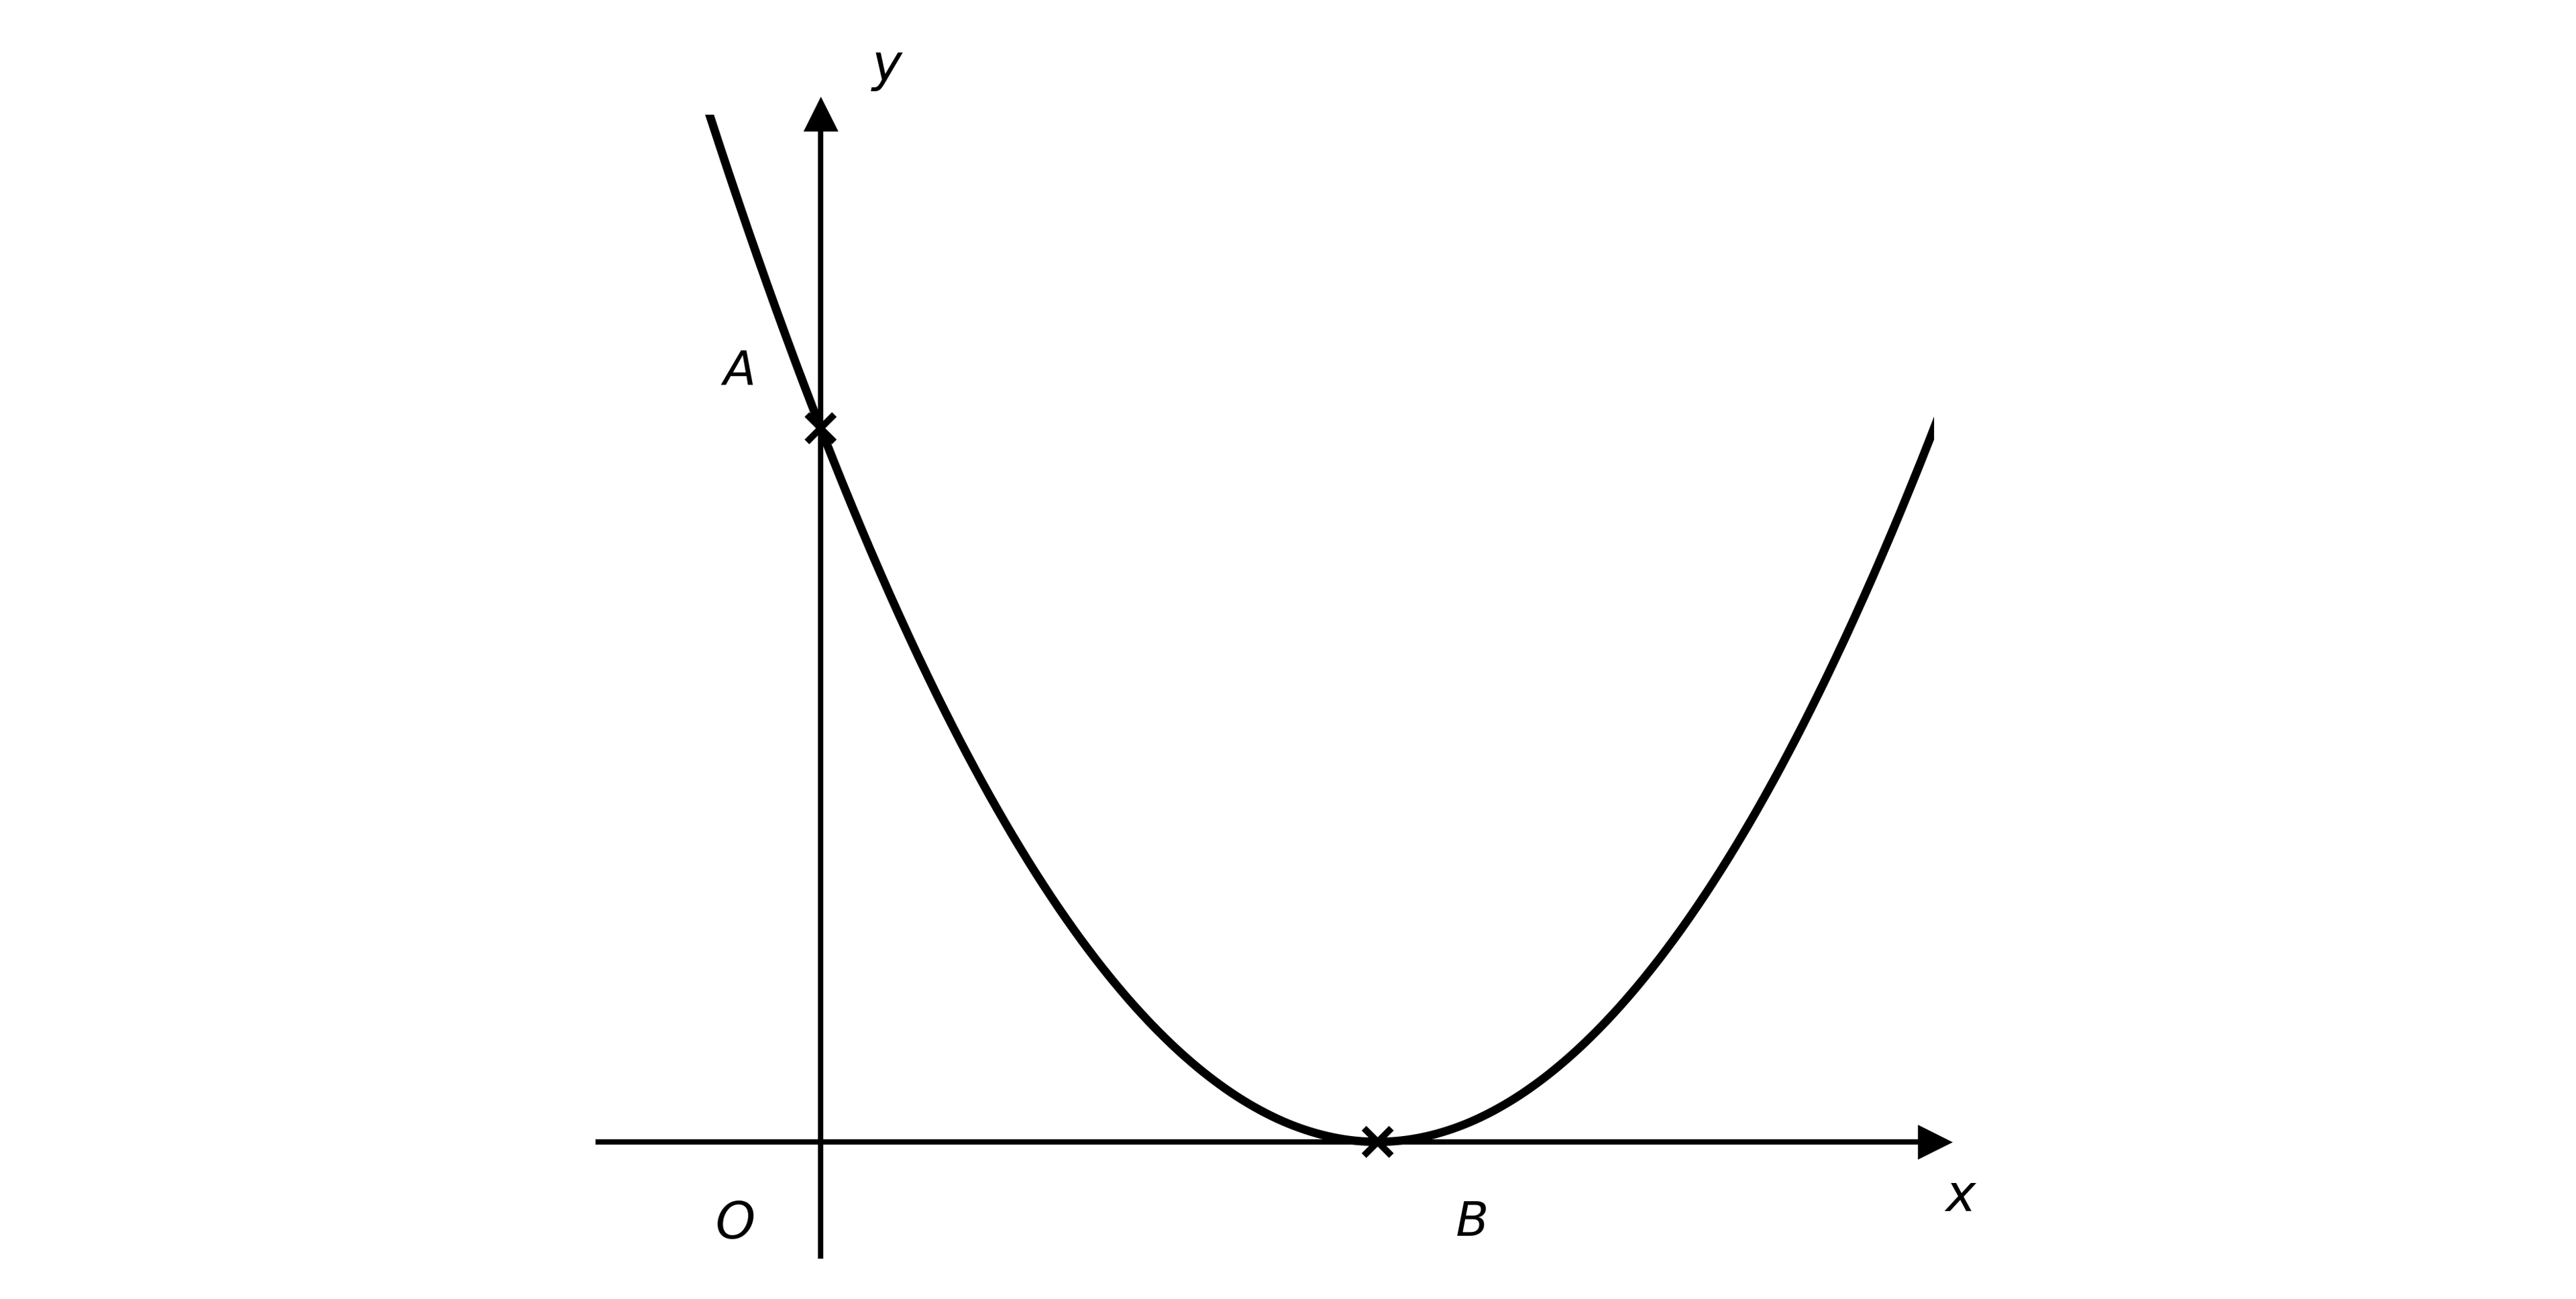
The diagram shows the graph of y=f(x), where f(x)=(x2)2.

Parabola y = (x - 2)^2 with its vertex on the x-axis at B and meeting the y-axis at A

The graph meets the y-axis at A and touches the x-axis at B.

(i) Write down the coordinates of A and B.

(ii) The graph of y=f(x) is transformed to the graph of y=f(x)4. Find the coordinates of the images of A and B under this transformation.

5a
2 marks

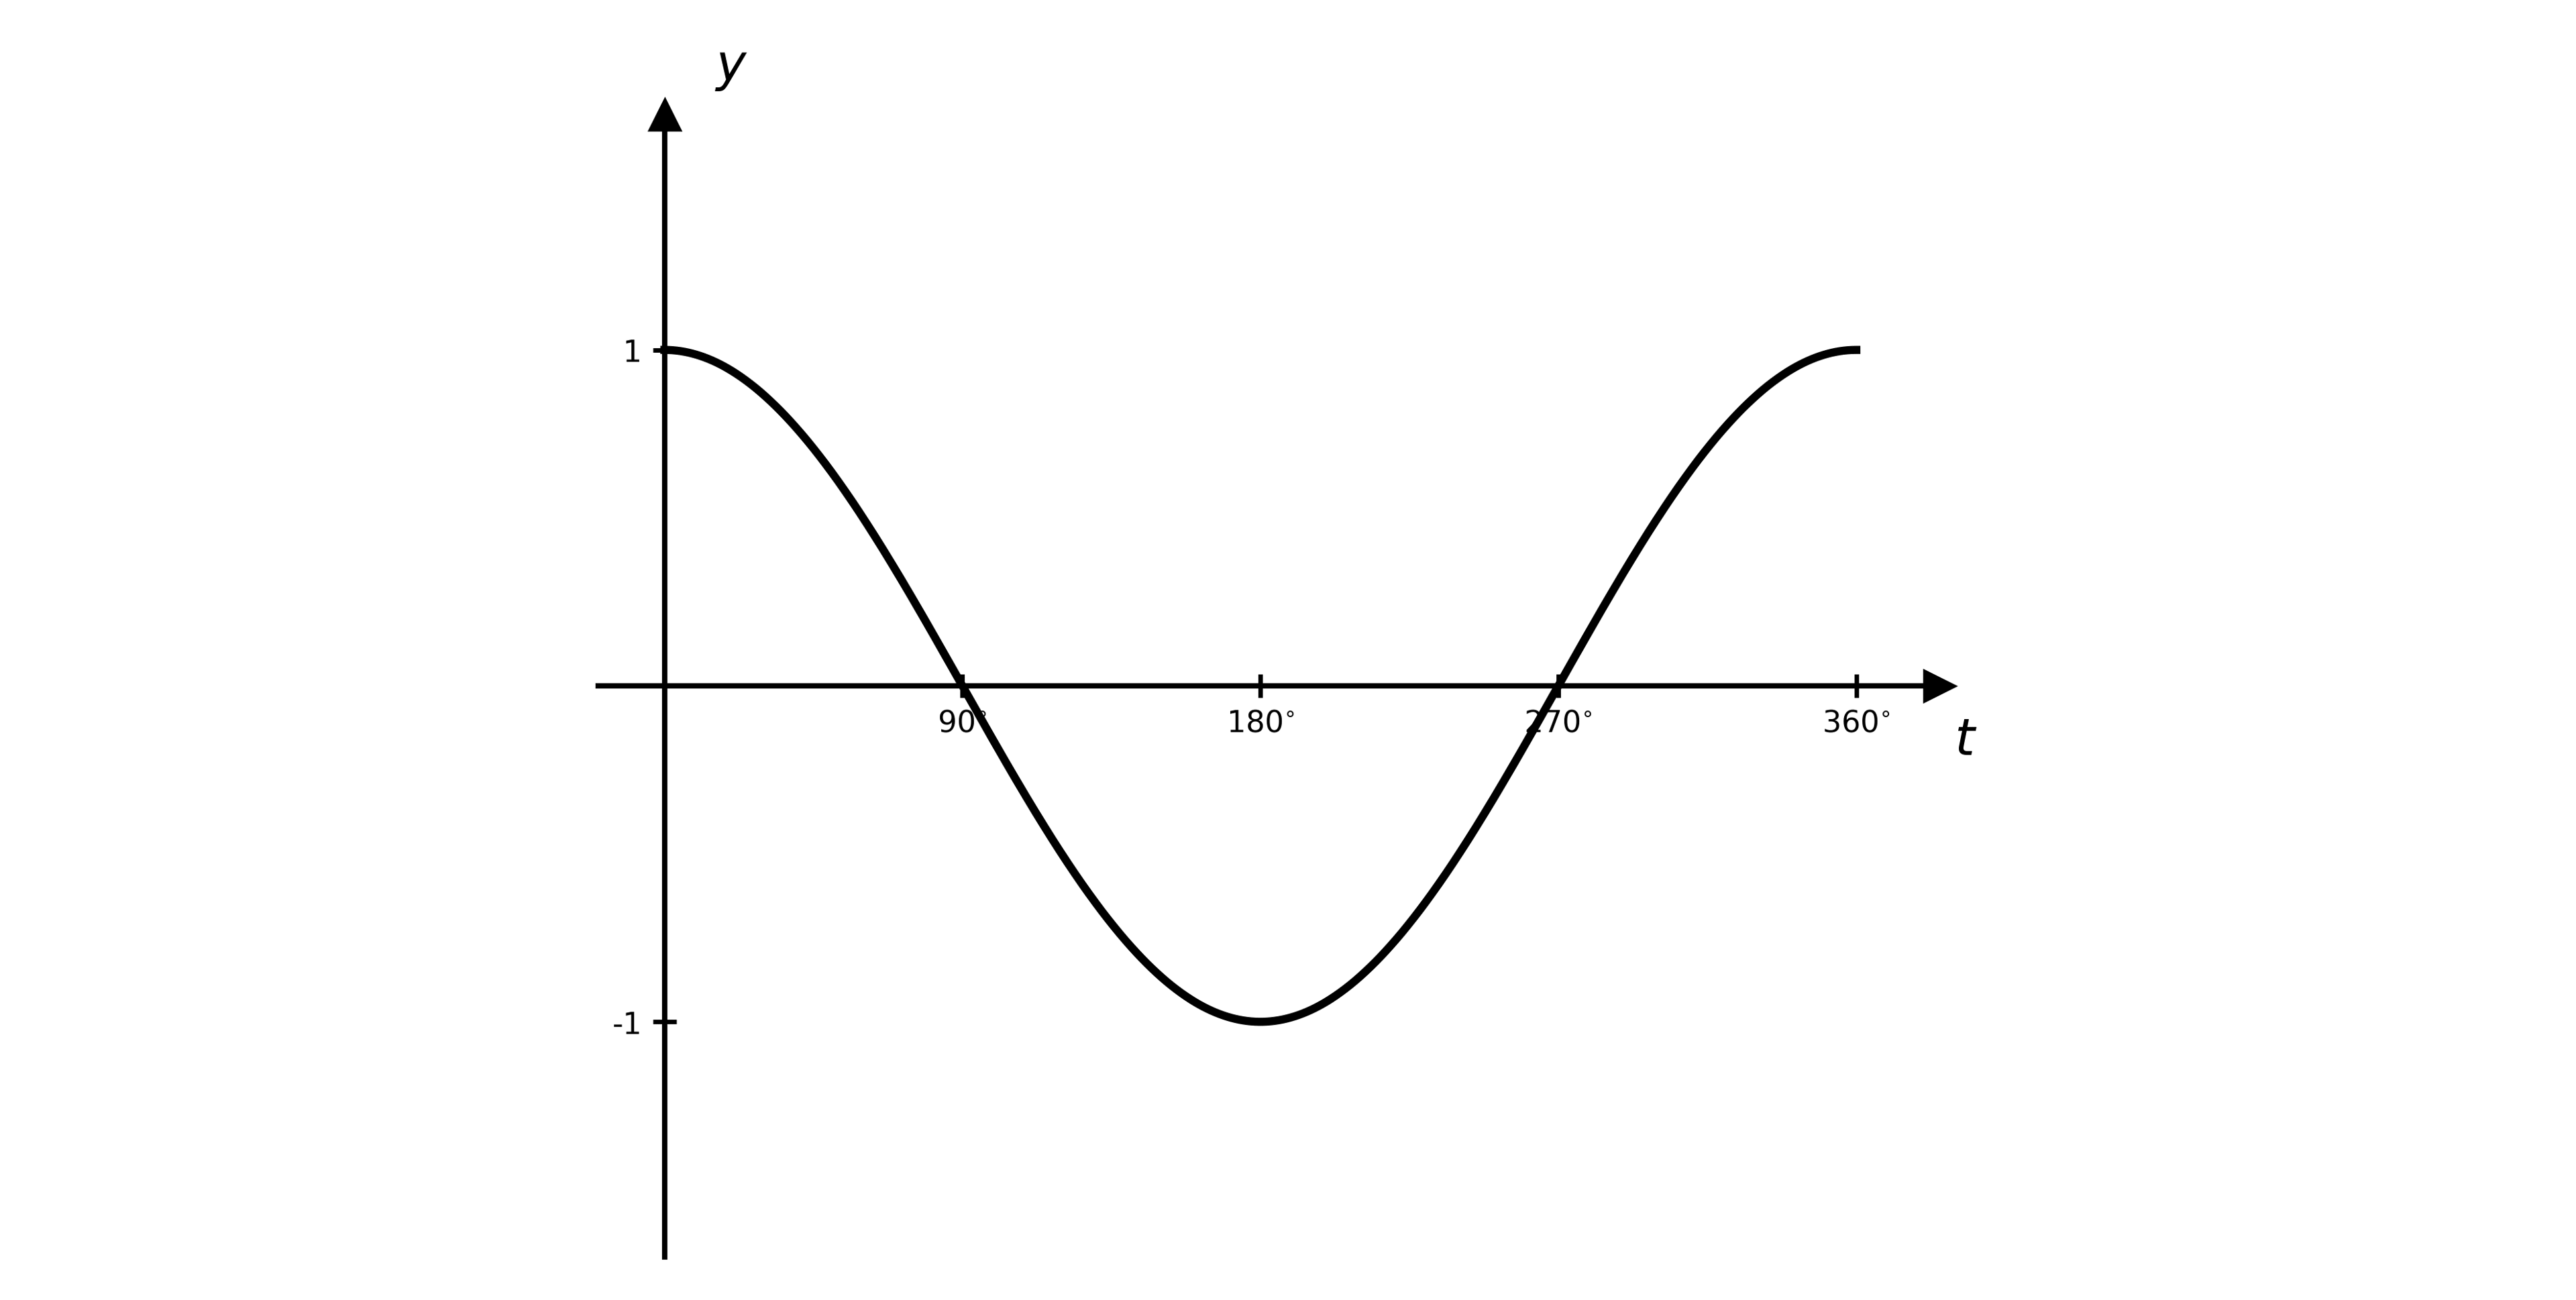
The diagram shows the graph of y=f(t), where f(t)=cost for 0°t360°.

Graph of y = cos t for t from 0 to 360 degrees: starts at (0, 1), falls through (90, 0) to a minimum (180, -1), rises through (270, 0) back to (360, 1)

(i) Write down the minimum value of f(t) in the given domain.

(ii) Write down the value of t at which this minimum occurs.

5b
2 marks

(i) Write down the minimum value of y=3f(t45°) in the given domain.

(ii) Write down the value of t at which this minimum occurs.

5c
2 marks

Describe the combination of transformations that maps the graph of y=f(t) onto the graph of y=3cost+1 for 0°t360°.

6
3 marks

The graph of y=f(x) is transformed by the following sequence of transformations, applied in this order.

  1. a reflection in the y-axis

  2. a vertical stretch with scale factor 4

  3. a translation by (02)

Write down, in terms of f(x), the equation of the resulting graph.

7
4 marks

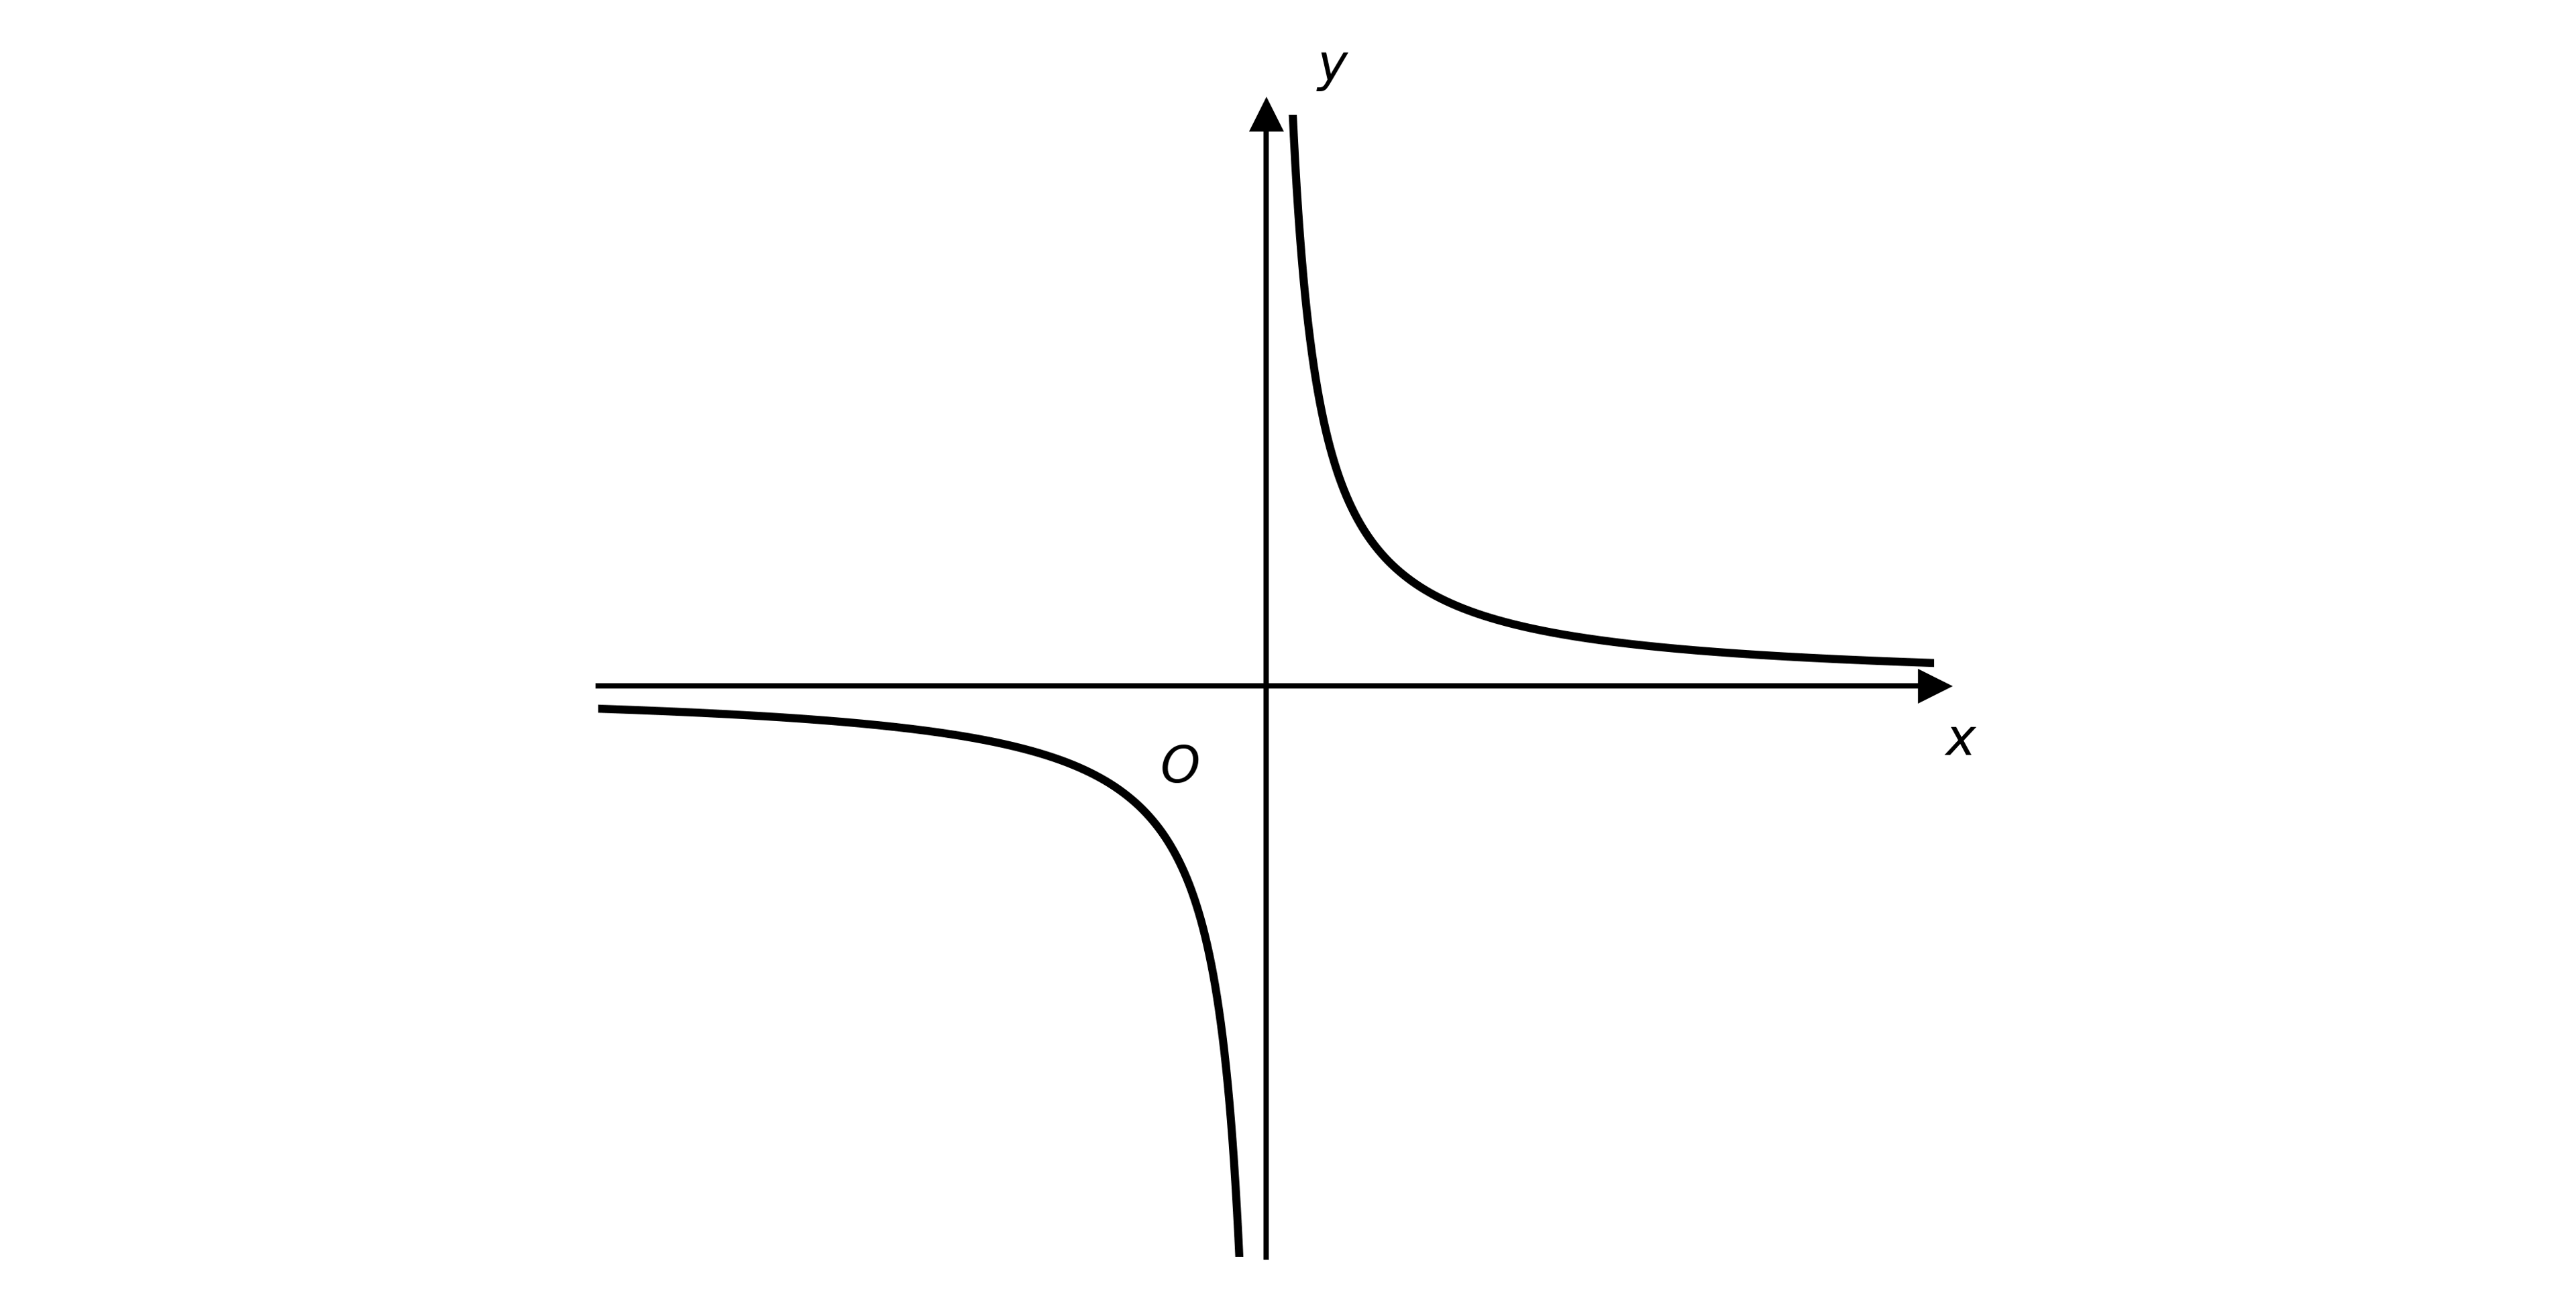
The diagram shows the graph of y=g(x), where g(x)=1x, x0.

Graph of y = 1/x with vertical asymptote x = 0 and horizontal asymptote y = 0, with branches in the first and third quadrants

(i) Write down the equations of the two asymptotes of y=g(x).

(ii) Determine the equations of the two asymptotes of the graph of y=g(x1)+5.

1
4 marks

Describe fully, in order, the sequence of transformations that maps the graph of y=f(x) onto each of the following graphs.

(i) y=3f(x)1

(ii) y=13f(x1)

2
4 marks

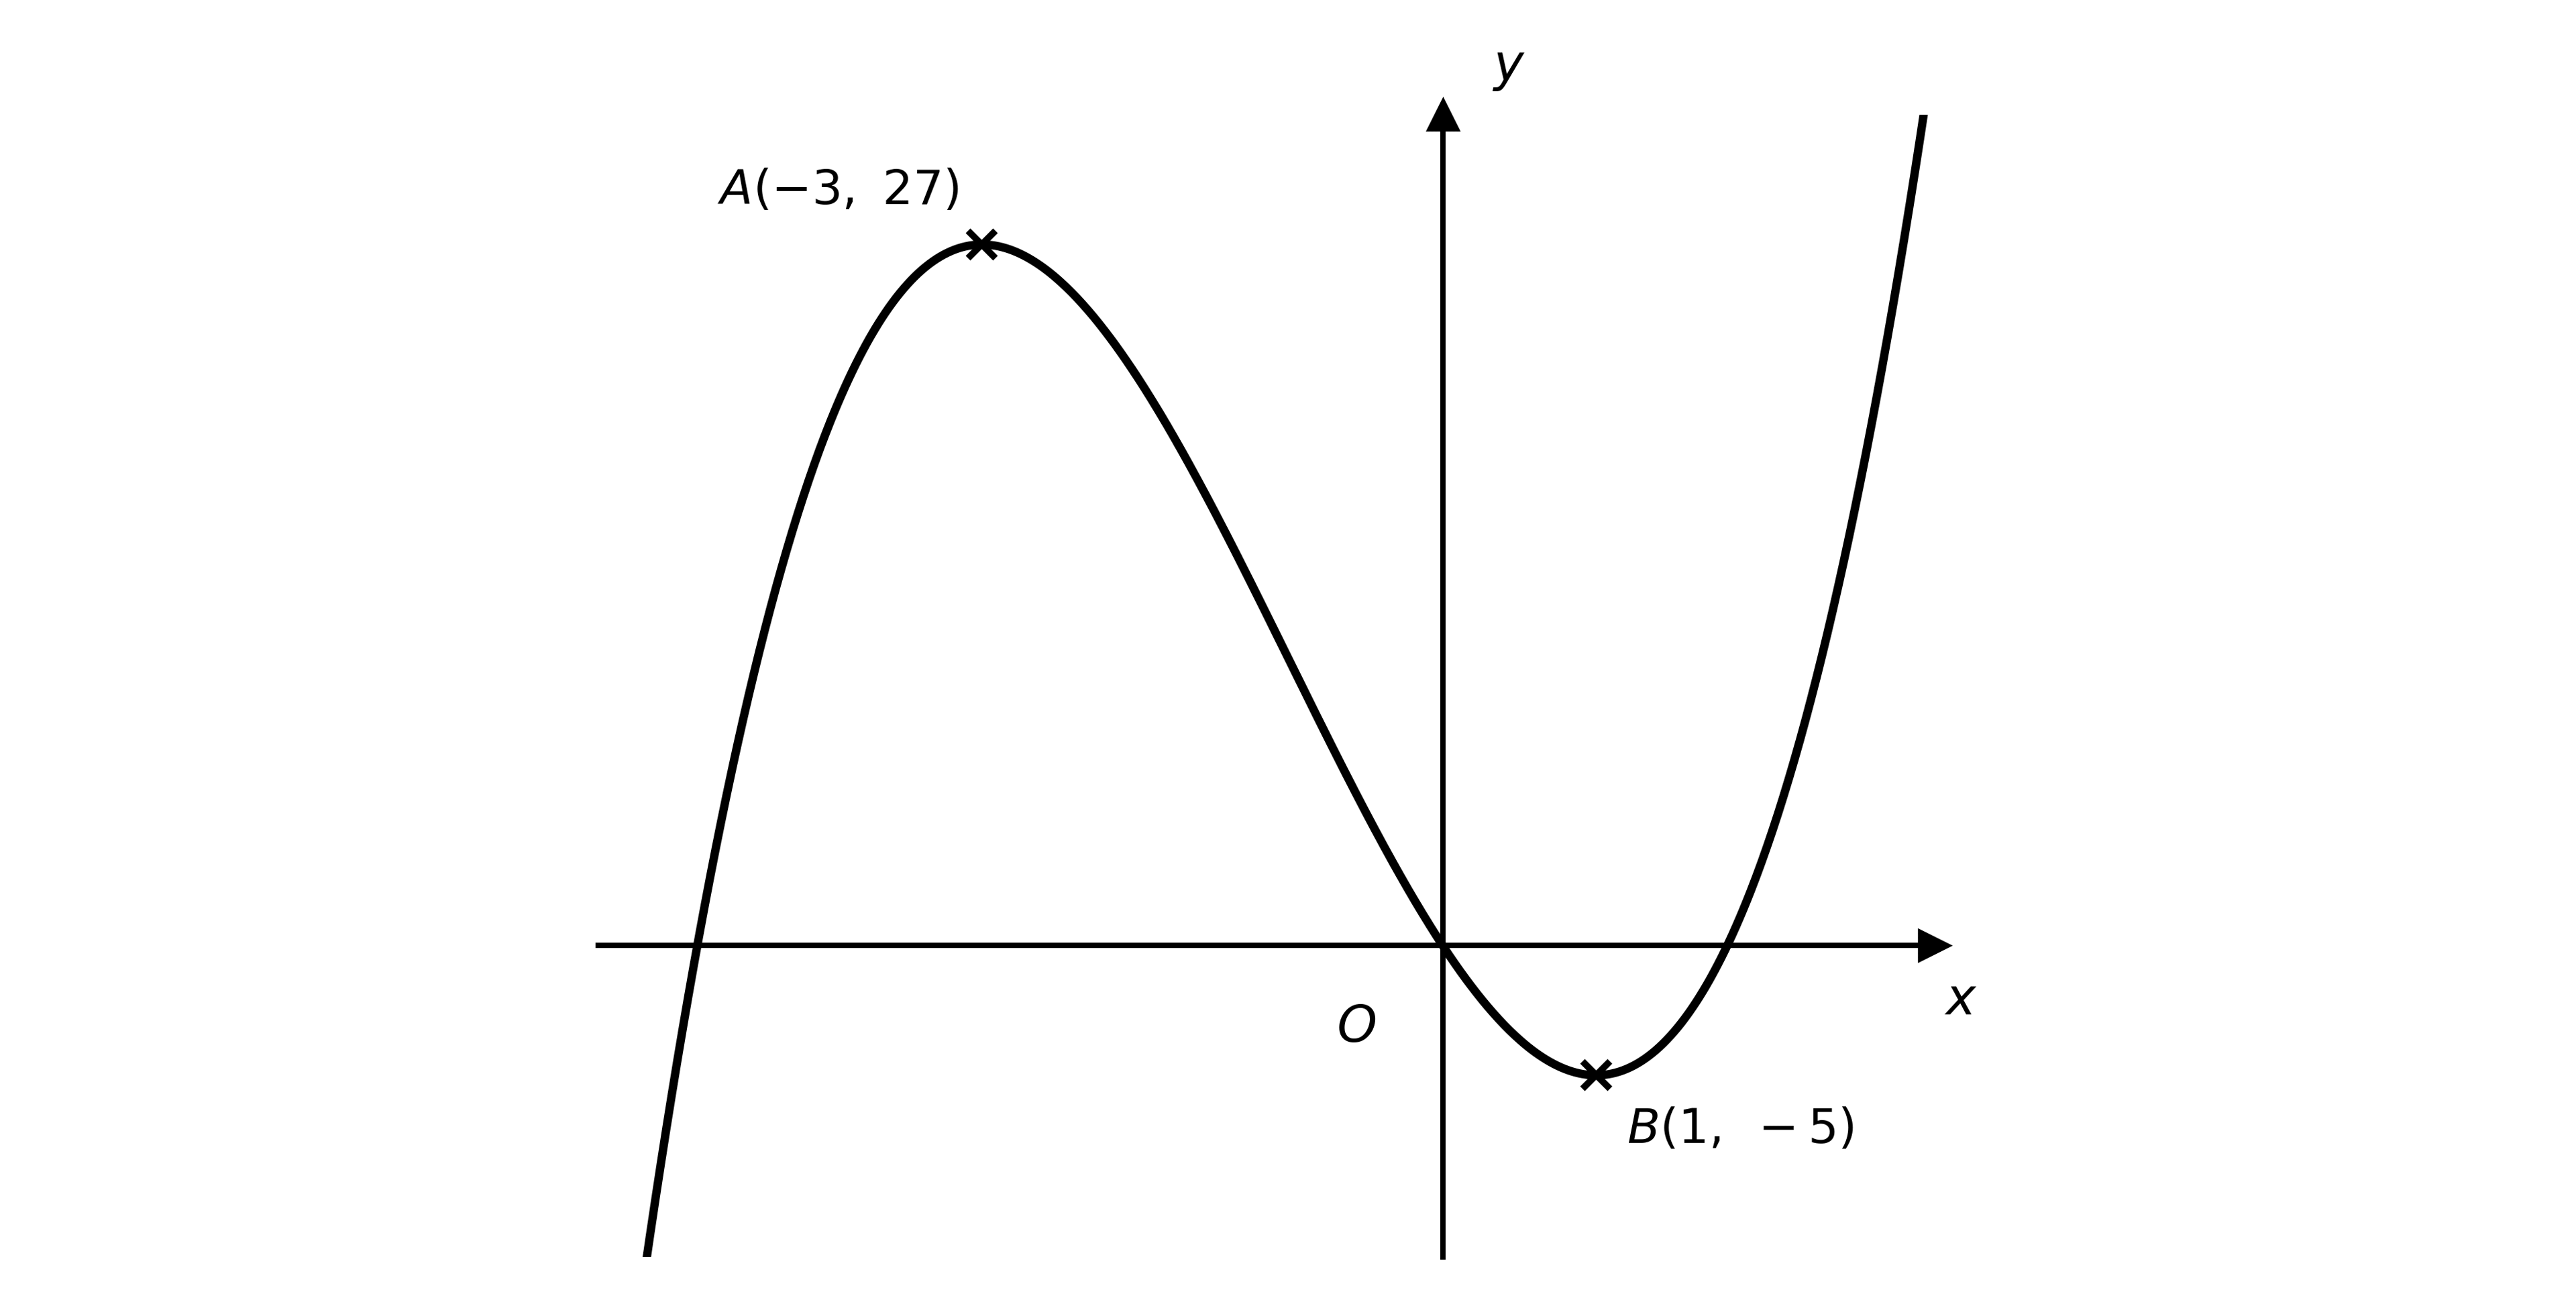
The diagram shows the graph of y=f(x). The stationary points A(3,27) and B(1,5) are marked on the diagram.

Cubic graph y = f(x) with a local maximum at A(-3, 27) and a local minimum at B(1, -5)

On separate diagrams, sketch the following graphs.

(i) y=2f(x)4

(ii) y=f(x+1)+3

On each diagram, state the coordinates of the images of A and B under the given transformation.

3
4 marks

Describe fully, in order, the sequence of transformations that maps the graph of y=f(x) onto each of the following graphs.

(i) y=3f(x+2)

(ii) y=f(x)1

4
Sme Calculator
4 marks

Given that f(x)=3x22x, find an expression for g(x), where g(x) is obtained by applying the following sequence of transformations to y=f(x), in this order.

  1. a translation by (20)

  2. a vertical stretch with scale factor 4

  3. a translation by (03)

5a
4 marks

The function p is defined by p(x)=3x4.

(i) Sketch the graph of y=p(x).

(ii) On the same axes, sketch the graph of y=p1(x), indicating the line of symmetry.

Label the coordinates of the points where each graph crosses the coordinate axes.

5b
4 marks

(i) Find an expression for p1(x).

(ii) Find an expression for 19[p(x)+16], giving your answer in its simplest form.

(iii) Hence state what the sequence of transformations represented by 19[p(x)+16] does to the graph of y=p(x).

6a
2 marks

The diagram shows the graph of y=f(x), where f(x)=(xa)2 and a>1.

Parabola y = (x - a)^2 with a > 1, meeting the y-axis at A and touching the x-axis at B

The points A and B are where the graph meets the coordinate axes.

Write down, in terms of a, the coordinates of A and B.

6b
3 marks

Sketch the graph of y=f(x), labelling the images of A and B and stating their coordinates in terms of a.

6c
Sme Calculator
1 mark

Given that A is three times as far from the origin as B, find the value of a.

7a
2 marks

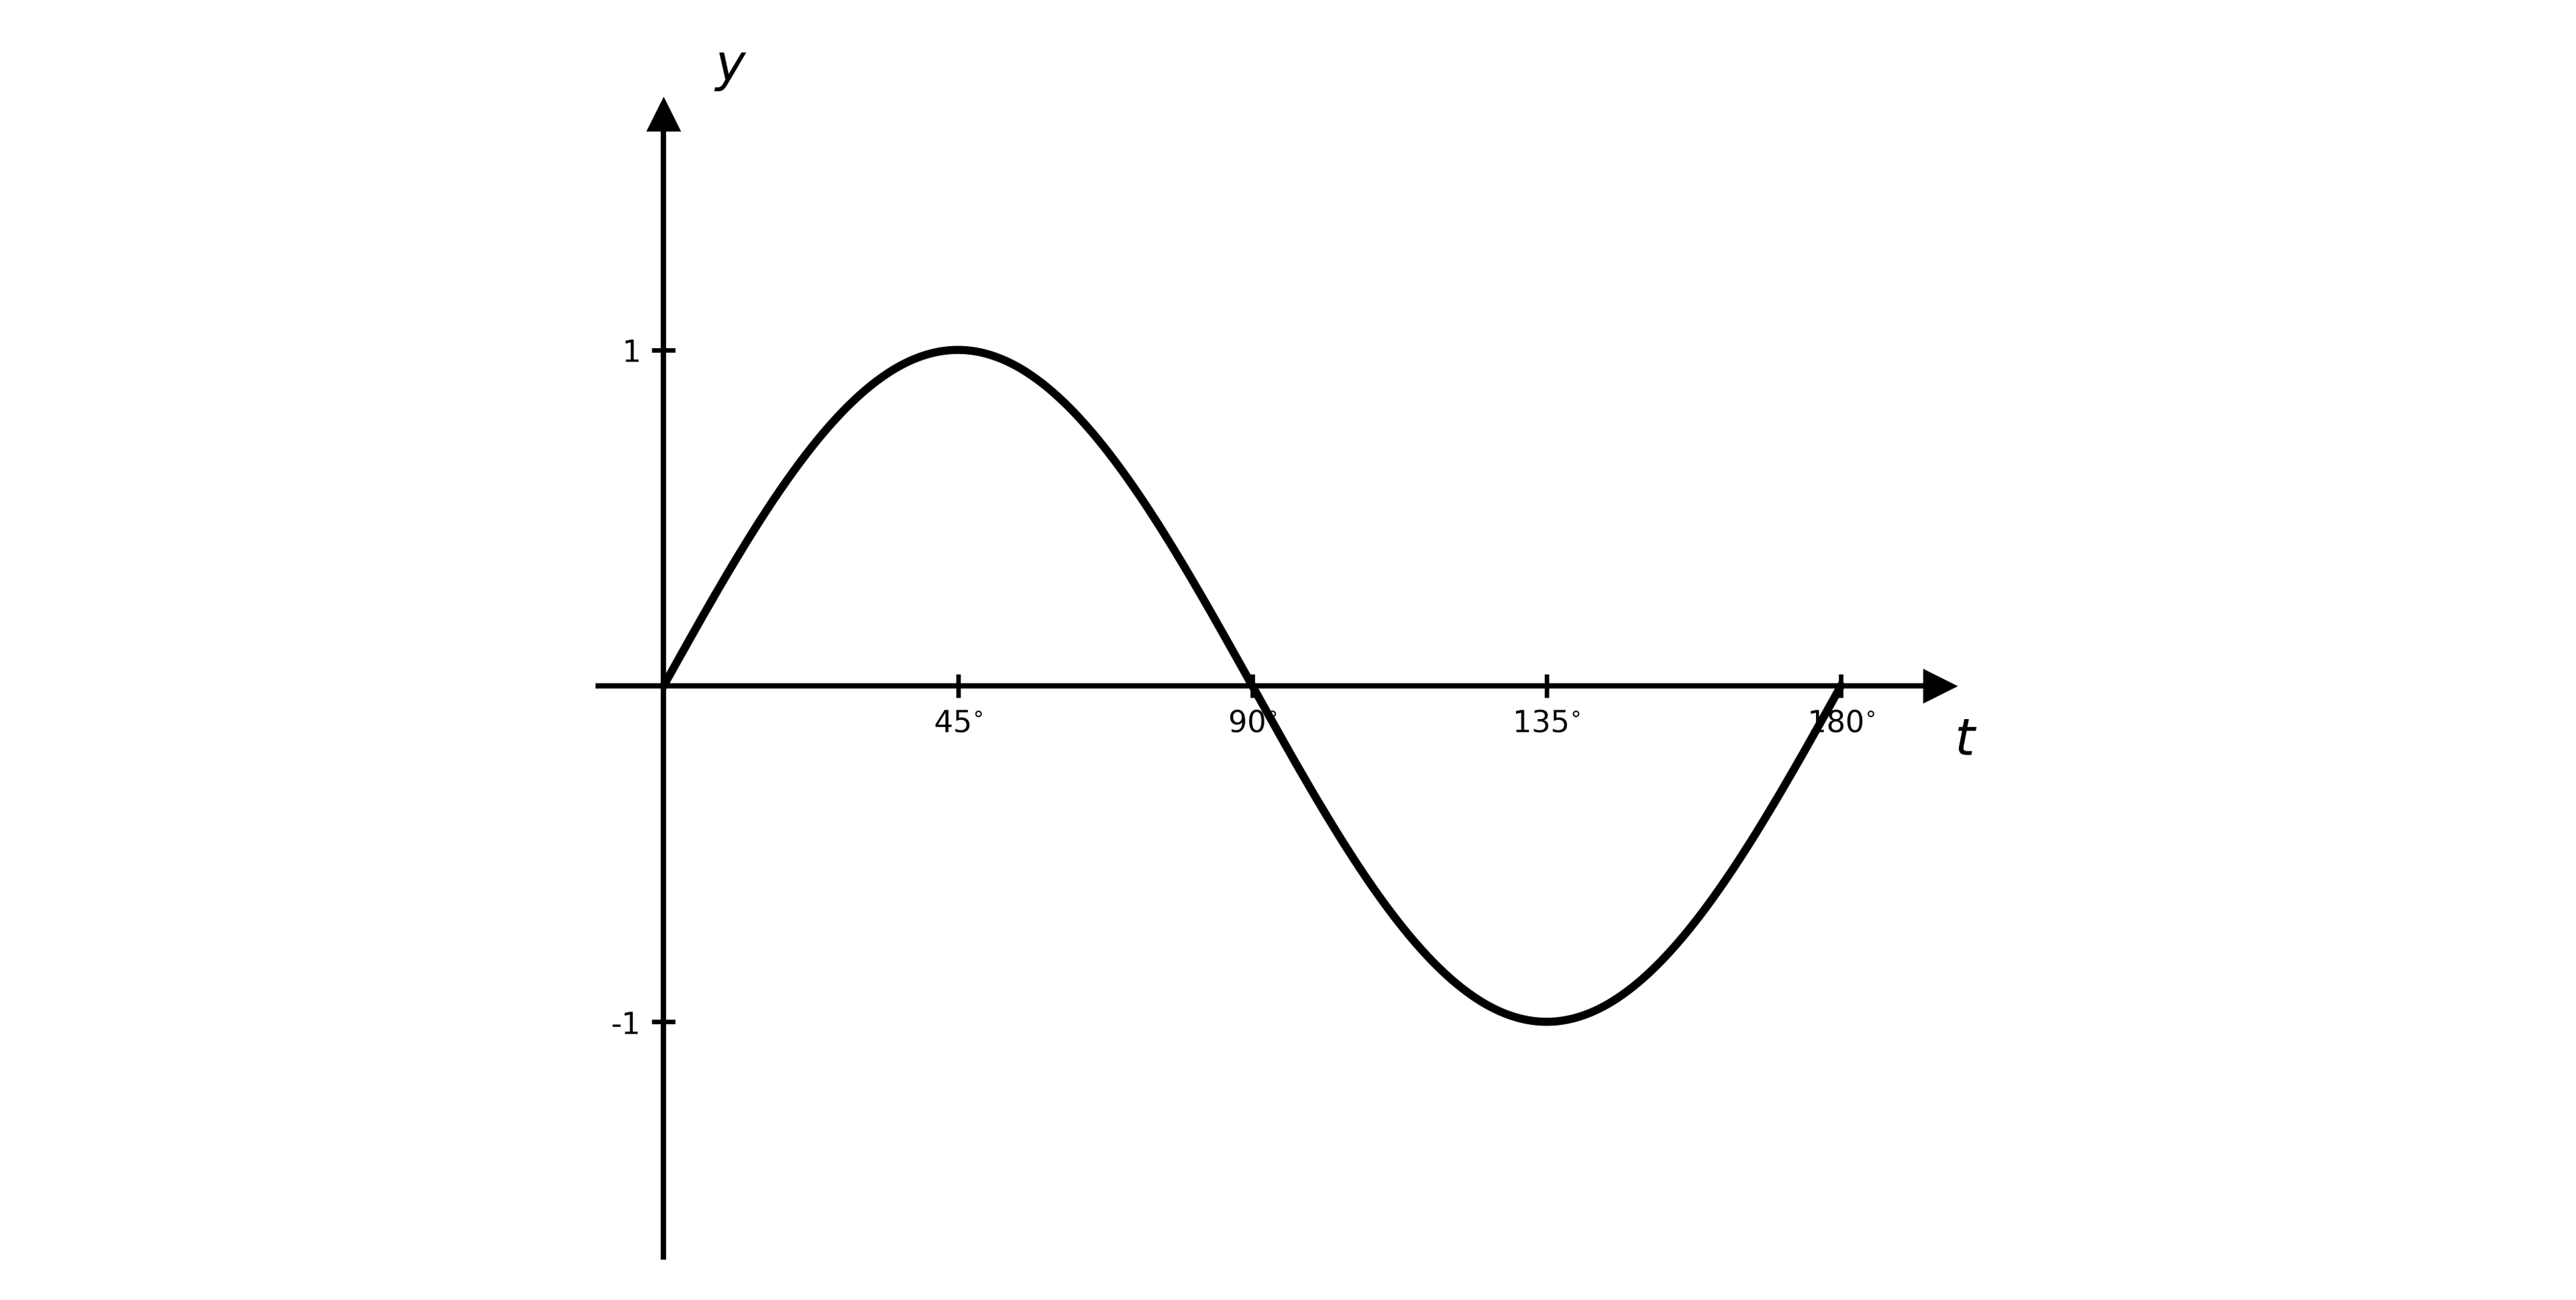
The diagram shows the graph of y=f(t), where f(t)=sin2t for 0°t180°.

Graph of y = sin 2t for t from 0 to 180 degrees: zero at 0, maximum 1 at 45, zero at 90, minimum -1 at 135, zero at 180

(i) Write down the maximum value of y=3f(t).

(ii) Write down the first value of t at which this maximum occurs.

7b
2 marks

(i) Write down the minimum value of y=5f(t+30°).

(ii) Write down the first value of t at which this minimum occurs.

7c
2 marks

Describe, in terms of f(t), the combination of transformations that maps the graph of y=f(t) onto the graph of y=2+sint for 0°t180°.

8
3 marks

The graph of y=f(x) is transformed by the following sequence of transformations, applied in this order.

  1. a horizontal stretch with scale factor 2

  2. a reflection in the x-axis

  3. a translation by (02)

Write down, in terms of f(x), the equation of the resulting graph.

9
4 marks

The graph of y=f(x) is transformed by the following sequence of transformations, applied in this order.

  1. a translation by (20)

  2. a reflection in the y-axis

  3. a vertical stretch with scale factor 23

  4. a translation by (04)

Write down, in terms of f(x), the equation of the resulting graph.

1
6 marks

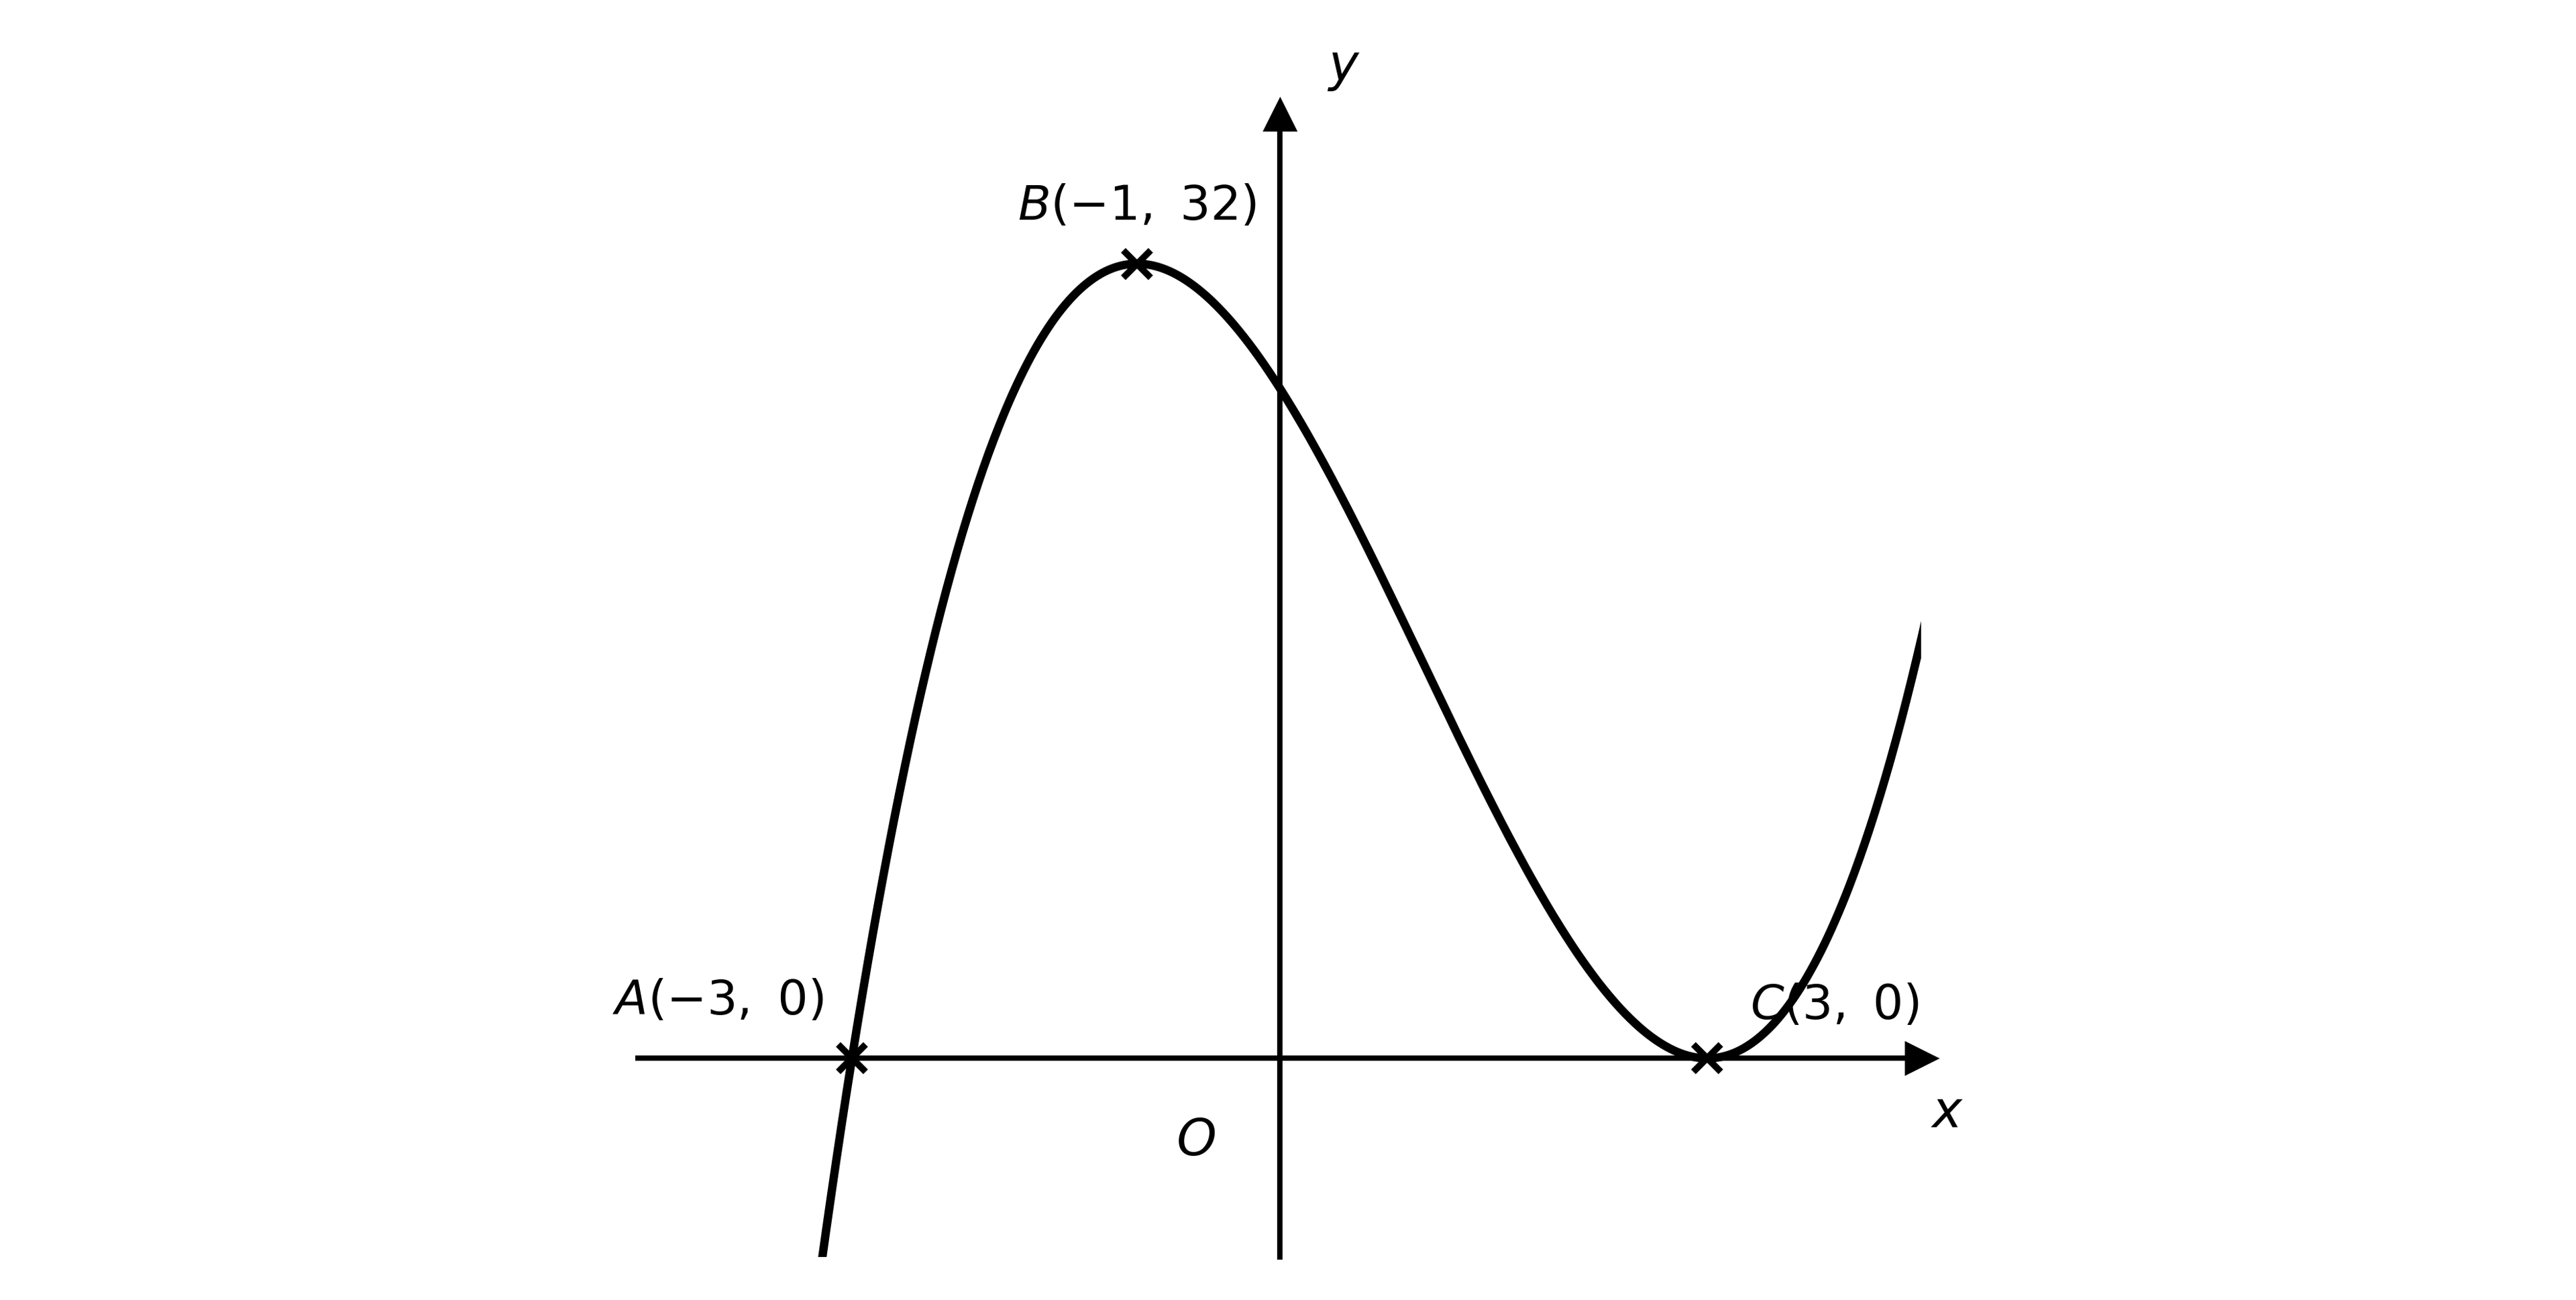
The diagram shows the graph of y=f(x). The maximum point B(1,32) and the x-axis intercepts A(3,0) and C(3,0) are marked on the diagram.

Cubic graph y = f(x) crossing the x-axis at A(-3, 0), rising to a maximum at B(-1, 32), then falling to touch the x-axis at C(3, 0) before rising

On separate diagrams, sketch the following graphs.

(i) y=f(12x)+2

(ii) y=f(x1)

On each diagram, mark the coordinates of the images of the points A, B and C under the given transformation.

2
6 marks

Describe fully, in order, the sequence of transformations that maps the graph of y=f(x) onto each of the following graphs.

(i) y=f(3x1)

(ii) y=2f(5x)

3
4 marks

The function f is defined by f(x)=2x+1. Find an expression for g(x), where g(x) is obtained by applying the following sequence of transformations to y=f(x), in this order.

  1. a translation by [30]

  2. a horizontal stretch with scale factor 12

  3. a reflection in the x-axis

4a
3 marks

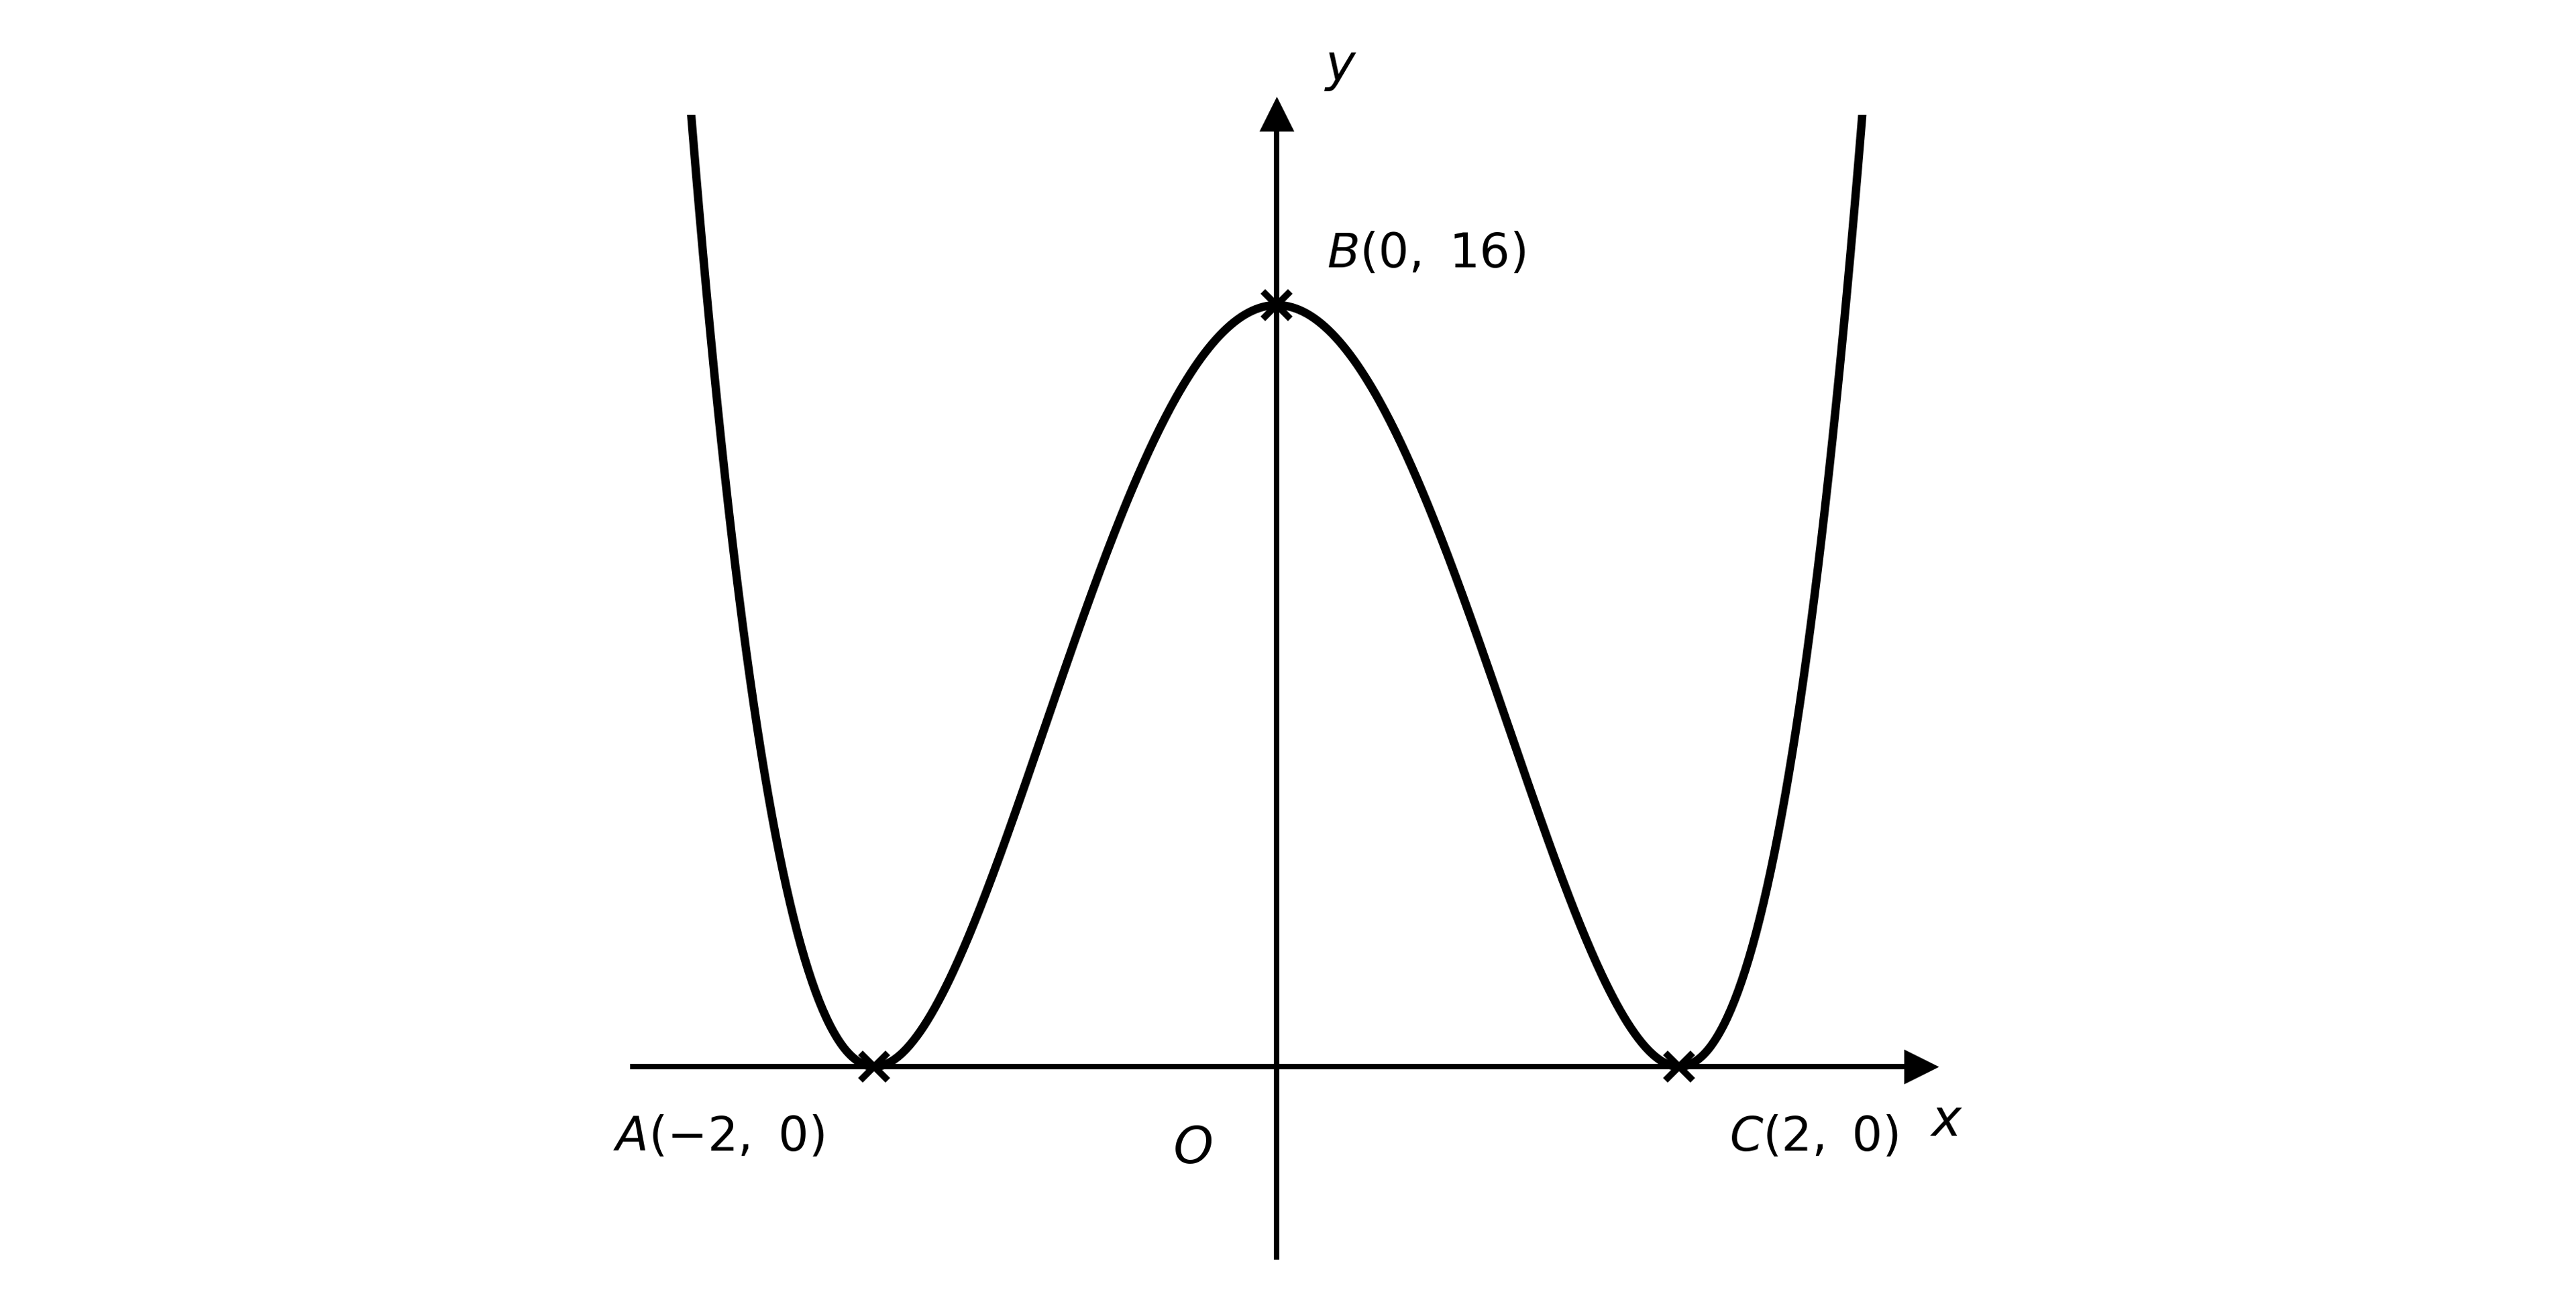
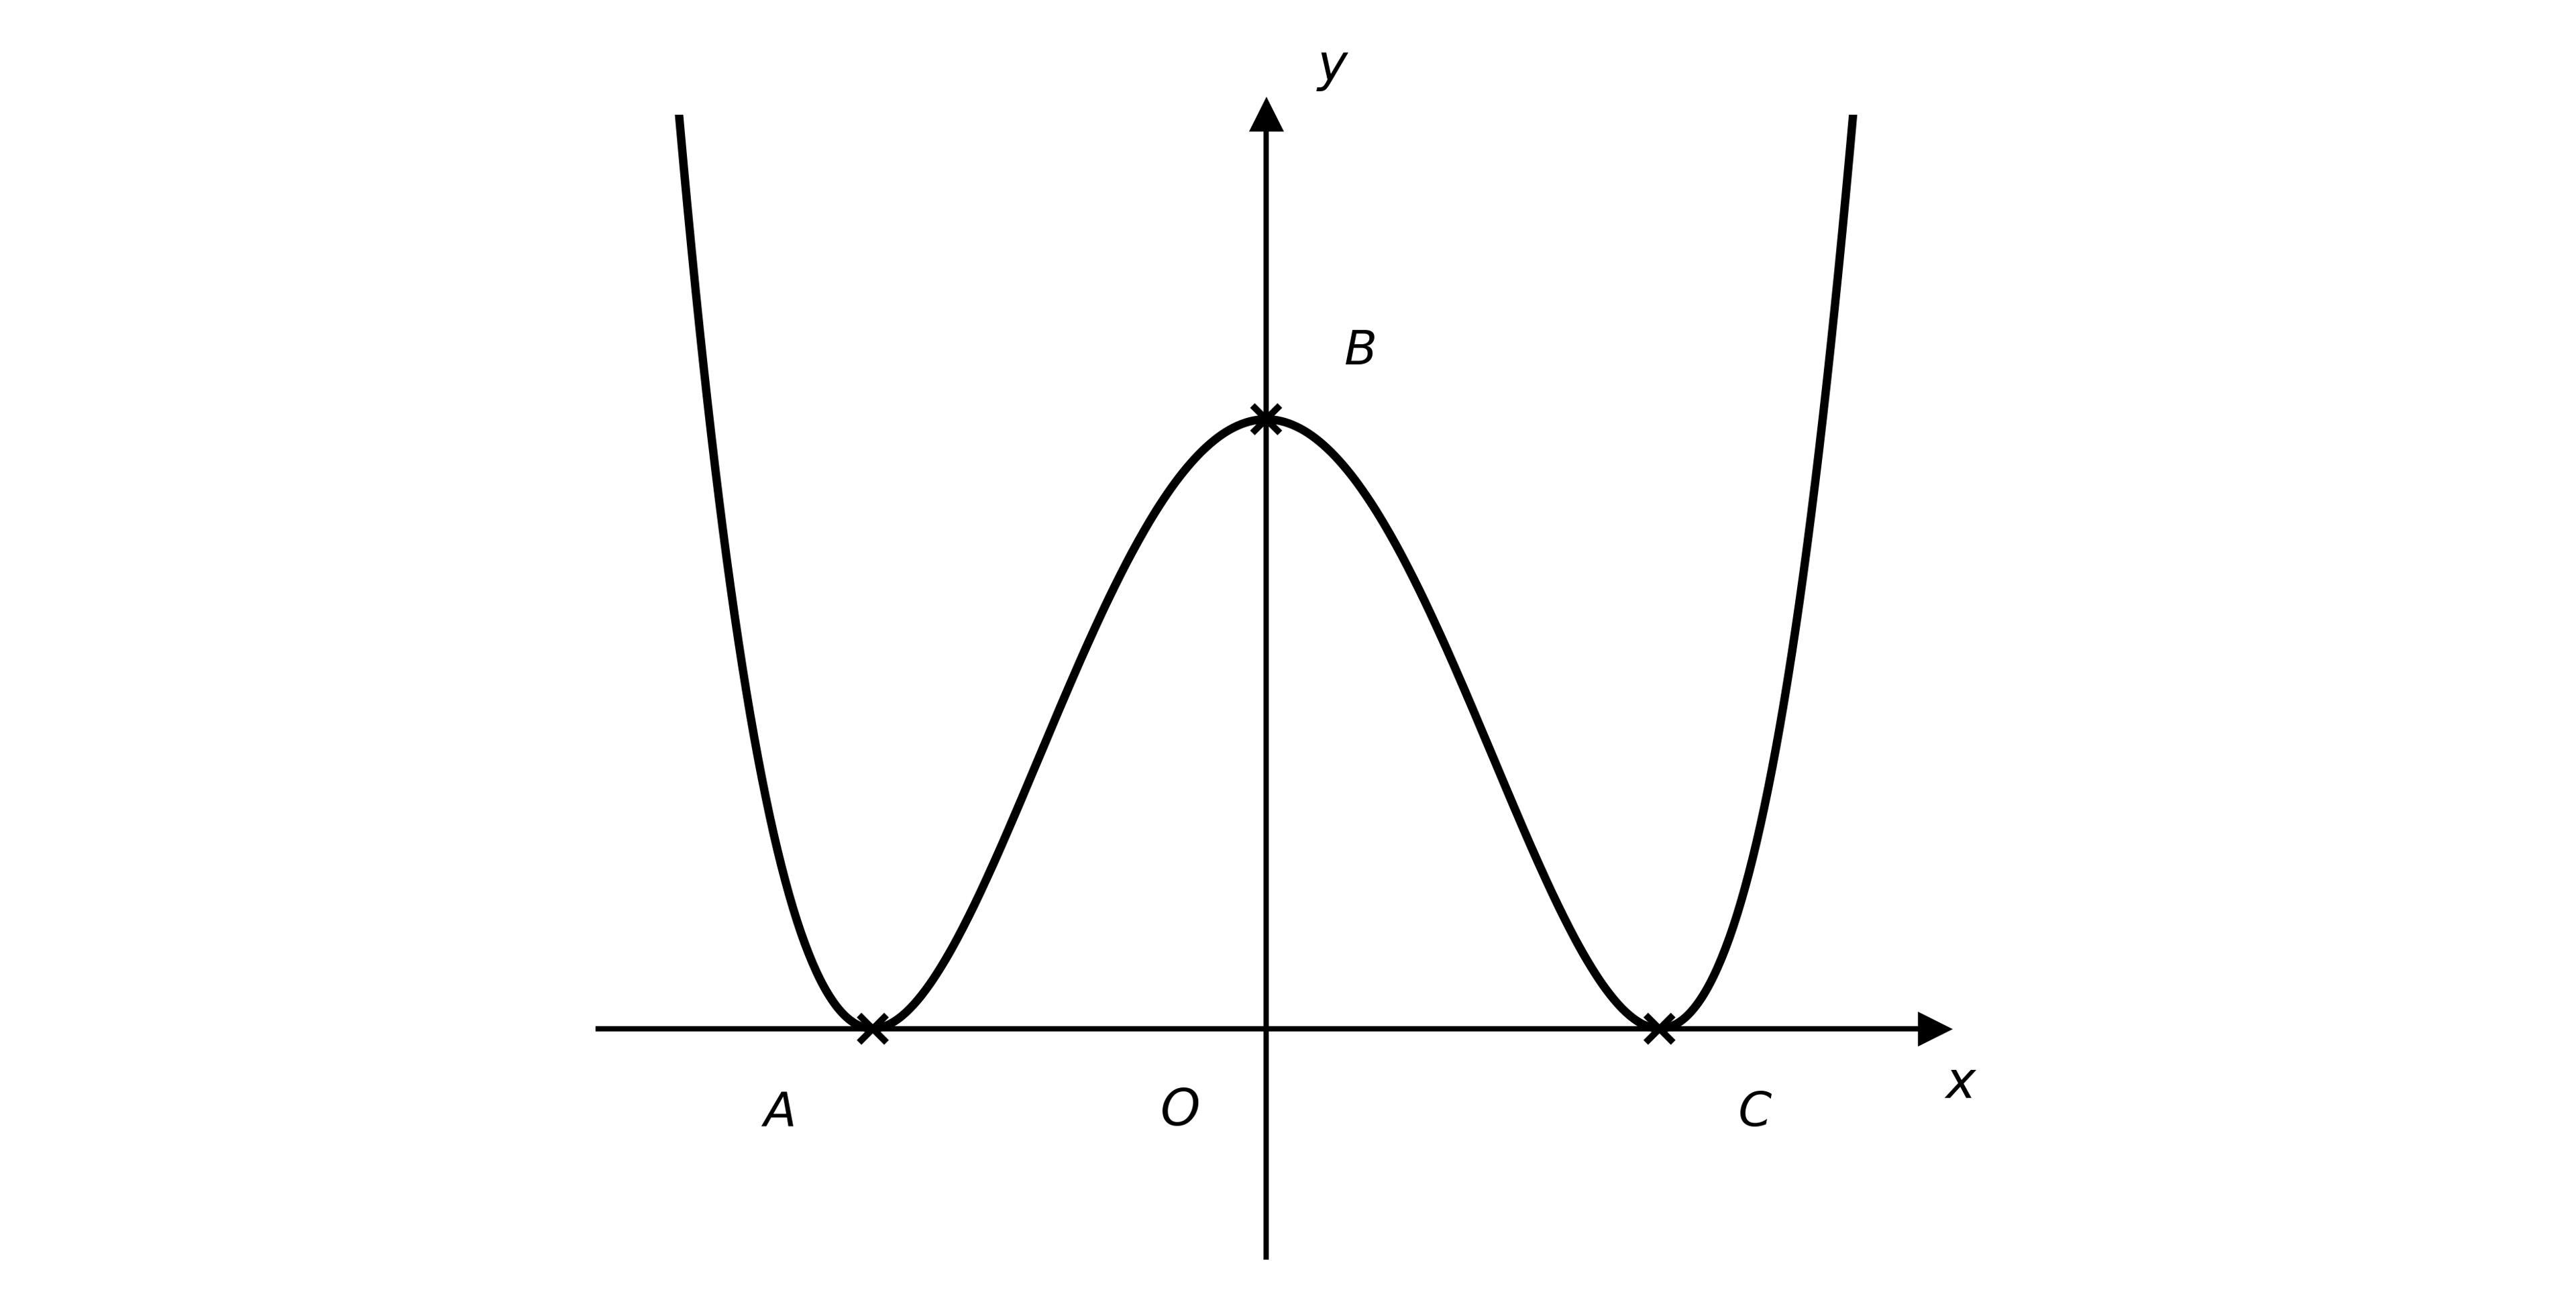
The diagram shows the graph of y=f(x), where f(x)=(x24)2.

W-shaped quartic y = (x^2 - 4)^2 touching the x-axis at A(-2, 0) and C(2, 0), with a local maximum at B(0, 16)

The points A(2,0), B(0,16) and C(2,0) are where the graph meets the coordinate axes.

Sketch the graph of y=3f(2x), labelling the images of A, B and C.

4b
2 marks

Suggest a combination of at least two transformations that maps A, B and C so that none of them lies on a coordinate axis. Give your answer as an expression in terms of f(x).

5a
2 marks

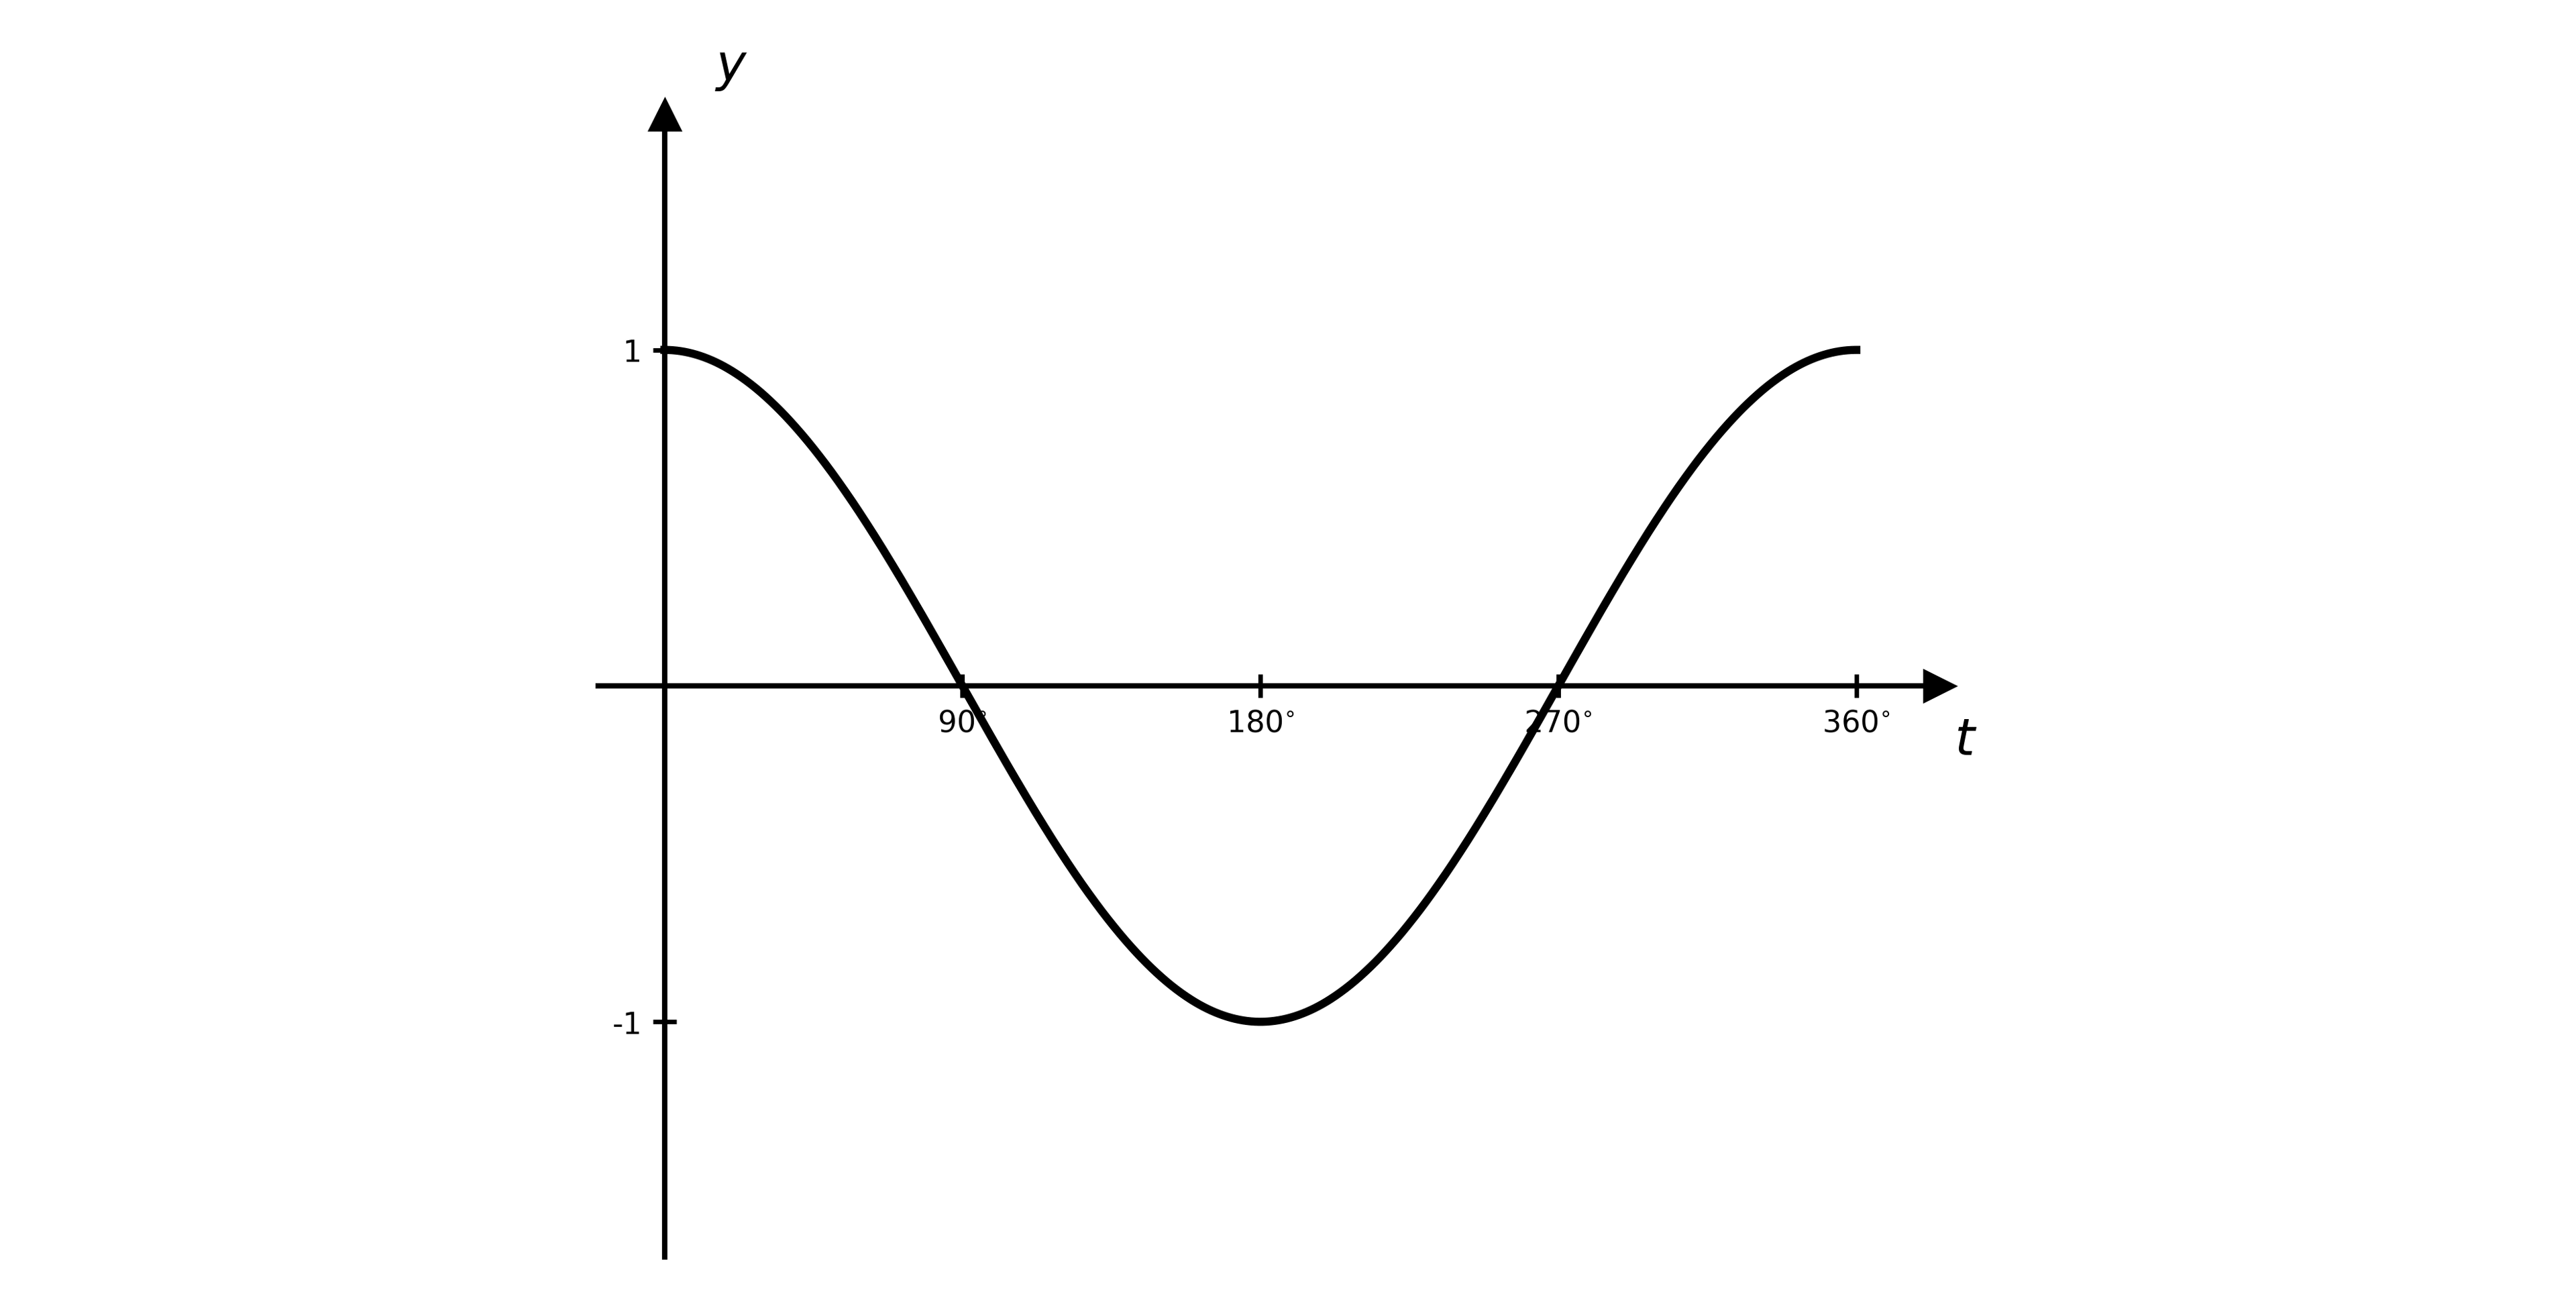
The diagram shows the graph of y=f(t), where f(t)=cost for 0°t360°.

Graph of y = cos t for t from 0 to 360 degrees, from (0,1) down to a minimum (180,-1) and back to (360,1)

(i) Write down the maximum value of y=2f(3t).

(ii) Write down the value of t at which this maximum first occurs.

5b
2 marks

Find, in terms of f(t), a combination of transformations that maps the graph of y=f(t) onto the graph of y=24sint for 0°t360°.

6a
5 marks

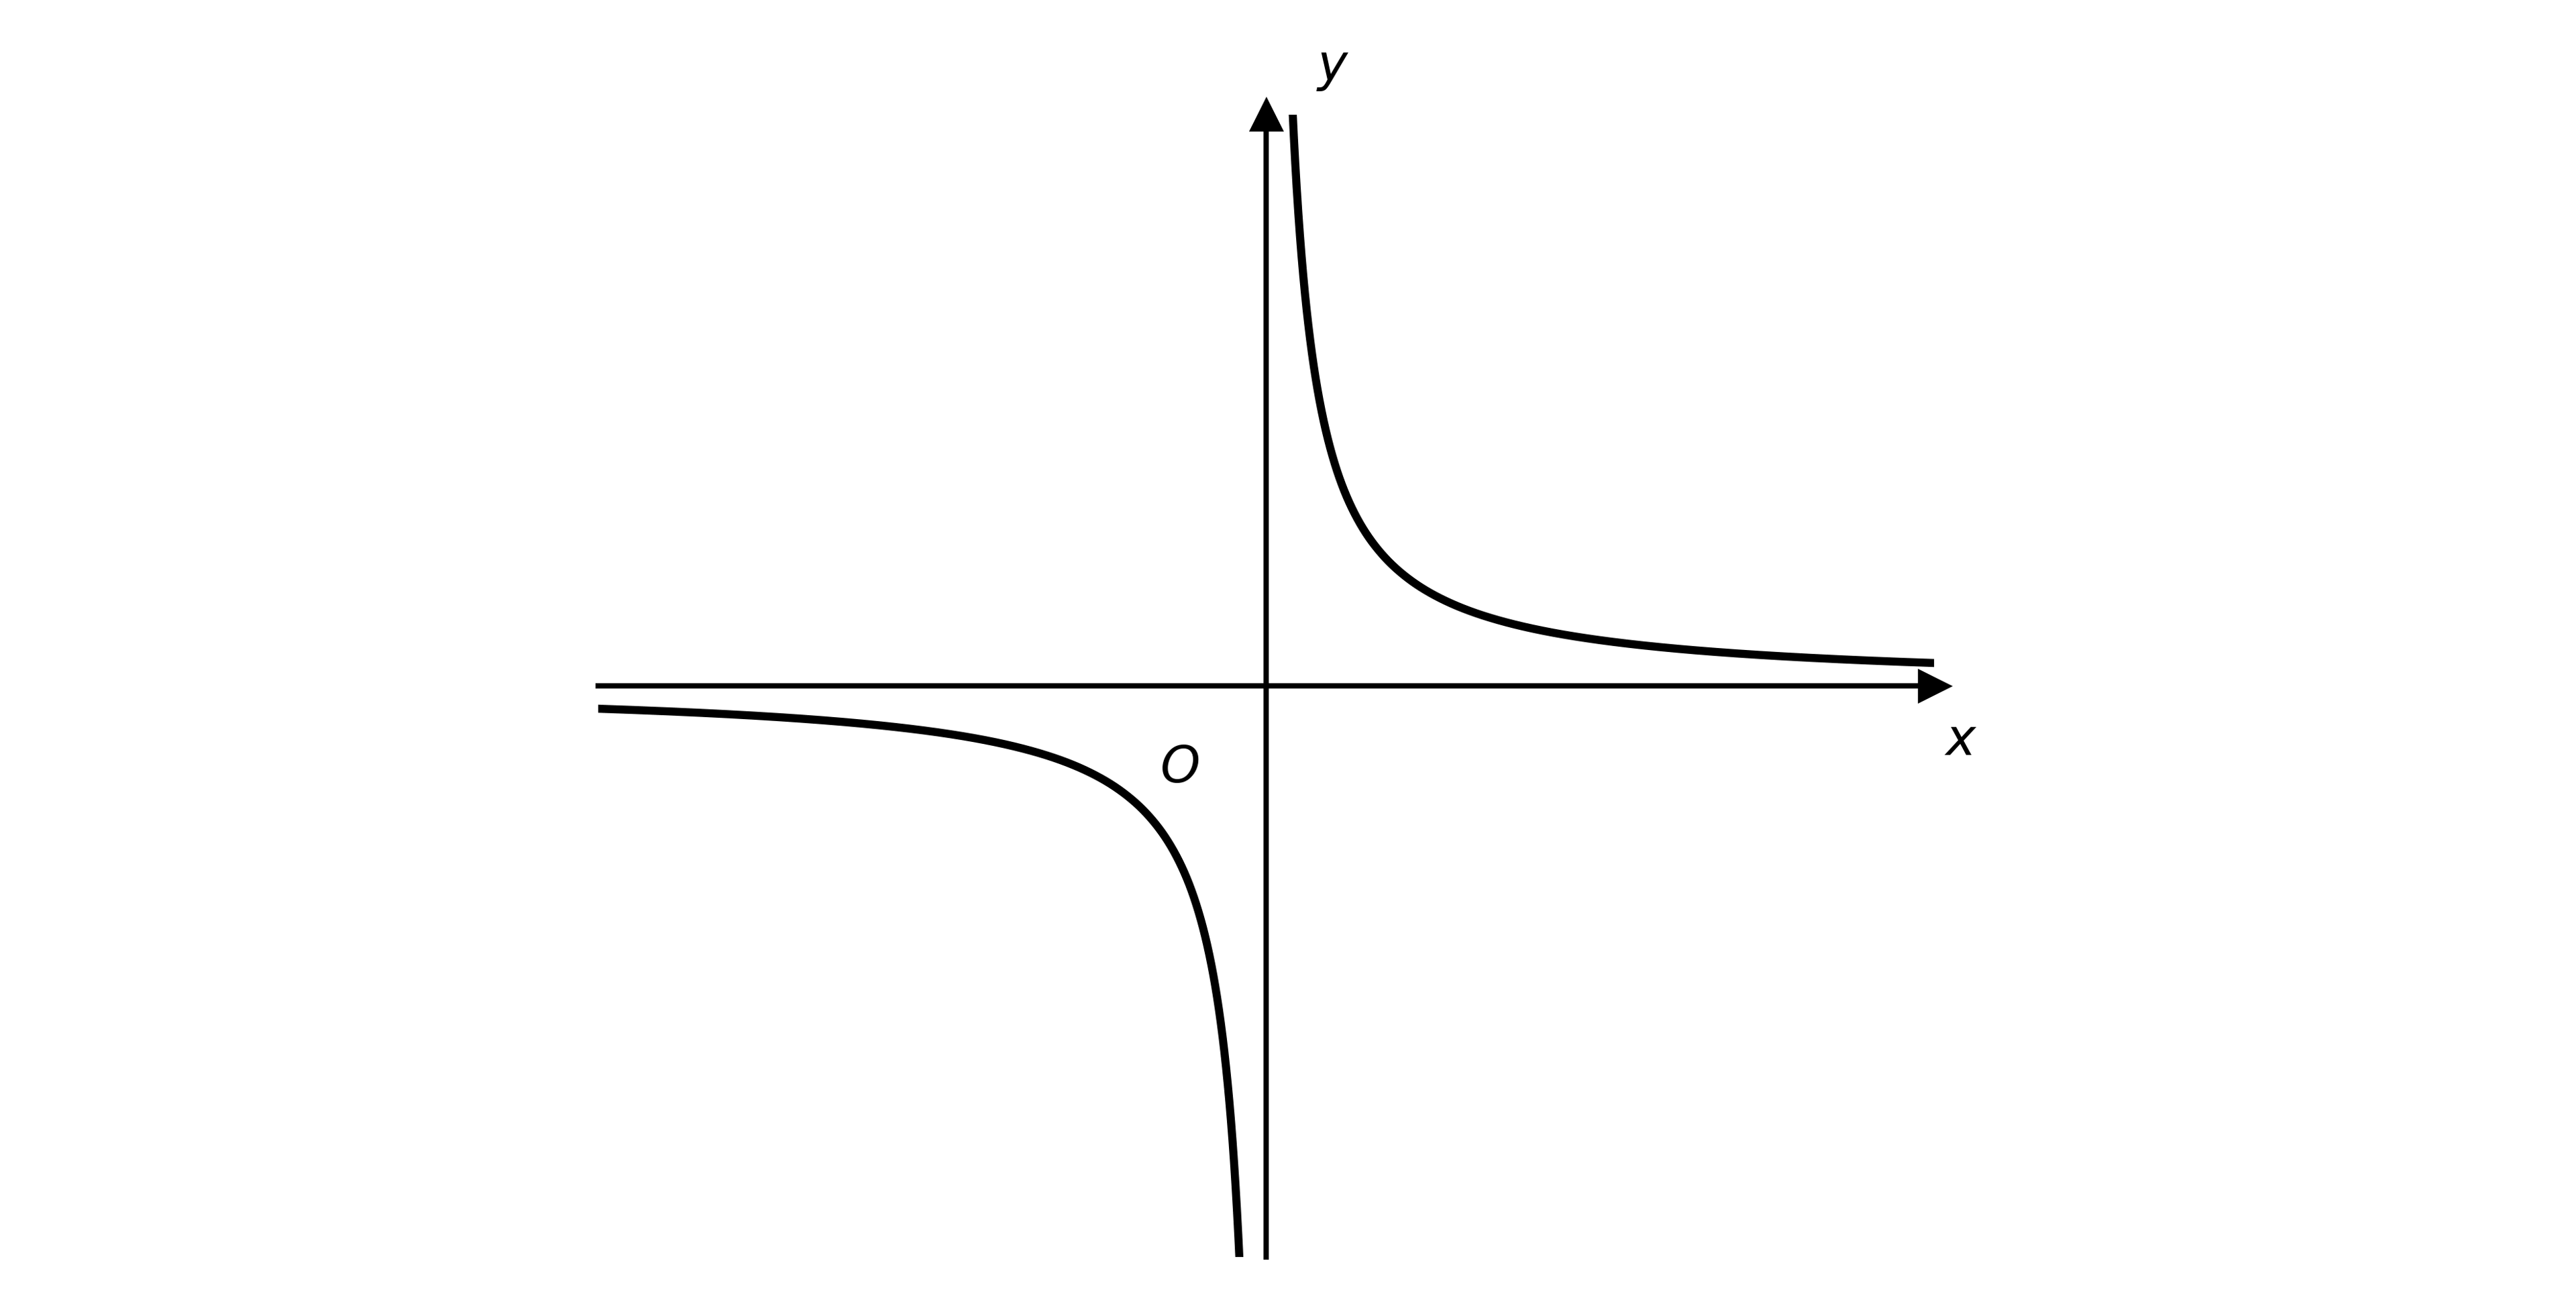
The diagram shows the graph of y=g(x), where g(x)=1ax, with a a non-zero constant.

Graph of y = 1/(ax) with vertical asymptote x = 0 and horizontal asymptote y = 0

(i) Write down the equations of the asymptotes of y=g(x).

(ii) Determine the equations of the asymptotes of the graph of y=3g(2x+1).

6b
3 marks

The function f is defined by f(x)=2g(13x+3)4. Determine the domain and range of f.

7
4 marks

The function p is defined by p(x)=2x+1.

Show that the graph of y=p(x) maps onto the graph of its inverse under the transformation 12p(12x)1.

1
6 marks

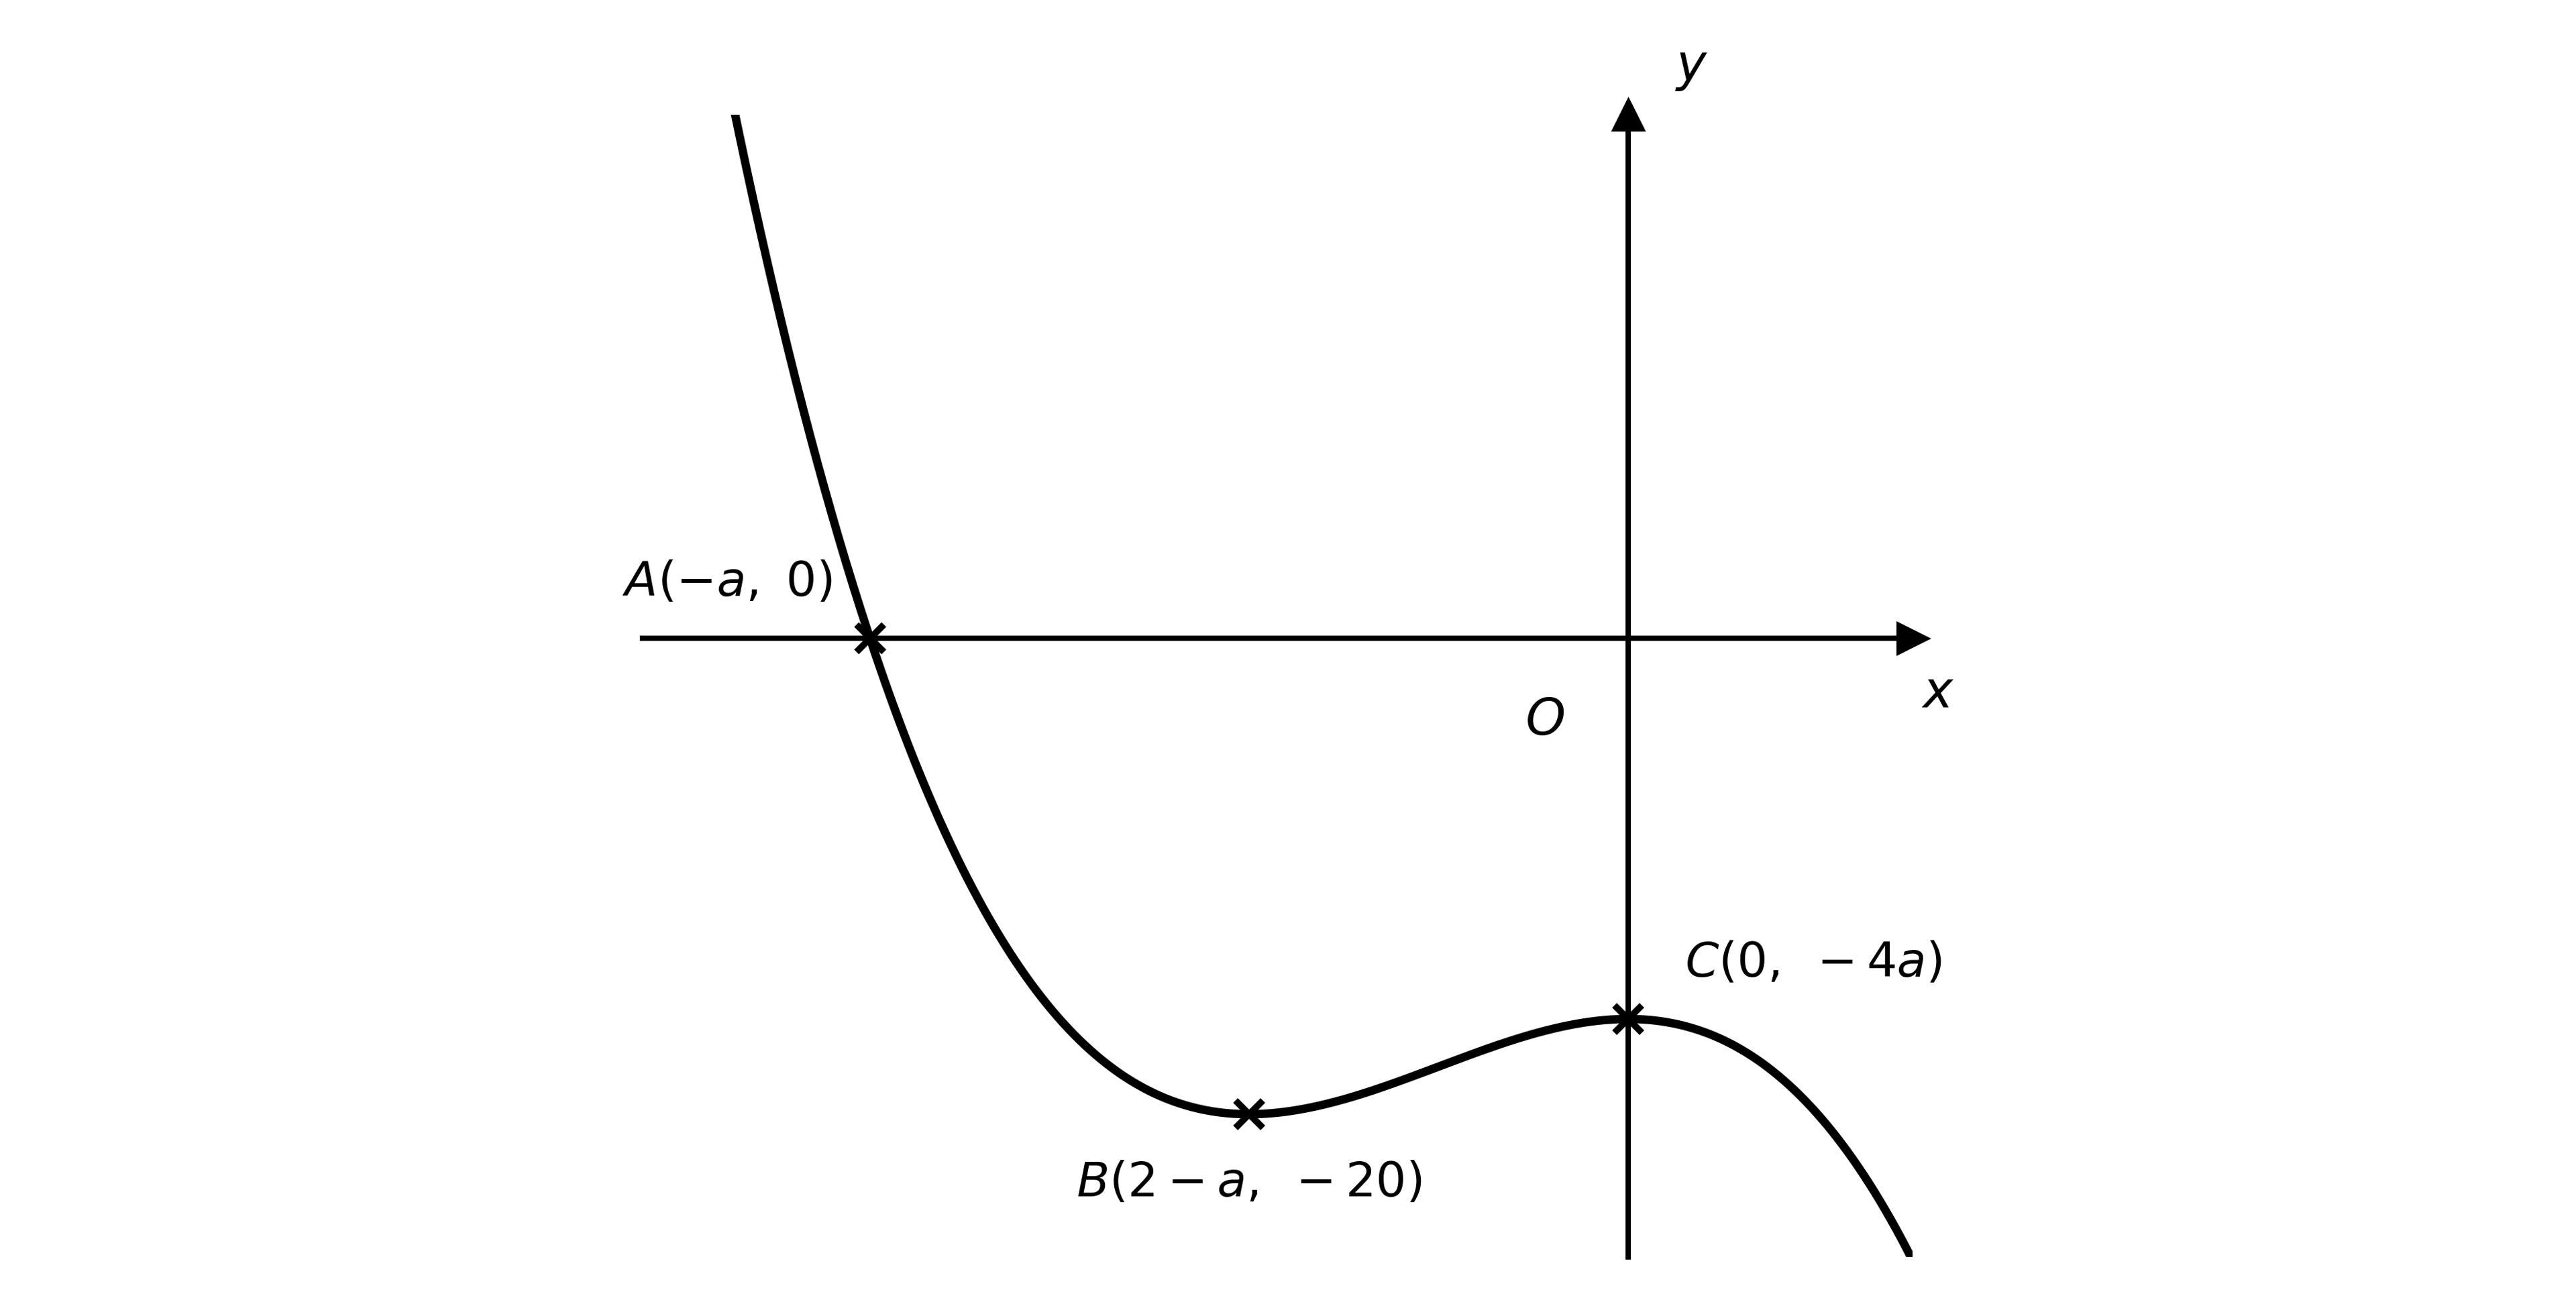
The diagram shows the graph of y=f(x), where a is a positive constant. The maximum point C(0,4a), the minimum point B(2a,20) and the x-axis intercept A(a,0) are marked on the diagram.

Negative cubic y = f(x) crossing the x-axis at A(-a, 0), falling to a minimum B(2-a, -20), rising to a maximum C(0, -4a) on the y-axis, then falling

On separate diagrams, sketch the following graphs, marking the coordinates of the images of A, B and C in terms of a.

(i) y=2f(13x1)

(ii) y=2f(x+1)+1

2a
5 marks

Describe, in order, a sequence of transformations that maps the graph of y=f(x) onto each of the following graphs.

(i) y=af(x+b)+c, for the case when a>0

(ii) y=f(x)

2b
2 marks

How, if at all, would your answer to part (a)(i) change if a=1, or if a<0?

3
4 marks

A function f is defined by f(x)=kx, where k is a non-zero constant.

Show that f1(x)=1kf(1kx).

4a
2 marks

The diagram shows the graph of y=f(x), where f(x)=(x2a)2 and a>1. The points A, B and C are where the graph meets the coordinate axes.

W-shaped quartic y = (x^2 - a)^2 touching the x-axis at A and C, with a local maximum at B on the y-axis

Write down, in terms of a, the coordinates of A, B and C.

4b
3 marks

Sketch the graph of y=12f(x1), labelling the images of A, B and C and stating their coordinates in terms of a.

4c
2 marks

Suggest, in terms of f(x), a combination of at least two transformations for which A, B and C move to new positions but each remains on its original axis.

5a
2 marks

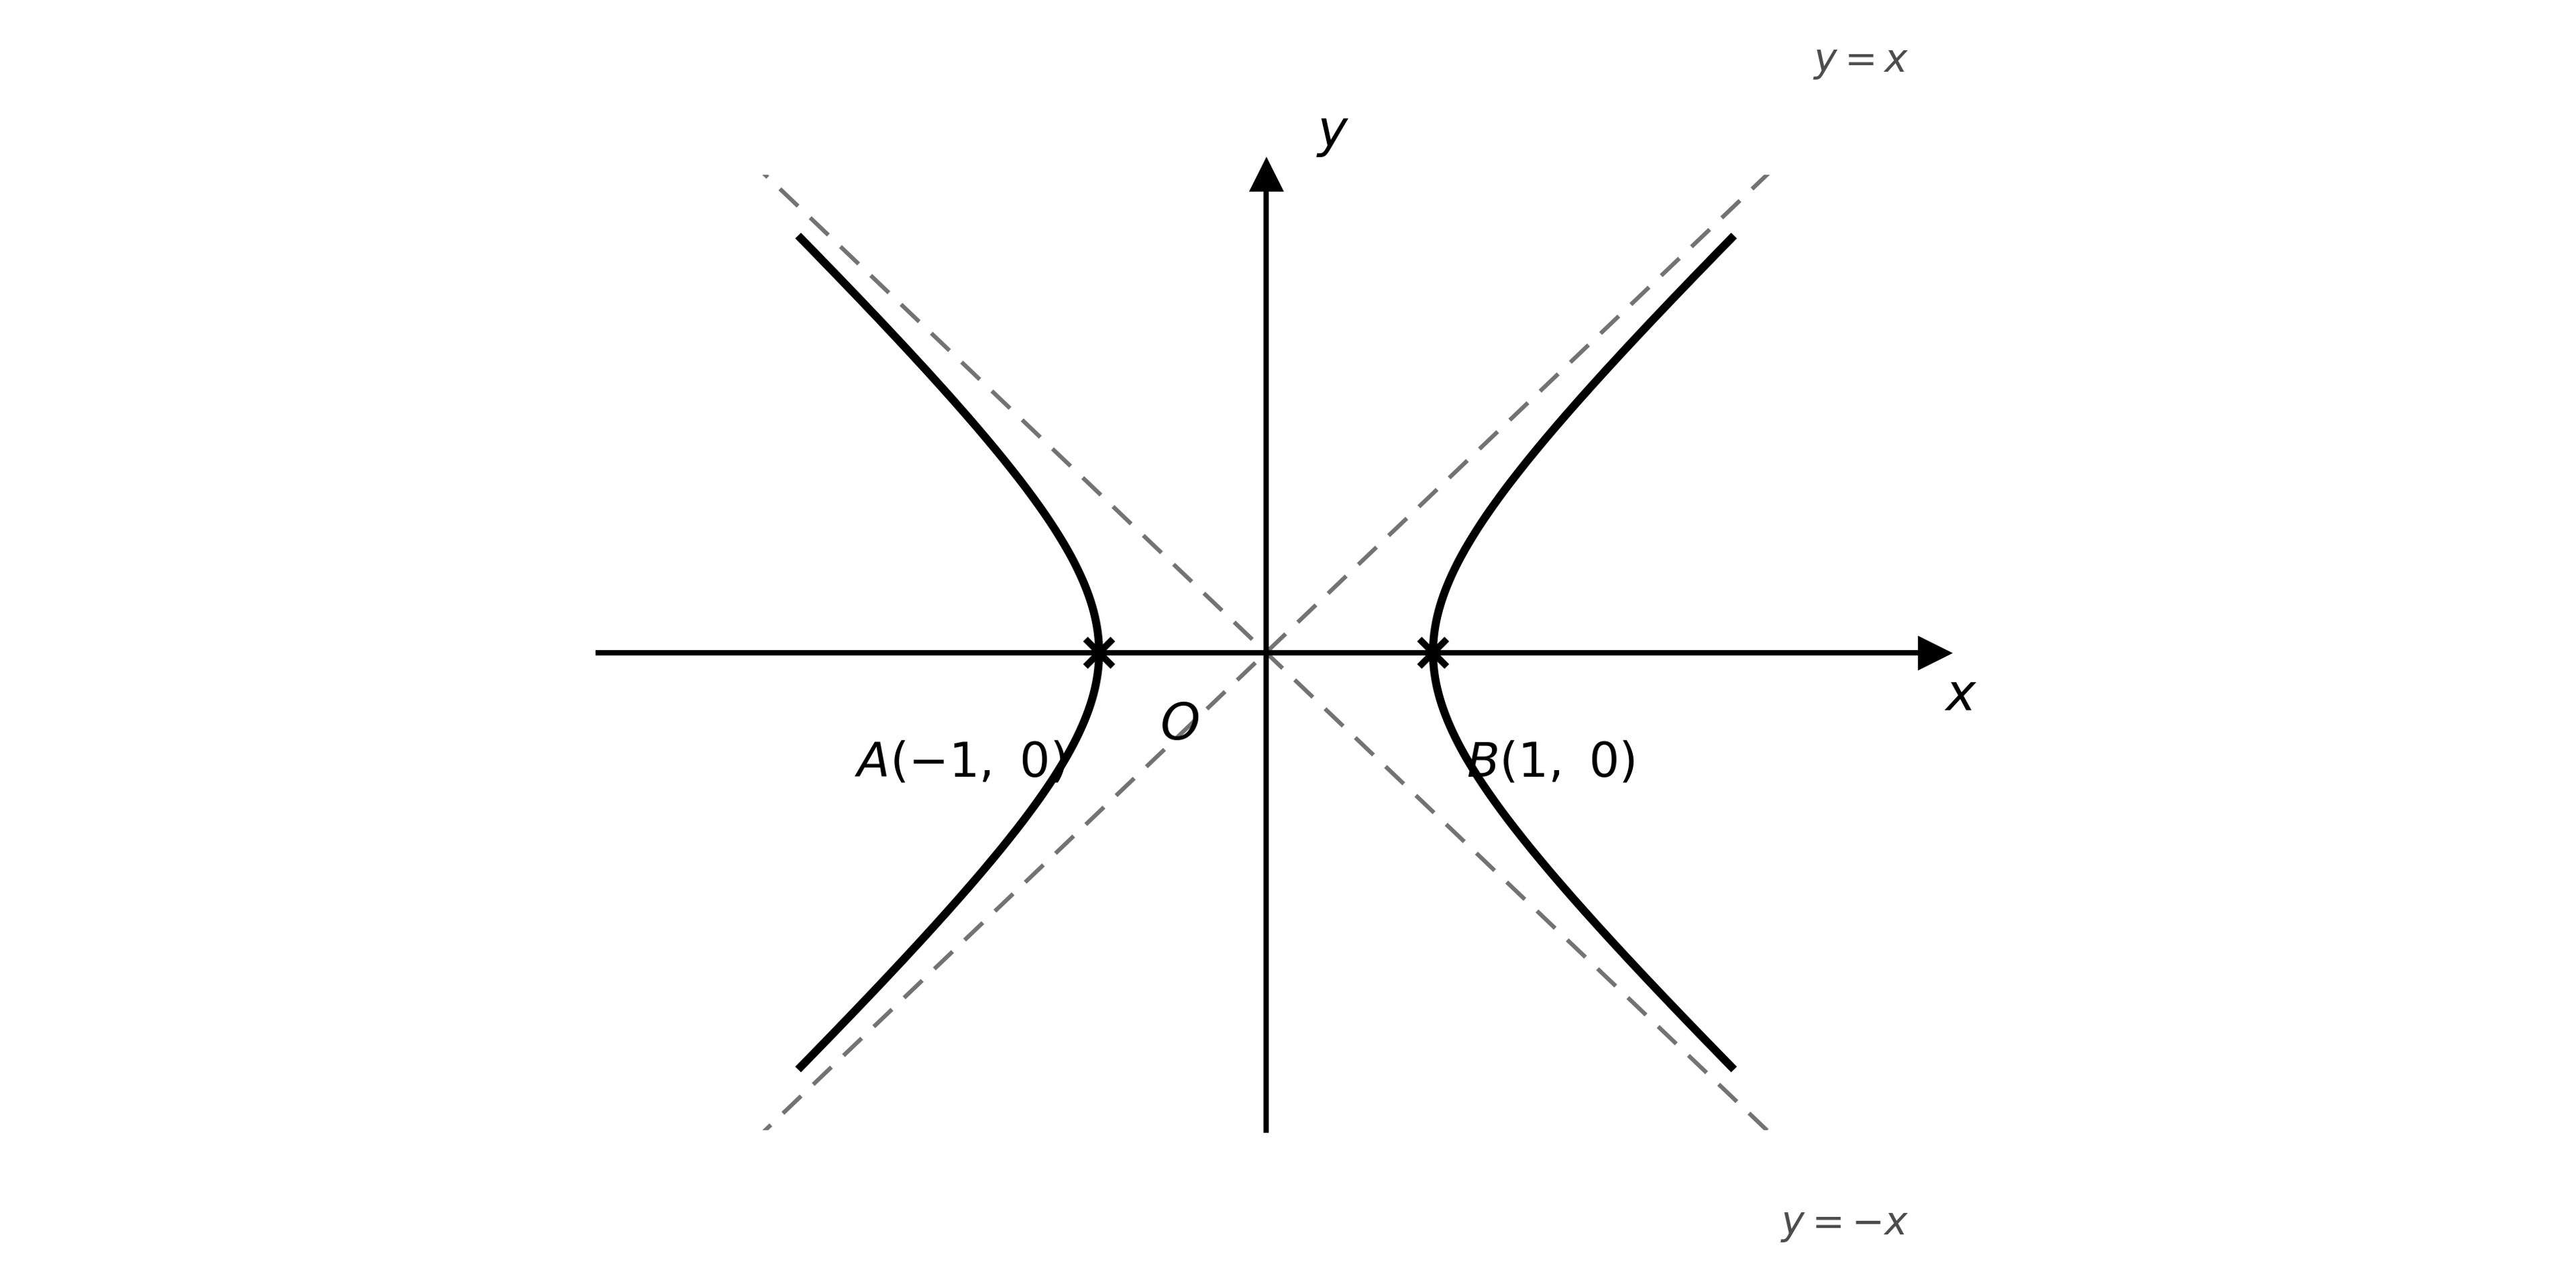
The diagram shows the graph of x2y2=1, which has asymptotes y=x and y=x and meets the x-axis at the points A and B.

Graph of x^2 - y^2 = 1, a left-right opening hyperbola with asymptotes y = x and y = -x, crossing the x-axis at A(-1, 0) and B(1, 0)

Determine the coordinates of the images of A and B on the graph of (x3)2(y1)2=1.

5b
5 marks

(i) Determine the equations of the asymptotes of the graph of (x3)2(y1)2=1.

(ii) Find the domain of (x3)2(y1)2=1.