Venn Diagrams (WJEC GCSE Maths & Numeracy (Double Award)): Revision Note
Exam code: 3320

Venn diagrams
What is a Venn diagram?
A Venn diagram is a way to illustrate events from an experiment and are particularly useful when there is an overlap (or lack of) between possible outcomes
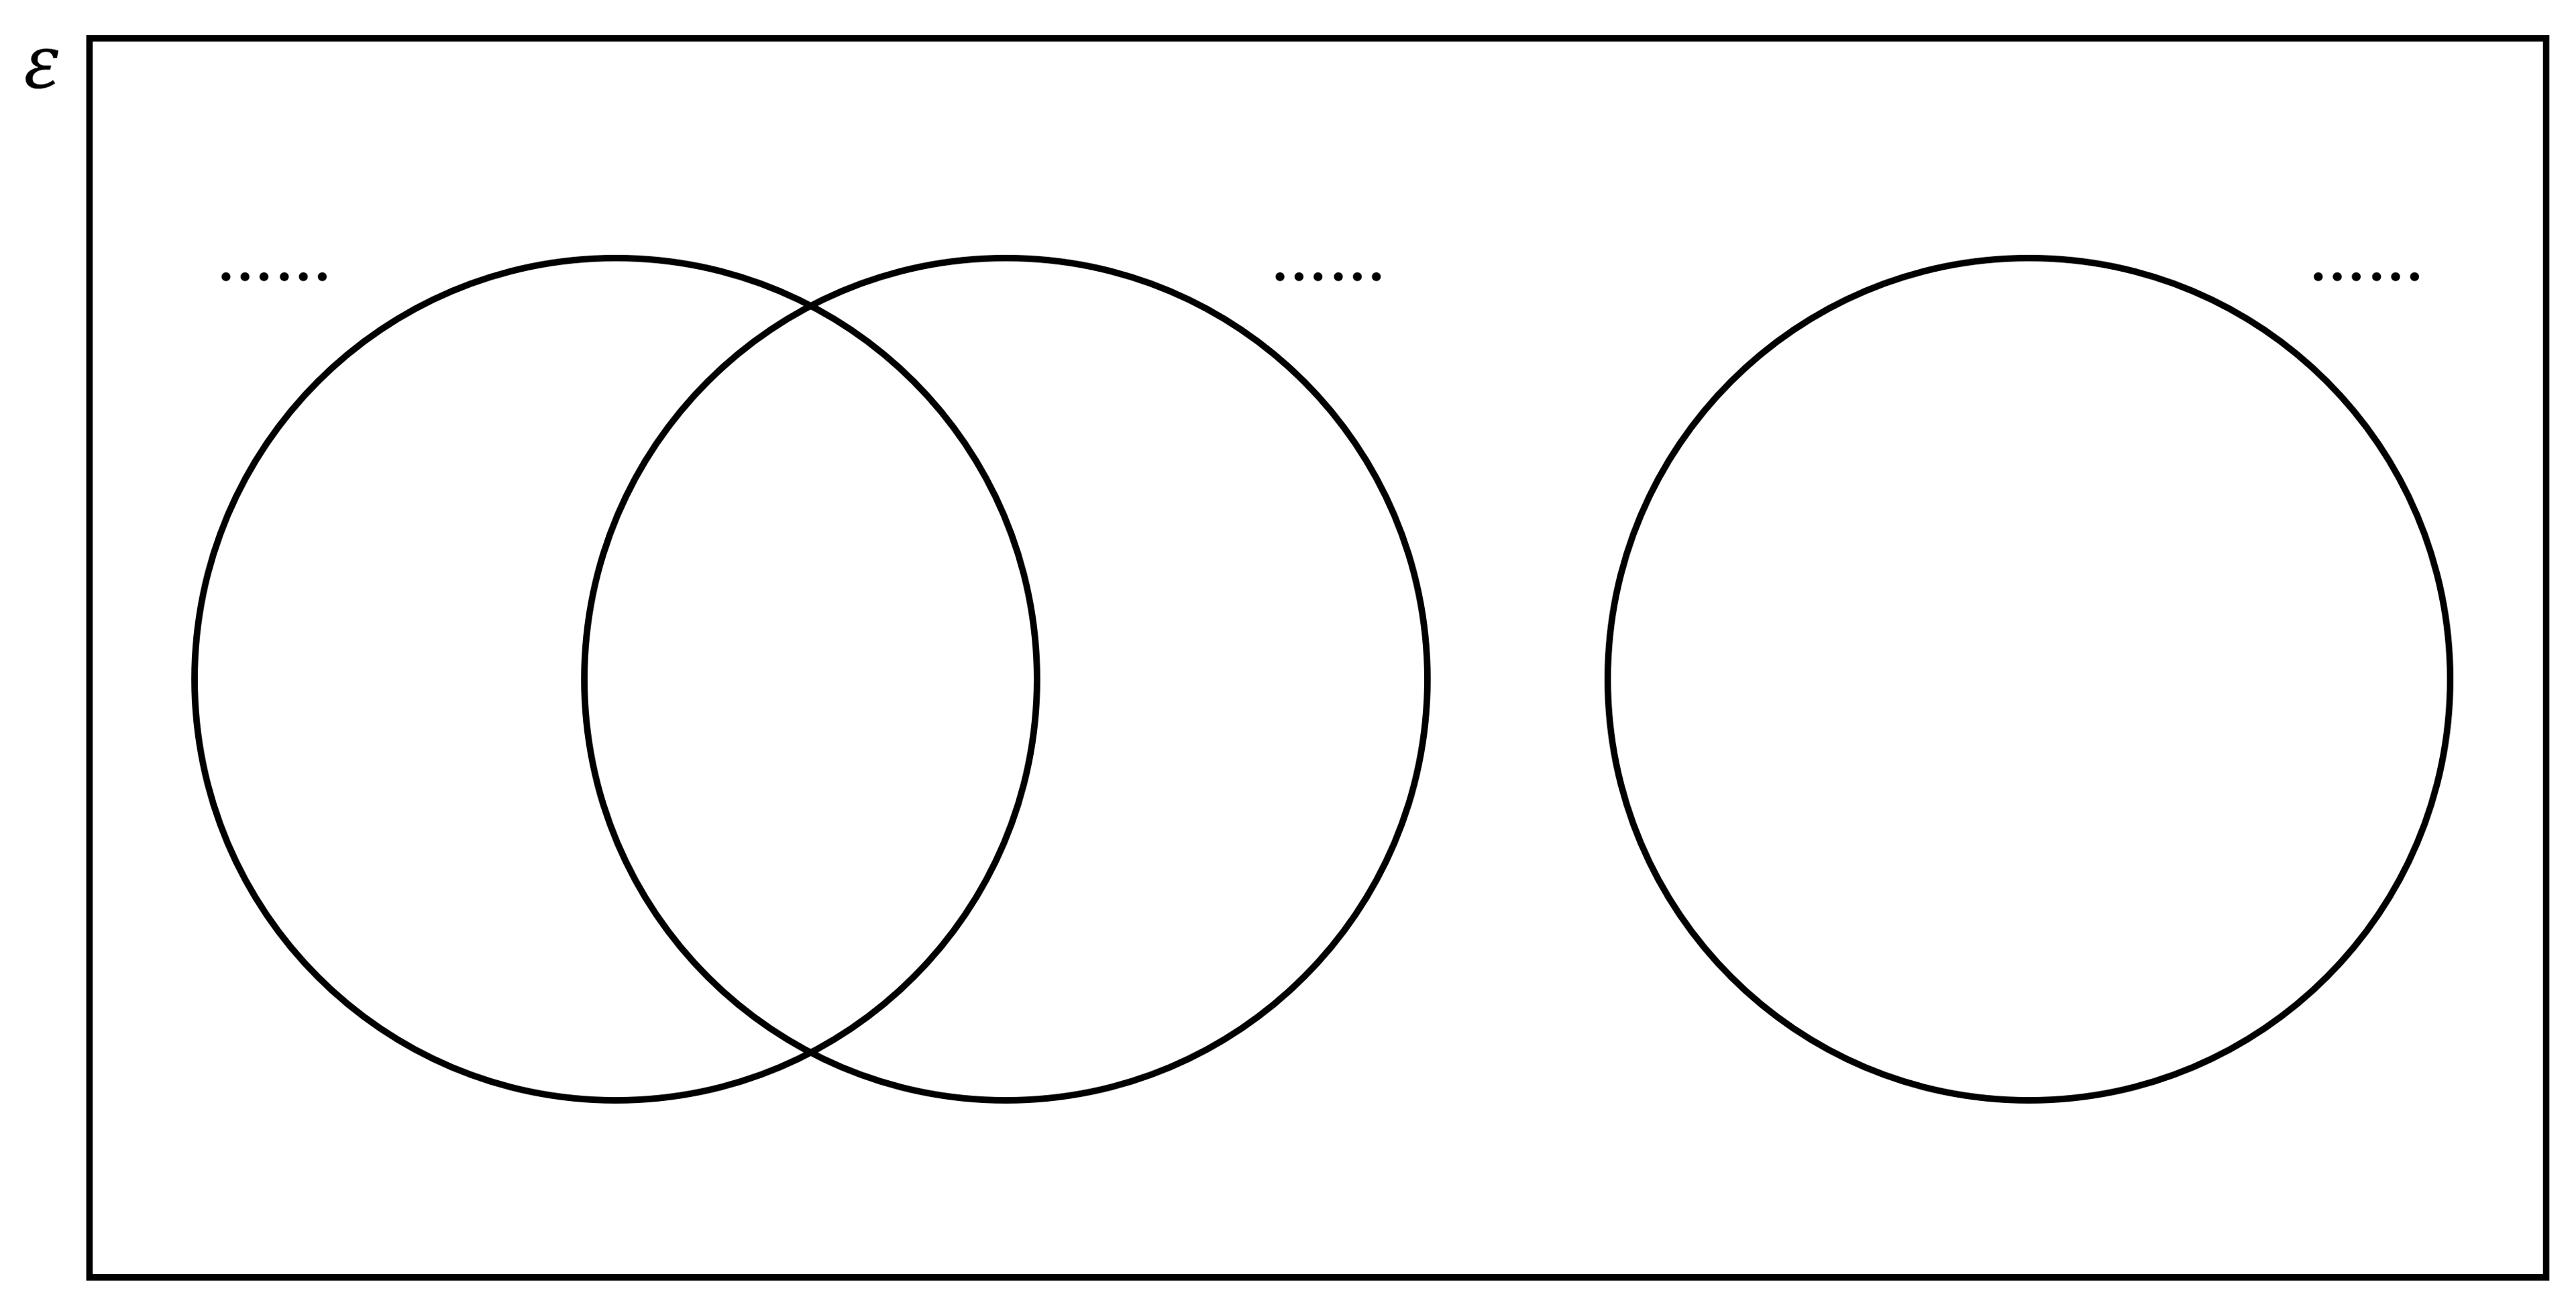
A Venn diagram consists of
a rectangle representing the sample space
a circle for each event
Circles may or may not overlap depending on which outcomes are shared between events
Circles may be separate (no overlap) if no outcomes are shared
One circle may be entirely within another if all outcomes are shared
How do I interpret a Venn diagram?
The outer rectangle represents the sample space (all possible outcomes from the experiment)
It is often referred to as the universal set
It may be labelled with any of
format('truetype')%3Bfont-weight%3Anormal%3Bfont-style%3Anormal%3B%7D%3C%2Fstyle%3E%3C%2Fdefs%3E%3Ctext%20font-family%3D%22Times%20New%20Roman%22%20font-size%3D%2216%22%20font-style%3D%22italic%22%20text-anchor%3D%22middle%22%20x%3D%223.5%22%20y%3D%2215%22%3E%26%23x3B5%3B%3C%2Ftext%3E%3Ctext%20font-family%3D%22math1f7177163c833dff4b38fc8d287%22%20font-size%3D%2214%22%20text-anchor%3D%22middle%22%20x%3D%2210.5%22%20y%3D%2215%22%3E%2C%3C%2Ftext%3E%3Ctext%20font-family%3D%22Times%20New%20Roman%22%20font-size%3D%2216%22%20font-style%3D%22italic%22%20text-anchor%3D%22middle%22%20x%3D%2220.5%22%20y%3D%2215%22%3ES%3C%2Ftext%3E%3Ctext%20font-family%3D%22math1f7177163c833dff4b38fc8d287%22%20font-size%3D%2214%22%20text-anchor%3D%22middle%22%20x%3D%2228.5%22%20y%3D%2215%22%3E%2C%3C%2Ftext%3E%3Ctext%20font-family%3D%22Times%20New%20Roman%22%20font-size%3D%2216%22%20font-style%3D%22italic%22%20text-anchor%3D%22middle%22%20x%3D%2240.5%22%20y%3D%2215%22%3EU%3C%2Ftext%3E%3Ctext%20font-family%3D%22math1f7177163c833dff4b38fc8d287%22%20font-size%3D%2214%22%20text-anchor%3D%22middle%22%20x%3D%2249.5%22%20y%3D%2215%22%3E%2C%3C%2Ftext%3E%3Ctext%20font-family%3D%22Times%20New%20Roman%22%20font-size%3D%2216%22%20font-style%3D%22italic%22%20text-anchor%3D%22middle%22%20x%3D%2258.5%22%20y%3D%2215%22%3E%26%23x3BE%3B%3C%2Ftext%3E%3C%2Fsvg%3E) or
or format('truetype')%3Bfont-weight%3Anormal%3Bfont-style%3Anormal%3B%7D%3C%2Fstyle%3E%3C%2Fdefs%3E%3Ctext%20font-family%3D%22scriptd69768b3da745b77e82cdbddc%22%20font-size%3D%2218%22%20text-anchor%3D%22middle%22%20x%3D%226.5%22%20y%3D%2218%22%3E%26%23x2130%3B%3C%2Ftext%3E%3C%2Fsvg%3E) depending on the source
depending on the source
Circles are labelled with their event name (A, B, etc)
The numbers inside a Venn diagram will represent either a frequency or a probability
In the case of probabilities being shown, all values should total 1
Read the revision note Probability from Venn Diagrams in the Probability section for more detail about finding probabilities from Venn diagrams

Examiner Tips and Tricks
Remember to draw the box around a Venn diagram. It represents all possible outcomes of the experiment, so is a crucial part of the diagram!
Examiner Tips and Tricks
When completing a Venn diagram, check that the frequencies sum to the correct total (or that the probabilities sum to 1).
Worked Example
At a school activities fair, 60 students signed up for three options: Coding (C), Robotics (R), and Photography (P).
Coding and Robotics both take place on the main campus, and some students do both.
Photography sessions are held at a partner art college across town, so no student can join Photography and either of the other two clubs.
The following information was collected:
26 students signed up for Coding
22 students signed up for Robotics
12 students signed up for Photography
8 students signed up for Coding and Robotics
There are 60 students in total
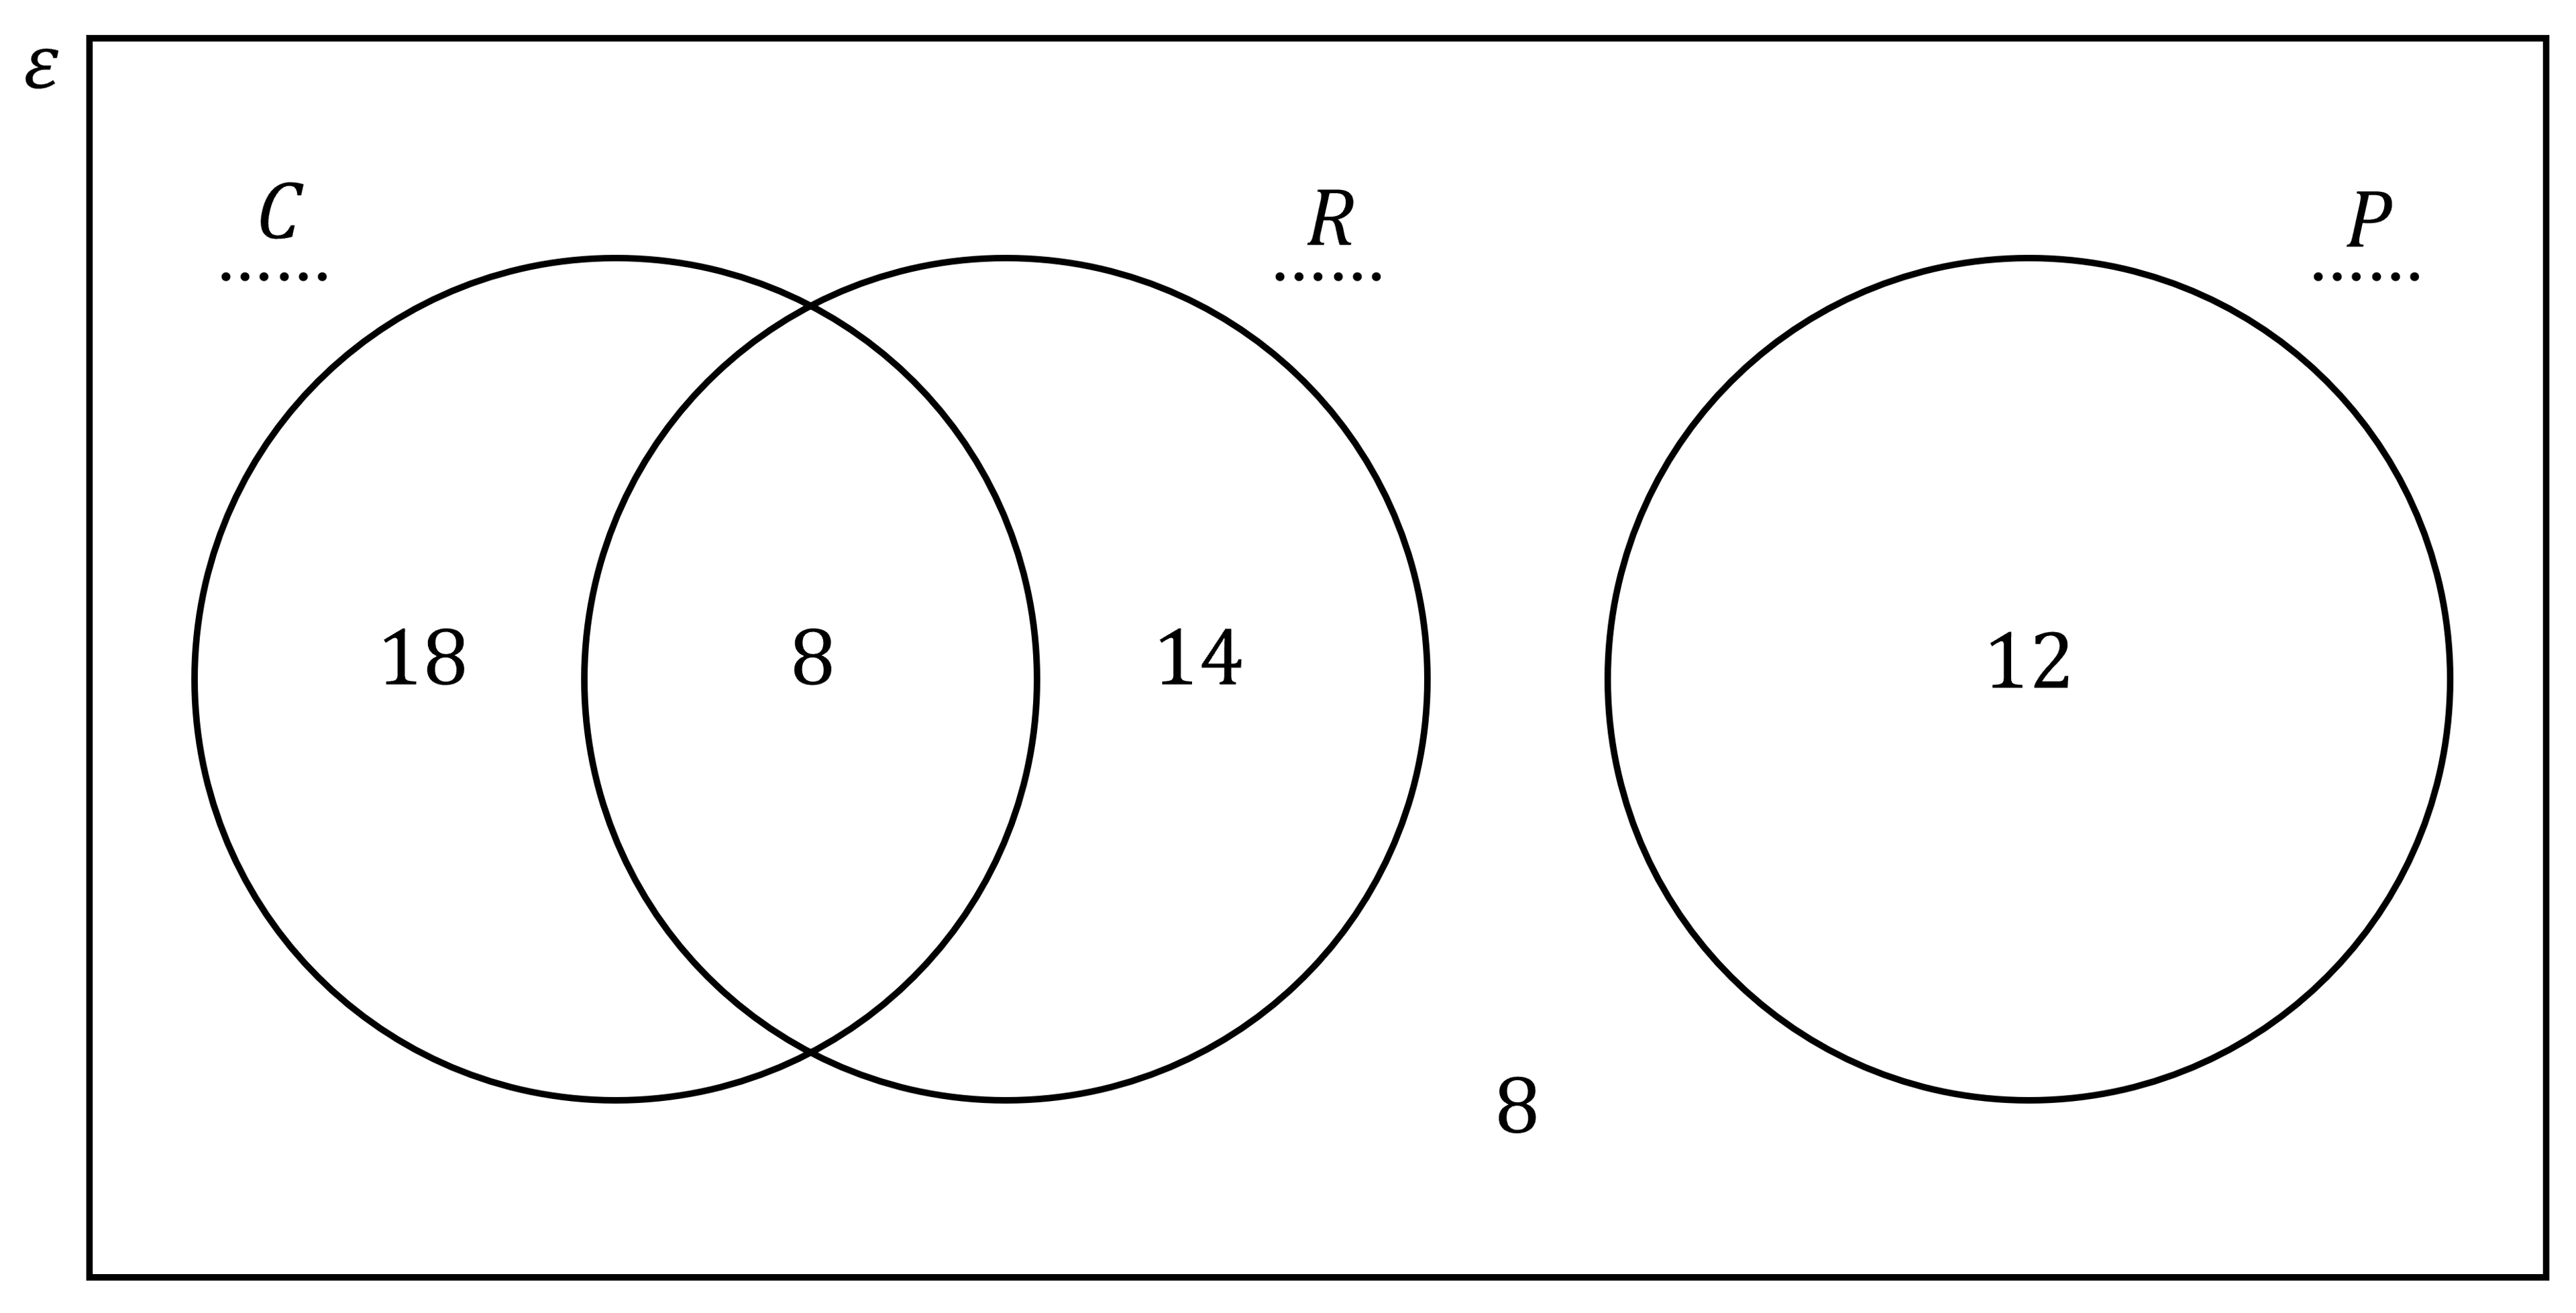
(a) Complete the Venn diagram below to show the number of students in each region.
Answer:
You are told that no one can do Photography and one of the other two activities
The separate circle must therefore be Photography (P), and you know that 12 signed up for Photography

Start with the overlapping region
You are told that 8 students signed up for Coding and Robotics

You are told that 26 signed up for coding in total
26 - 8 = 18
You are told that 22 signed up for Robotics in total
22 - 8 = 14

Find how many students did not sign up to any of the three clubs (there were 60 in total)
60 - 18 - 8 - 14 - 12 = 8
Fill this in inside the rectangle, but outside any circle to complete the Venn diagram
(b) Find how many students sign up to:
(i) more than 1 of the clubs,
(ii) coding but not robotics
(iii) only 1 club.
Answer:
(i)
More than 1 of the clubs is the overlapping region between C and R
8 students sign up to more than 1 club
(ii)
Coding but not robotics is the "C only" region
18 students sign up to Coding but not Robotics
(iii)
Only 1 club is the "C only" region plus the "R only" region plus the "P only" region
18 + 14 + 12 = 44
44 students sign up to only 1 club

Unlock more, it's free!
Join the 100,000+ Students that ❤️ Save My Exams
the (exam) results speak for themselves:

Was this revision note helpful?
