The Data Handling Cycle (WJEC GCSE Maths & Numeracy (Double Award)): Revision Note
Exam code: 3320
The Data Handling Cycle
What is the data handling cycle?
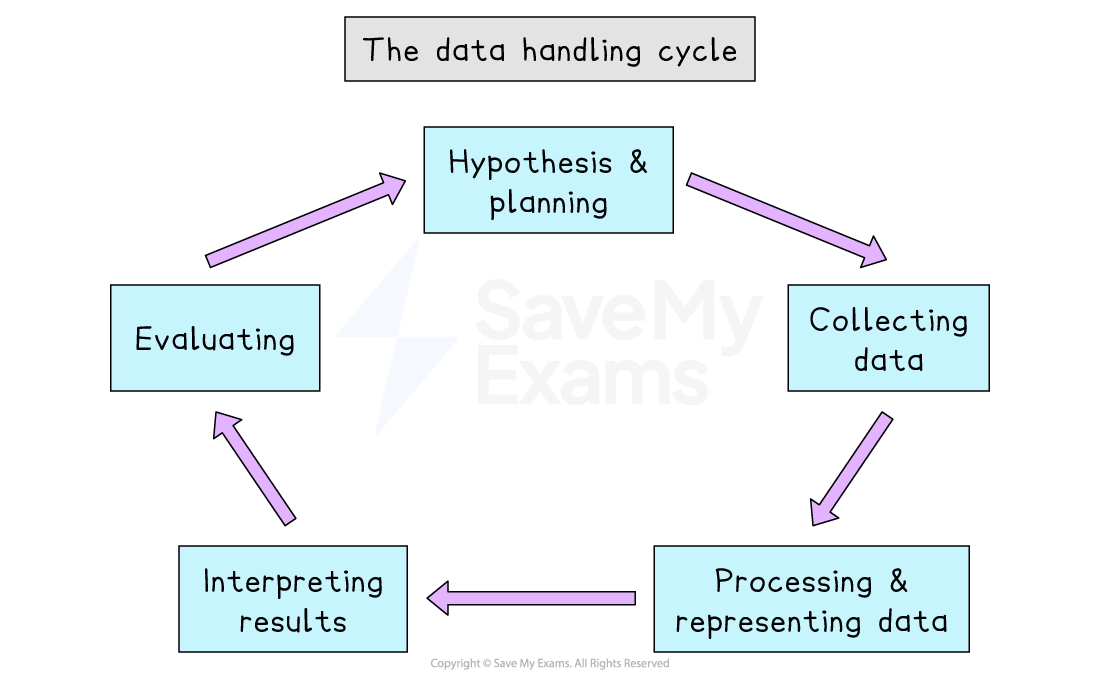
The process for handling data in an investigation in the real world is a cycle, known as the data handling cycle
Being a cycle means there is no simple ‘beginning’ and ‘end’
Instead the steps are repeated with improvements made each time

The data handling cycle is divided into five stages:
Hypothesis and Planning
Specify a hypothesis to be investigated
Plan what data to collect (and how it will be recorded)
Plan how you will process and represent the data
Collecting Data
Design data collection to minimise bias
Be aware of possible issues of sensitivity
Collect data using an appropriate method
Processing and Representing Data
Organise the data e.g. into tables
Create diagrams and charts to represent the data
Calculate summary statistics (e.g. the mean) to allow the data to be compared
Interpreting Results
Interpret your summary statistics, and your diagrams and charts in the context of the investigation
Draw conclusions that are related to the original hypothesis
Be sure to comment on the reliability of the results
Evaluating
Identify any possible issues with how the data was collected, processed and represented
Consider the limitations of your data, and any anomalies found
Suggest improvements to deal with those issues
Repeat the process with improvements to investigate the hypothesis further if needed
An exam question may directly mention one or more stages of the data handling cycle
But you should keep the data handling cycle in mind when answering any exam question about data
What is a hypothesis and how can it be tested?
A hypothesis is a statement that you would like to test using statistics
For example, ‘As cars get older their annual maintenance cost is likely to go up’
A hypothesis should always be stated at the start of a statistical enquiry
before any data is collected
Testing a hypothesis requires
collecting valid and relevant data
appropriate analysis of the data collected
What sort of limitations might affect a statistical investigation?
Limitations are practical limits that affect how an investigation may be carried out
You should try to anticipate these at the start of an investigation
and include them in your planning
‘Anticipate’ means try to think of what they might be ahead of time
Time
You may only have a limited amount of time for conducting the investigation
So you must plan an investigation that can be completed with the time available
Cost
The ‘best’ investigation might cost more than is available
You need to plan for the ‘best investigation you can afford’
Ethical & confidentiality issues
You must always look out for the well-being and privacy of any participants in the investigation
People may not be willing to reveal confidential (‘secret’) information
People may be uncomfortable discussing sensitive topics
Convenience
Some pieces or types of data might be hard to find or collect
E.g. a school student is unlikely to be able to collect data about weekday shopping habits
Worked Example
Harry is investigating people's shopping habits at the supermarket chain "Wilson's".
His plan is to:
Ask anyone with a trolley the following questions:
How often do you visit Wilson's?
How much money do you usually spend?
Do this for one hour in the morning
Record the responses using a tally chart
After looking at the data, select an interesting hypothesis to test
Create a bar chart
Ask his friends to help do this for every Wilson's supermarket in the country, to make it a representative sample
State 3 criticisms of Harry's plan for his investigation.
Answer:
There are many possible criticisms of this plan
Any of the following would be valid criticisms
Selecting only those with a trolley will bias the sample (compared to those with just a basket)
People may not be willing to disclose how much they spend
"How often do you visit" has not been given a specific time frame (e.g. weekly)
One hour in the morning will not be representative of the whole day
The day of the week is not specified, there will be differences between weekday and weekend shoppers for example
A tally chart has been suggested but no categories have been suggested to count the frequencies for e.g. "Once or twice a week" or "£0-£20"
Harry says he will decide on a hypothesis after seeing the data; you should always decide on a hypothesis before you collect the data
Creating a bar chart may not be appropriate for the data collected
Doing this for every Wilson's in the country is not likely to be practical (or could end up being too expensive)

Unlock more, it's free!
Did this page help you?