14 marks
A curve has equation .
Describe fully the single transformation that maps the graph of onto the graph of each of the following:
(i)
(ii)
(iii)
(iv)
Was this exam question helpful?
Exam code: 9709
A curve has equation .
Describe fully the single transformation that maps the graph of onto the graph of each of the following:
(i)
(ii)
(iii)
(iv)
Was this exam question helpful?
A curve has equation .
Write down, in terms of , the equation of the curve obtained by each of the following transformations of :
(i) a translation by
(ii) a stretch parallel to the -axis with scale factor
(iii) a stretch parallel to the -axis with scale factor
(iv) a reflection in the -axis
Was this exam question helpful?
The point lies on the curve with equation .
State the coordinates of the image of on each of the following curves:
(i)
(ii)
(iii)
Was this exam question helpful?
A point on the graph of is mapped to the point under a single transformation.
For each of the following coordinates of , describe a transformation that could have produced it:
(i)
(ii)
(iii)
Was this exam question helpful?
The point lies on the curve with equation .
Find the value of in each of the following cases:
(i) on the graph of , the point is mapped to
(ii) on the graph of , the point is mapped to
(iii) on the graph of , the point is mapped to
Was this exam question helpful?
The function is defined by
Sketch the graph of , showing clearly the coordinates of the points where the graph meets the coordinate axes and the coordinates of the turning point.
On separate diagrams sketch the graphs of:
(i)
(ii)
In each case show clearly the coordinates of the points where the graph meets the coordinate axes and the coordinates of the turning point.
Was this exam question helpful?
The diagram shows the graph of . The point has coordinates , where .
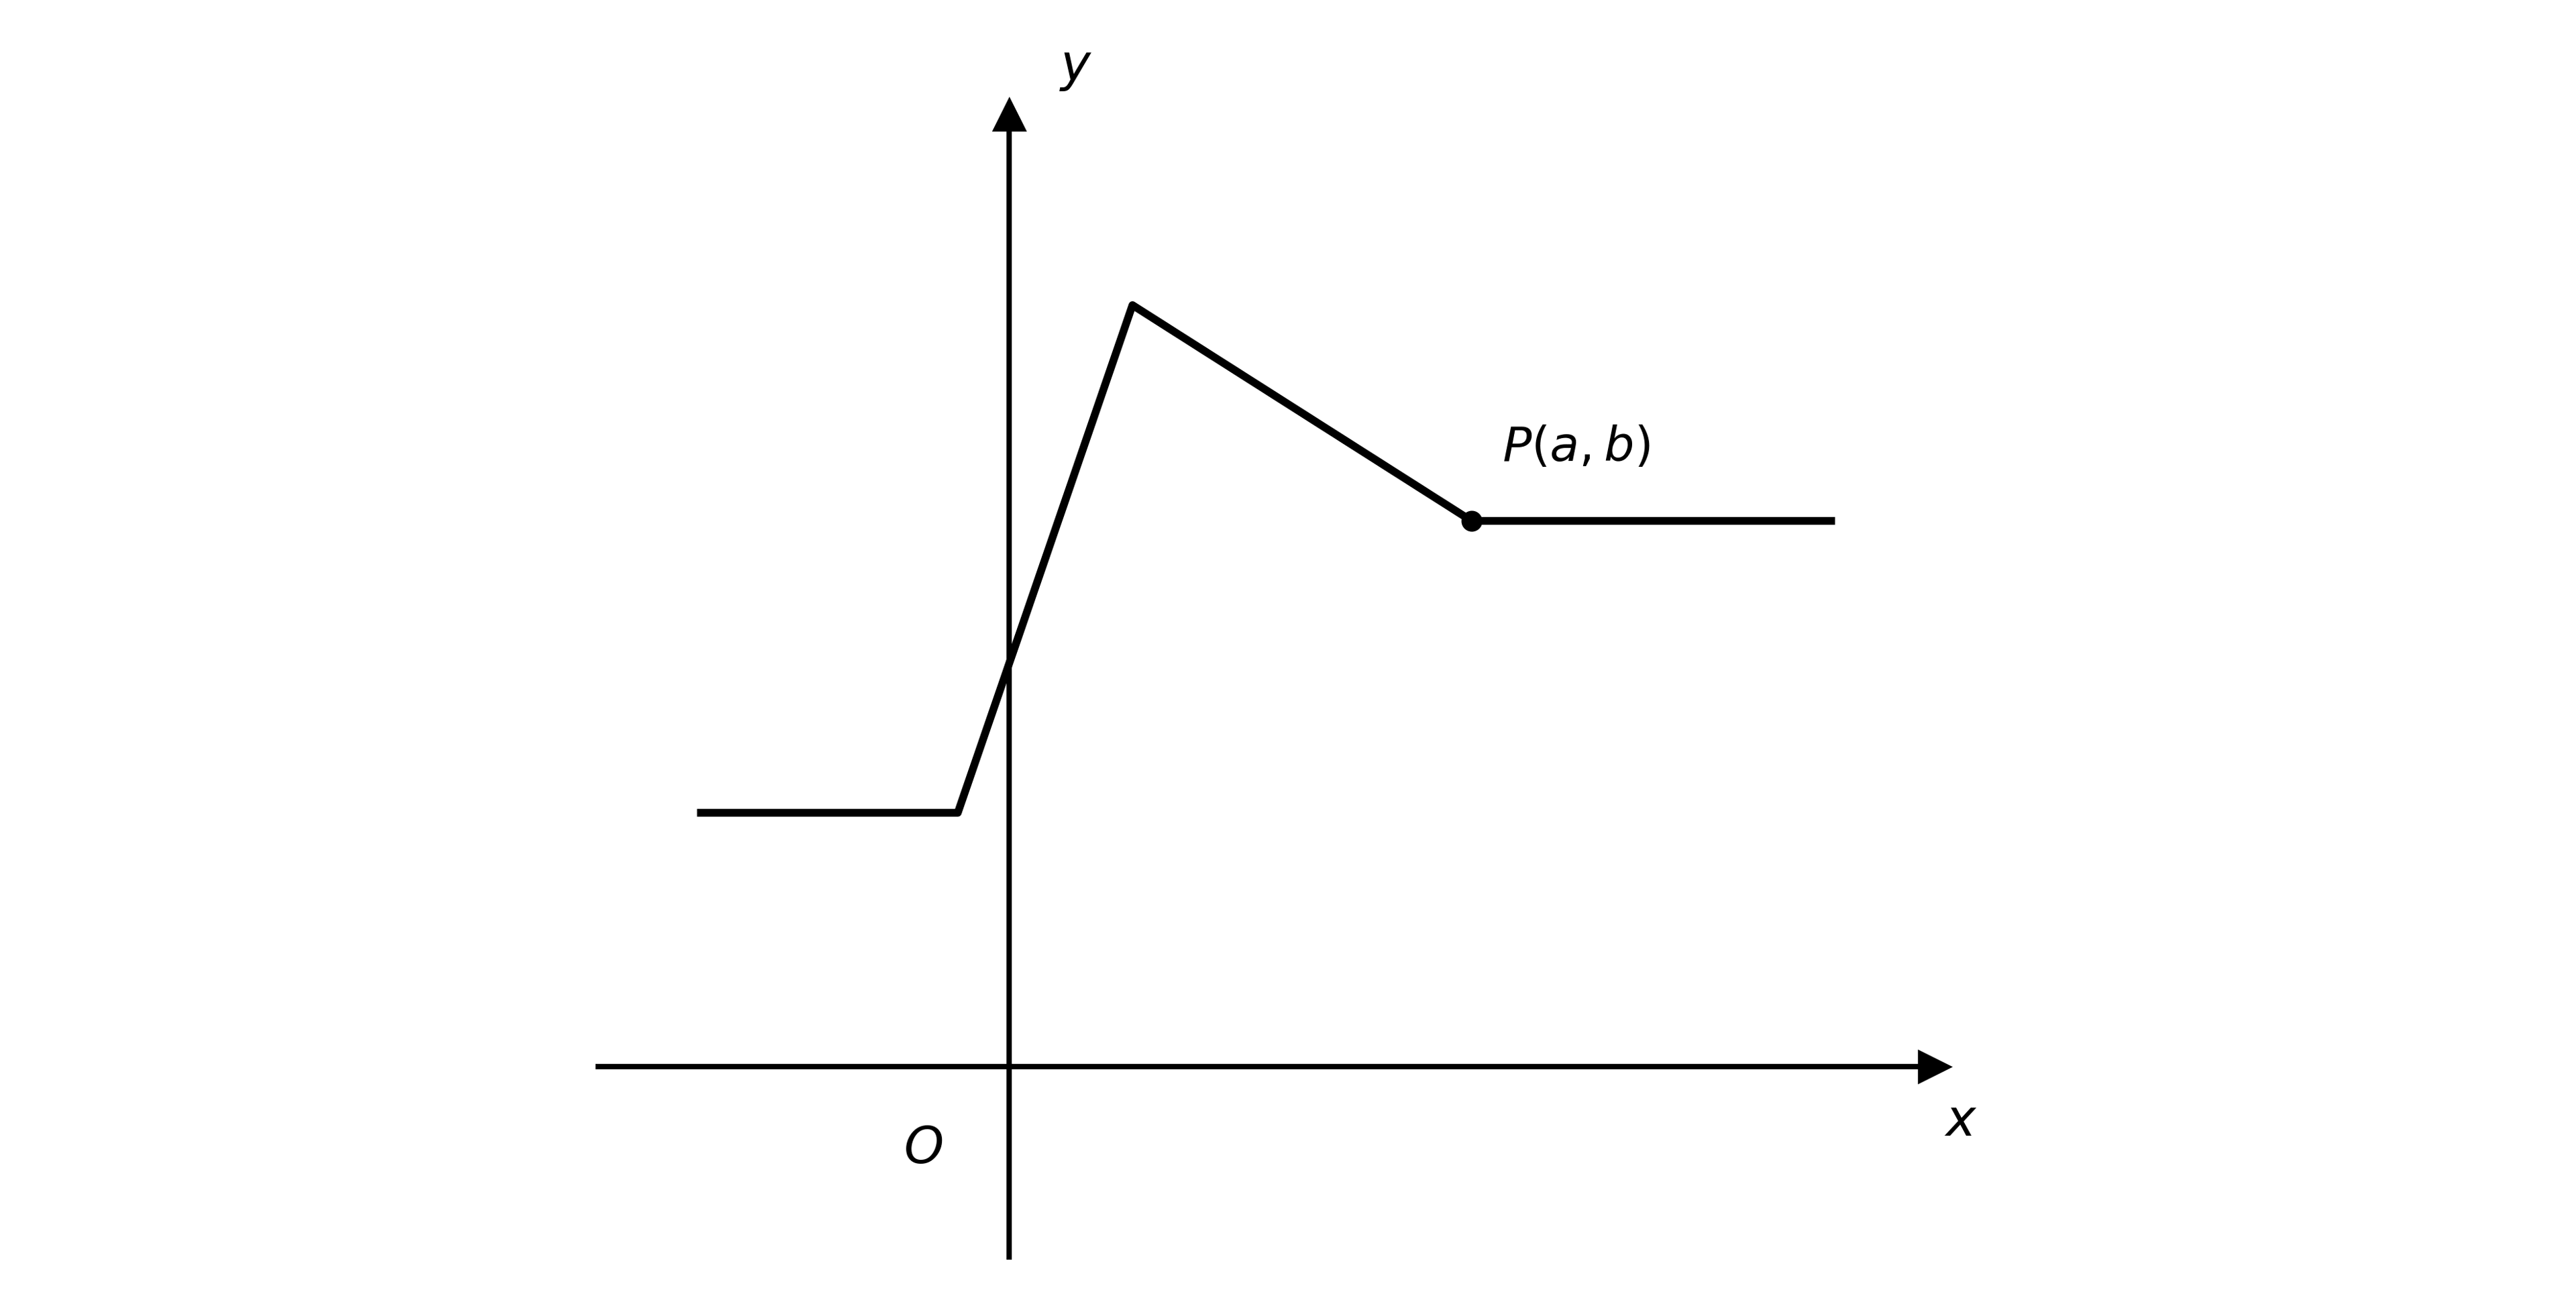
In terms of and , write down the coordinates of the image of under each of the following transformations:
(i)
(ii)
(iii)
Was this exam question helpful?
The point lies on the curve with equation .
State the coordinates of the image of on each of the following curves:
(i)
(ii)
(iii)
(iv)
Was this exam question helpful?
The point lies on the curve with equation .
State the coordinates of the image of on each of the following curves:
(i)
(ii)
Was this exam question helpful?
The point lies on the curve with equation .
Determine the value of the constant in each of the following cases:
(i) on the graph of , the point is mapped to
(ii) on the graph of , the point is mapped to
(iii) on the graph of , the point is mapped to
(iv) on the graph of , the point is mapped to
Was this exam question helpful?
The diagram shows the graph of . The marked points are and .
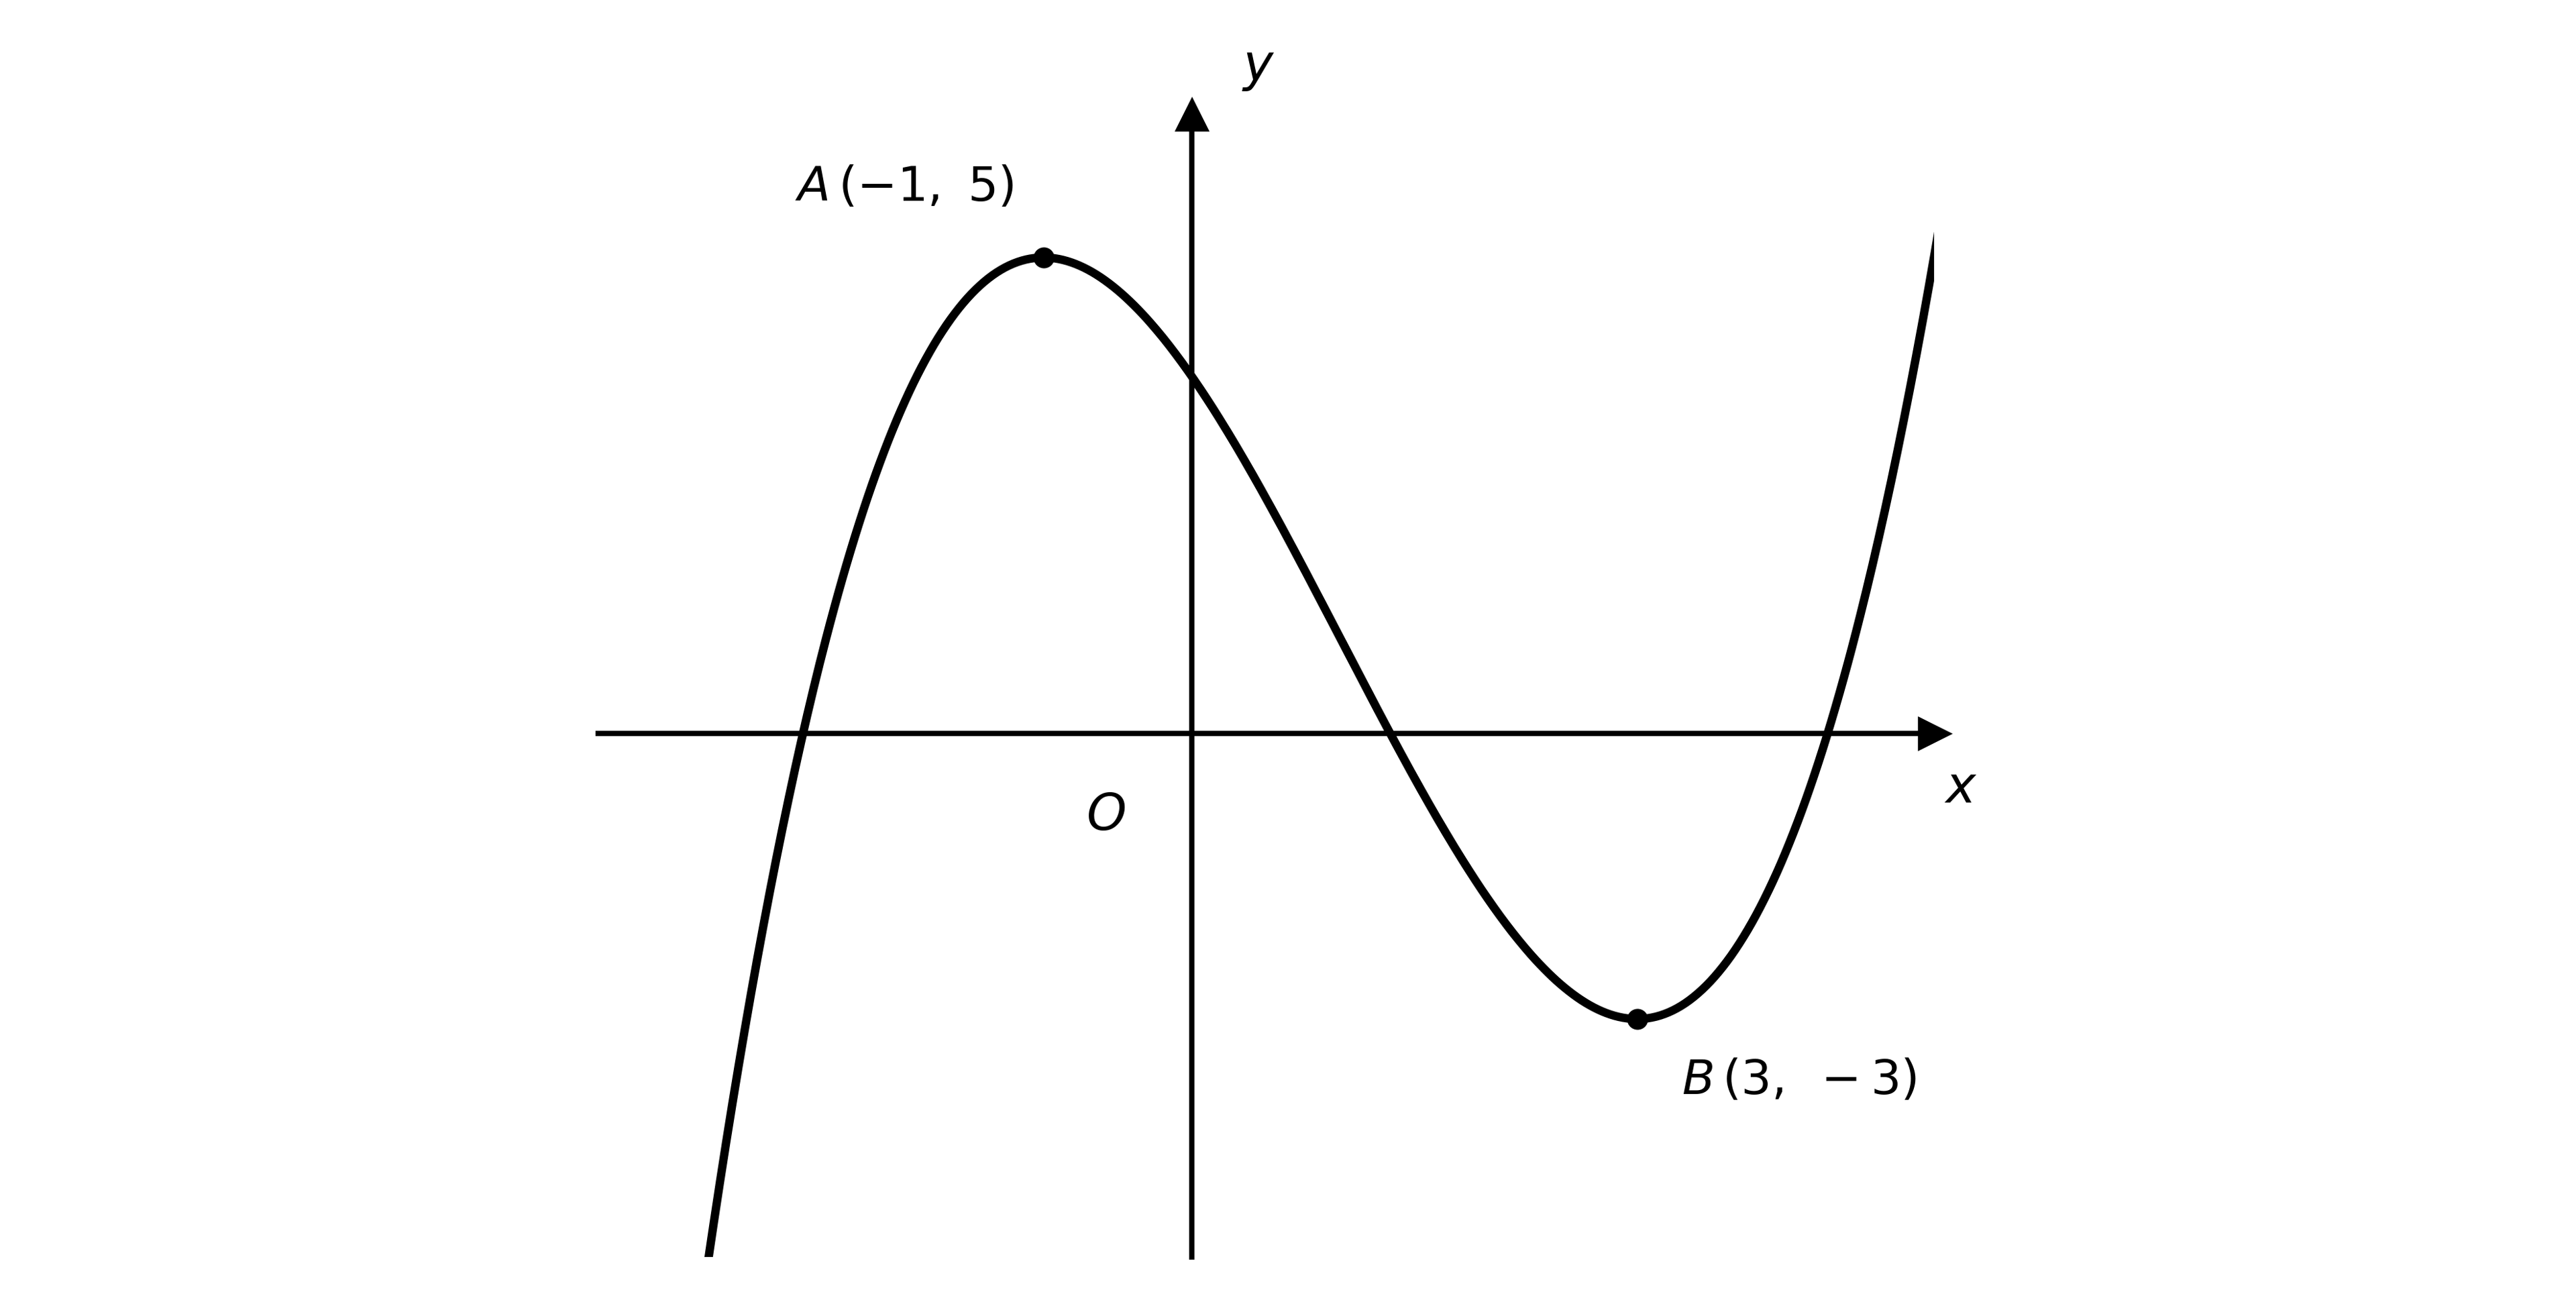
On separate diagrams, sketch the following curves, giving the coordinates of the images of and on each:
(i)
(ii)
On the graph of the image of one of the two marked points has an -coordinate of . Find the two possible values of .
Was this exam question helpful?
The diagram shows the graph of . The marked point lies on the graph, and the graph meets the origin at the marked point .
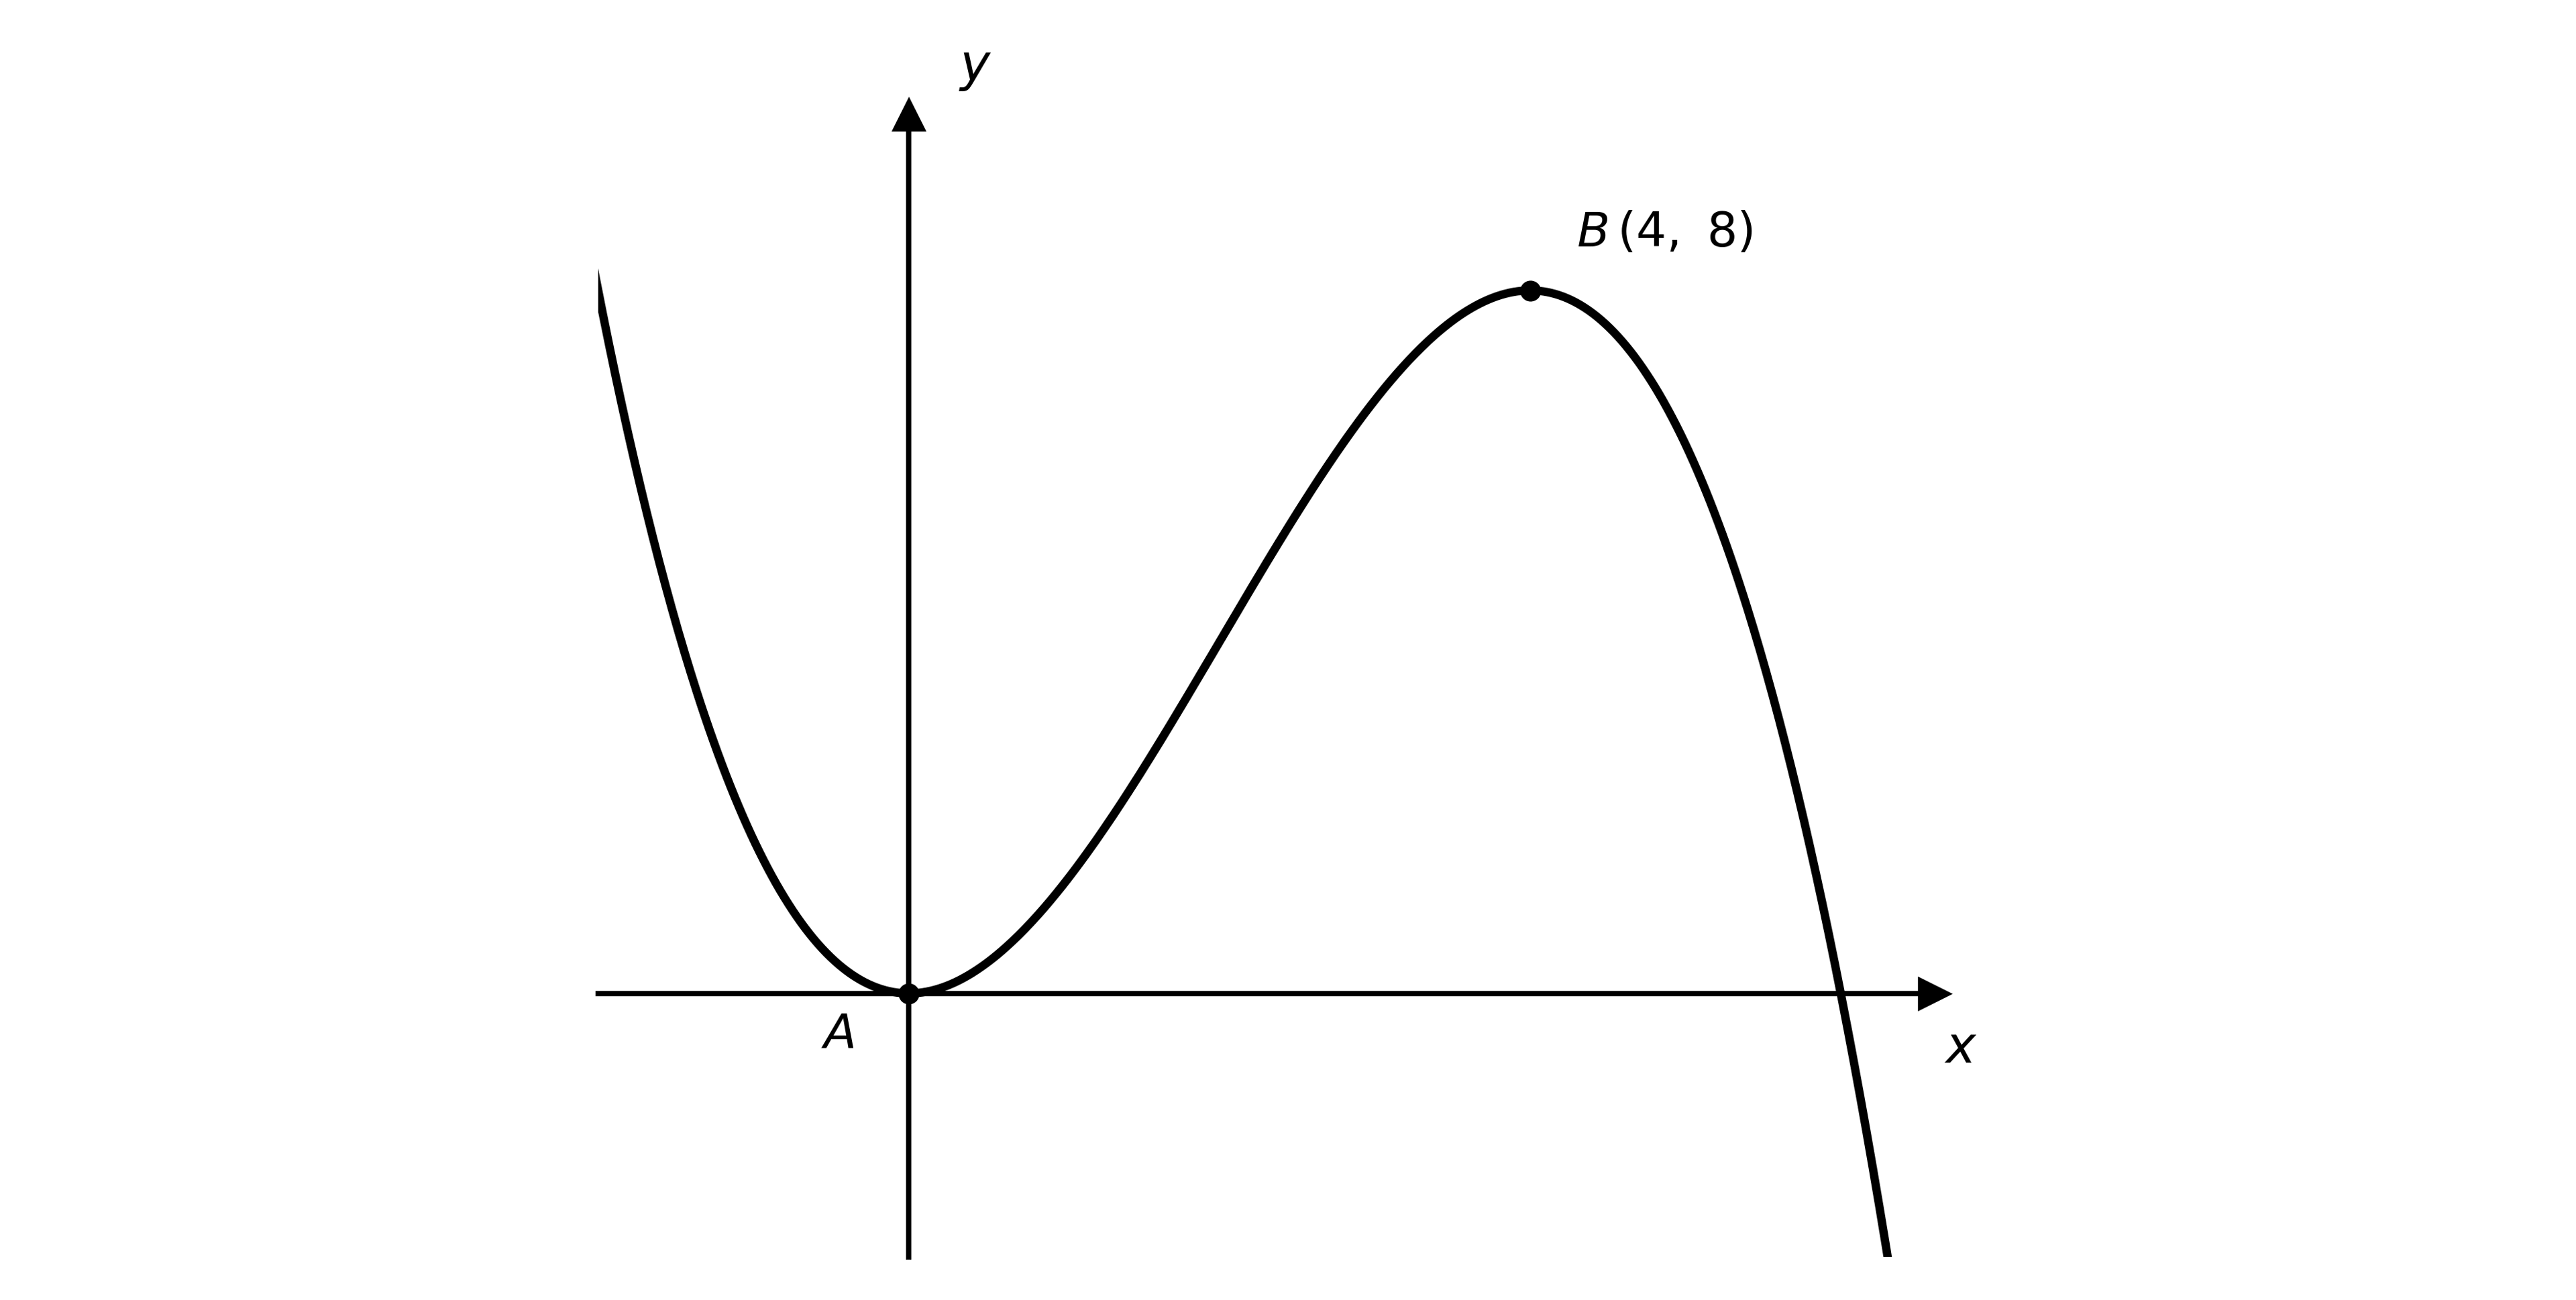
On separate diagrams, sketch the following curves, giving the coordinates of the images of and on each:
(i)
(ii)
On the graph of the image of one of the two marked points has a -coordinate of . Find the value of .
Was this exam question helpful?
The diagram shows the graph of . The graph meets the coordinate axes at the marked points and , and has asymptotes with equations and .
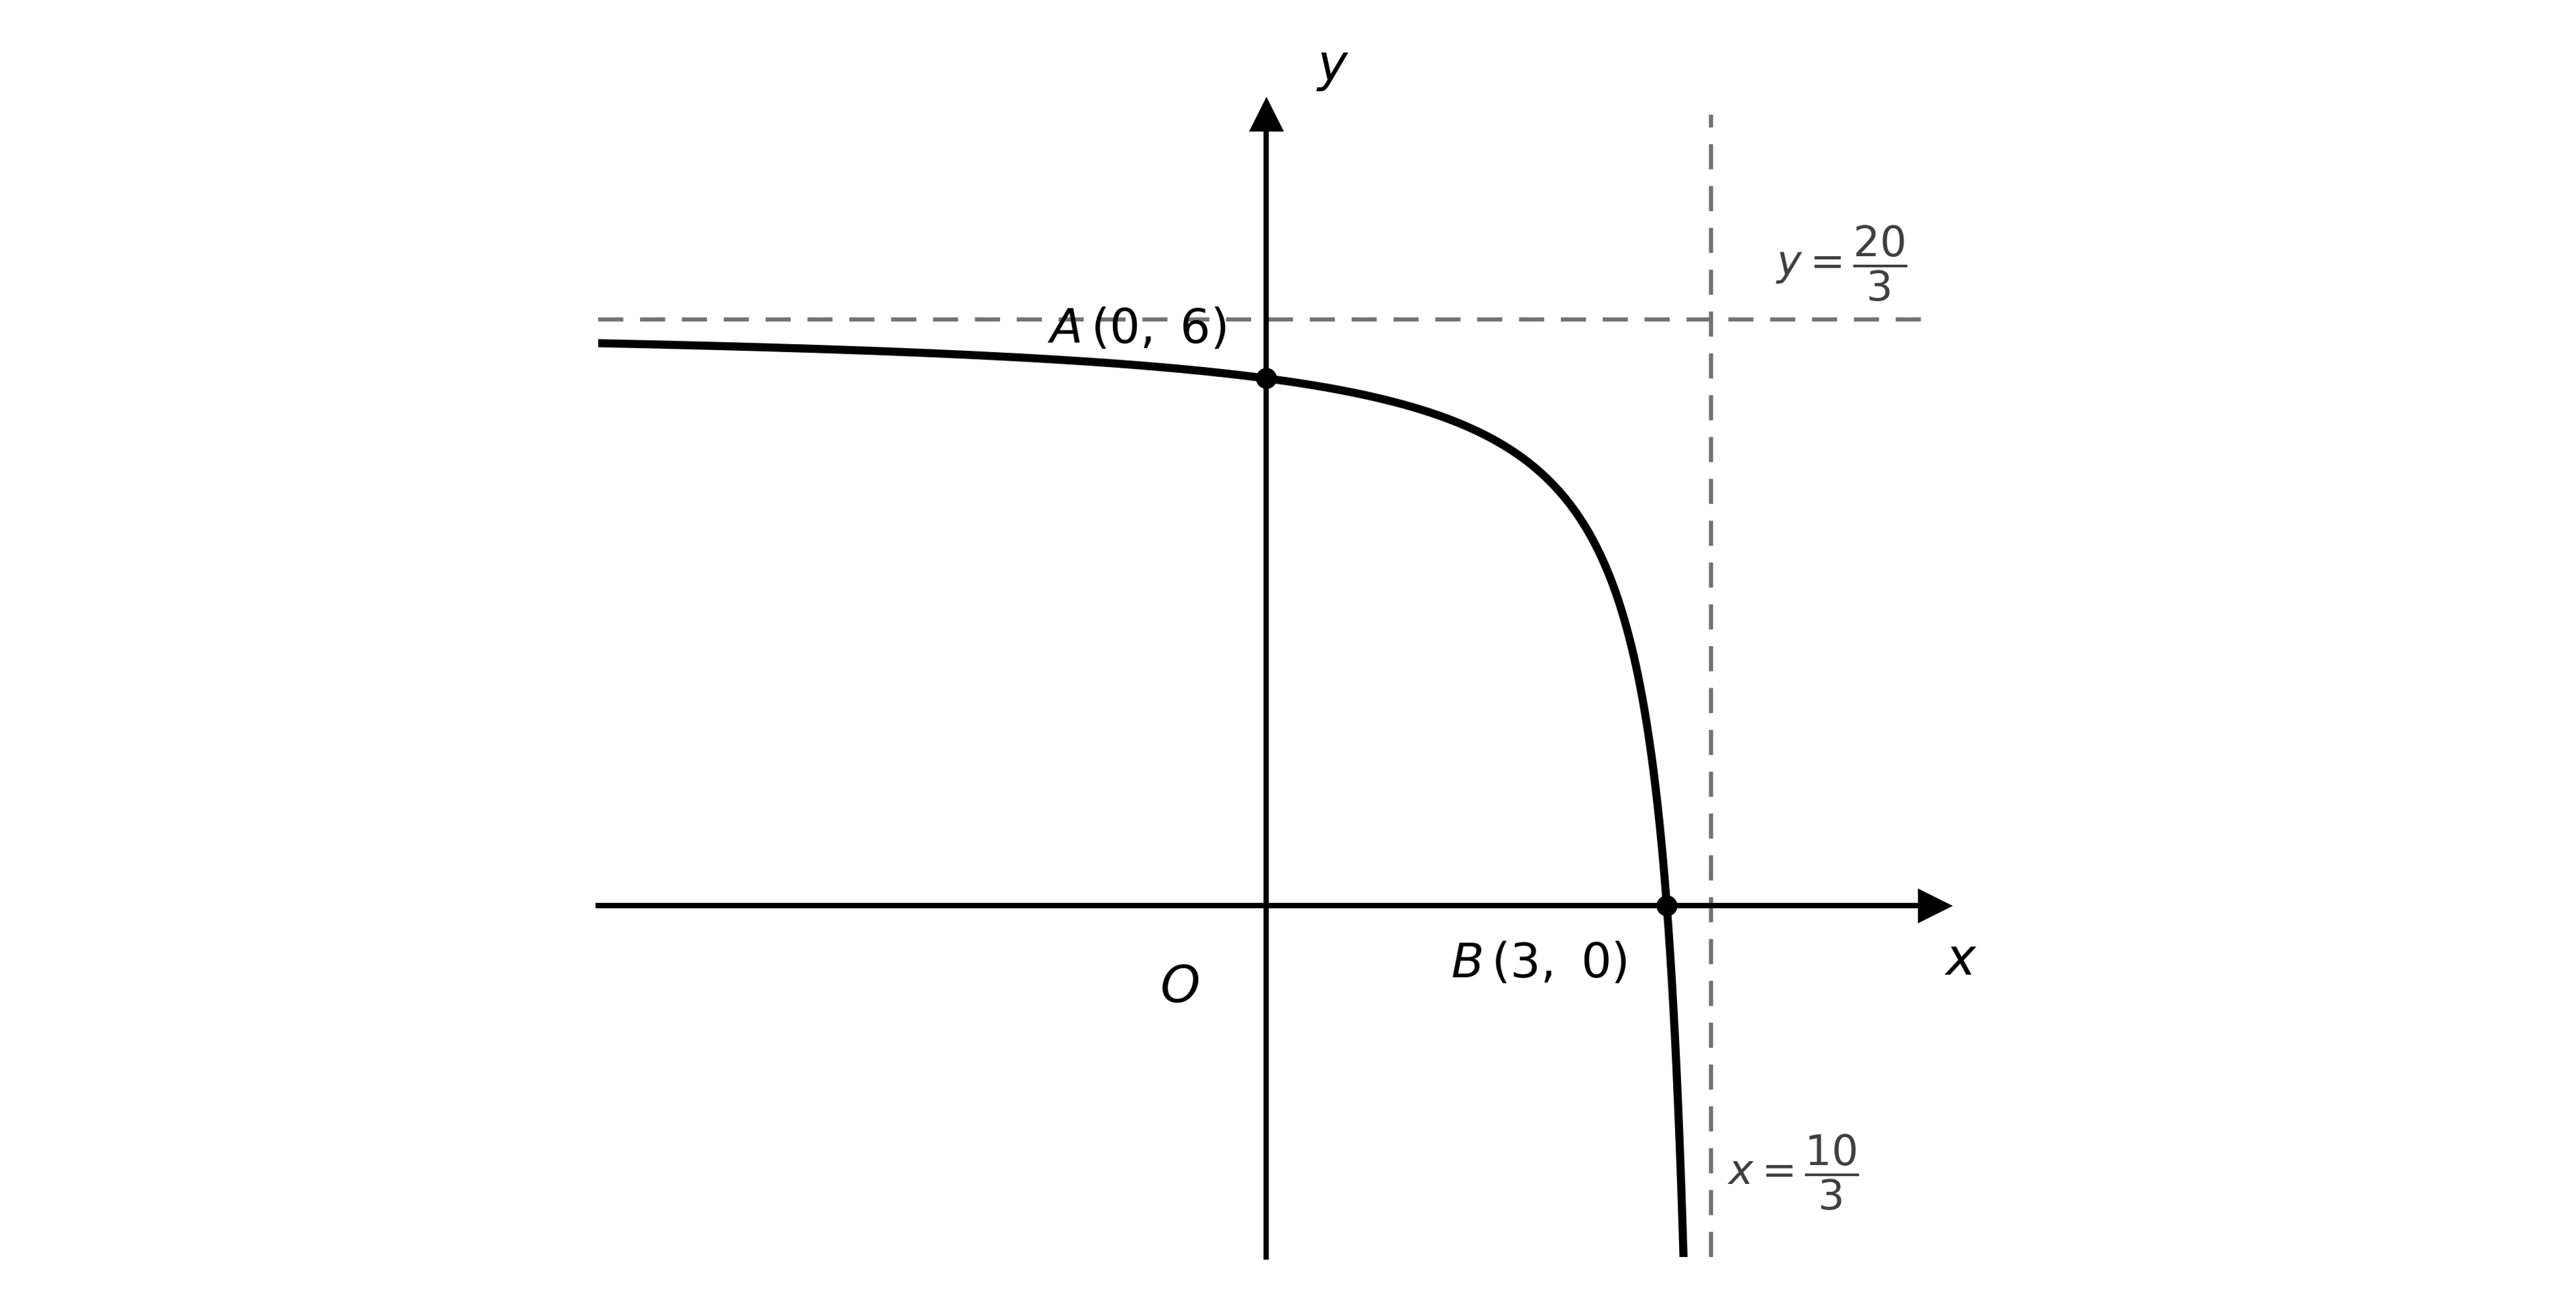
On separate diagrams, sketch the following curves, giving the coordinates of the images of and and the equations of the transformed asymptotes:
(i)
(ii)
On the graph of one of the asymptotes lies on a coordinate axis. Find the value of .
Was this exam question helpful?
Sketch the graph of , showing clearly the points where the curve crosses the coordinate axes and stating the equations of the asymptotes.
The graph of passes through the origin. Find the value of .
Was this exam question helpful?
Given that
sketch the graph of , showing clearly the coordinates of the points where the curve crosses the coordinate axes.
The graph with equation passes through the point . Find the three possible values of .
Was this exam question helpful?
The point lies on the curve with equation .
State the coordinates of the image of on each of the following curves:
(i)
(ii)
(iii)
(iv)
Was this exam question helpful?
The point lies on the curve with equation .
State the coordinates of the image of on each of the following curves:
(i)
(ii)
Was this exam question helpful?
The point lies on the curve with equation .
The graph is translated so that is mapped to the point . Write down the equation of the transformed curve.
The graph is translated so that is mapped to the point . Write down the equation of the transformed curve in the form
where is a constant to be found.
Was this exam question helpful?
The point lies on the curve with equation .
The graph is stretched so that is mapped to the point . Write down the equation of the transformed curve in the form , where , and are constants to be found.
The graph is stretched so that is mapped to the point . Write down the equation of the transformed curve in the form
where is a constant to be found.
Was this exam question helpful?
The diagram shows the graph of . The marked points are and .
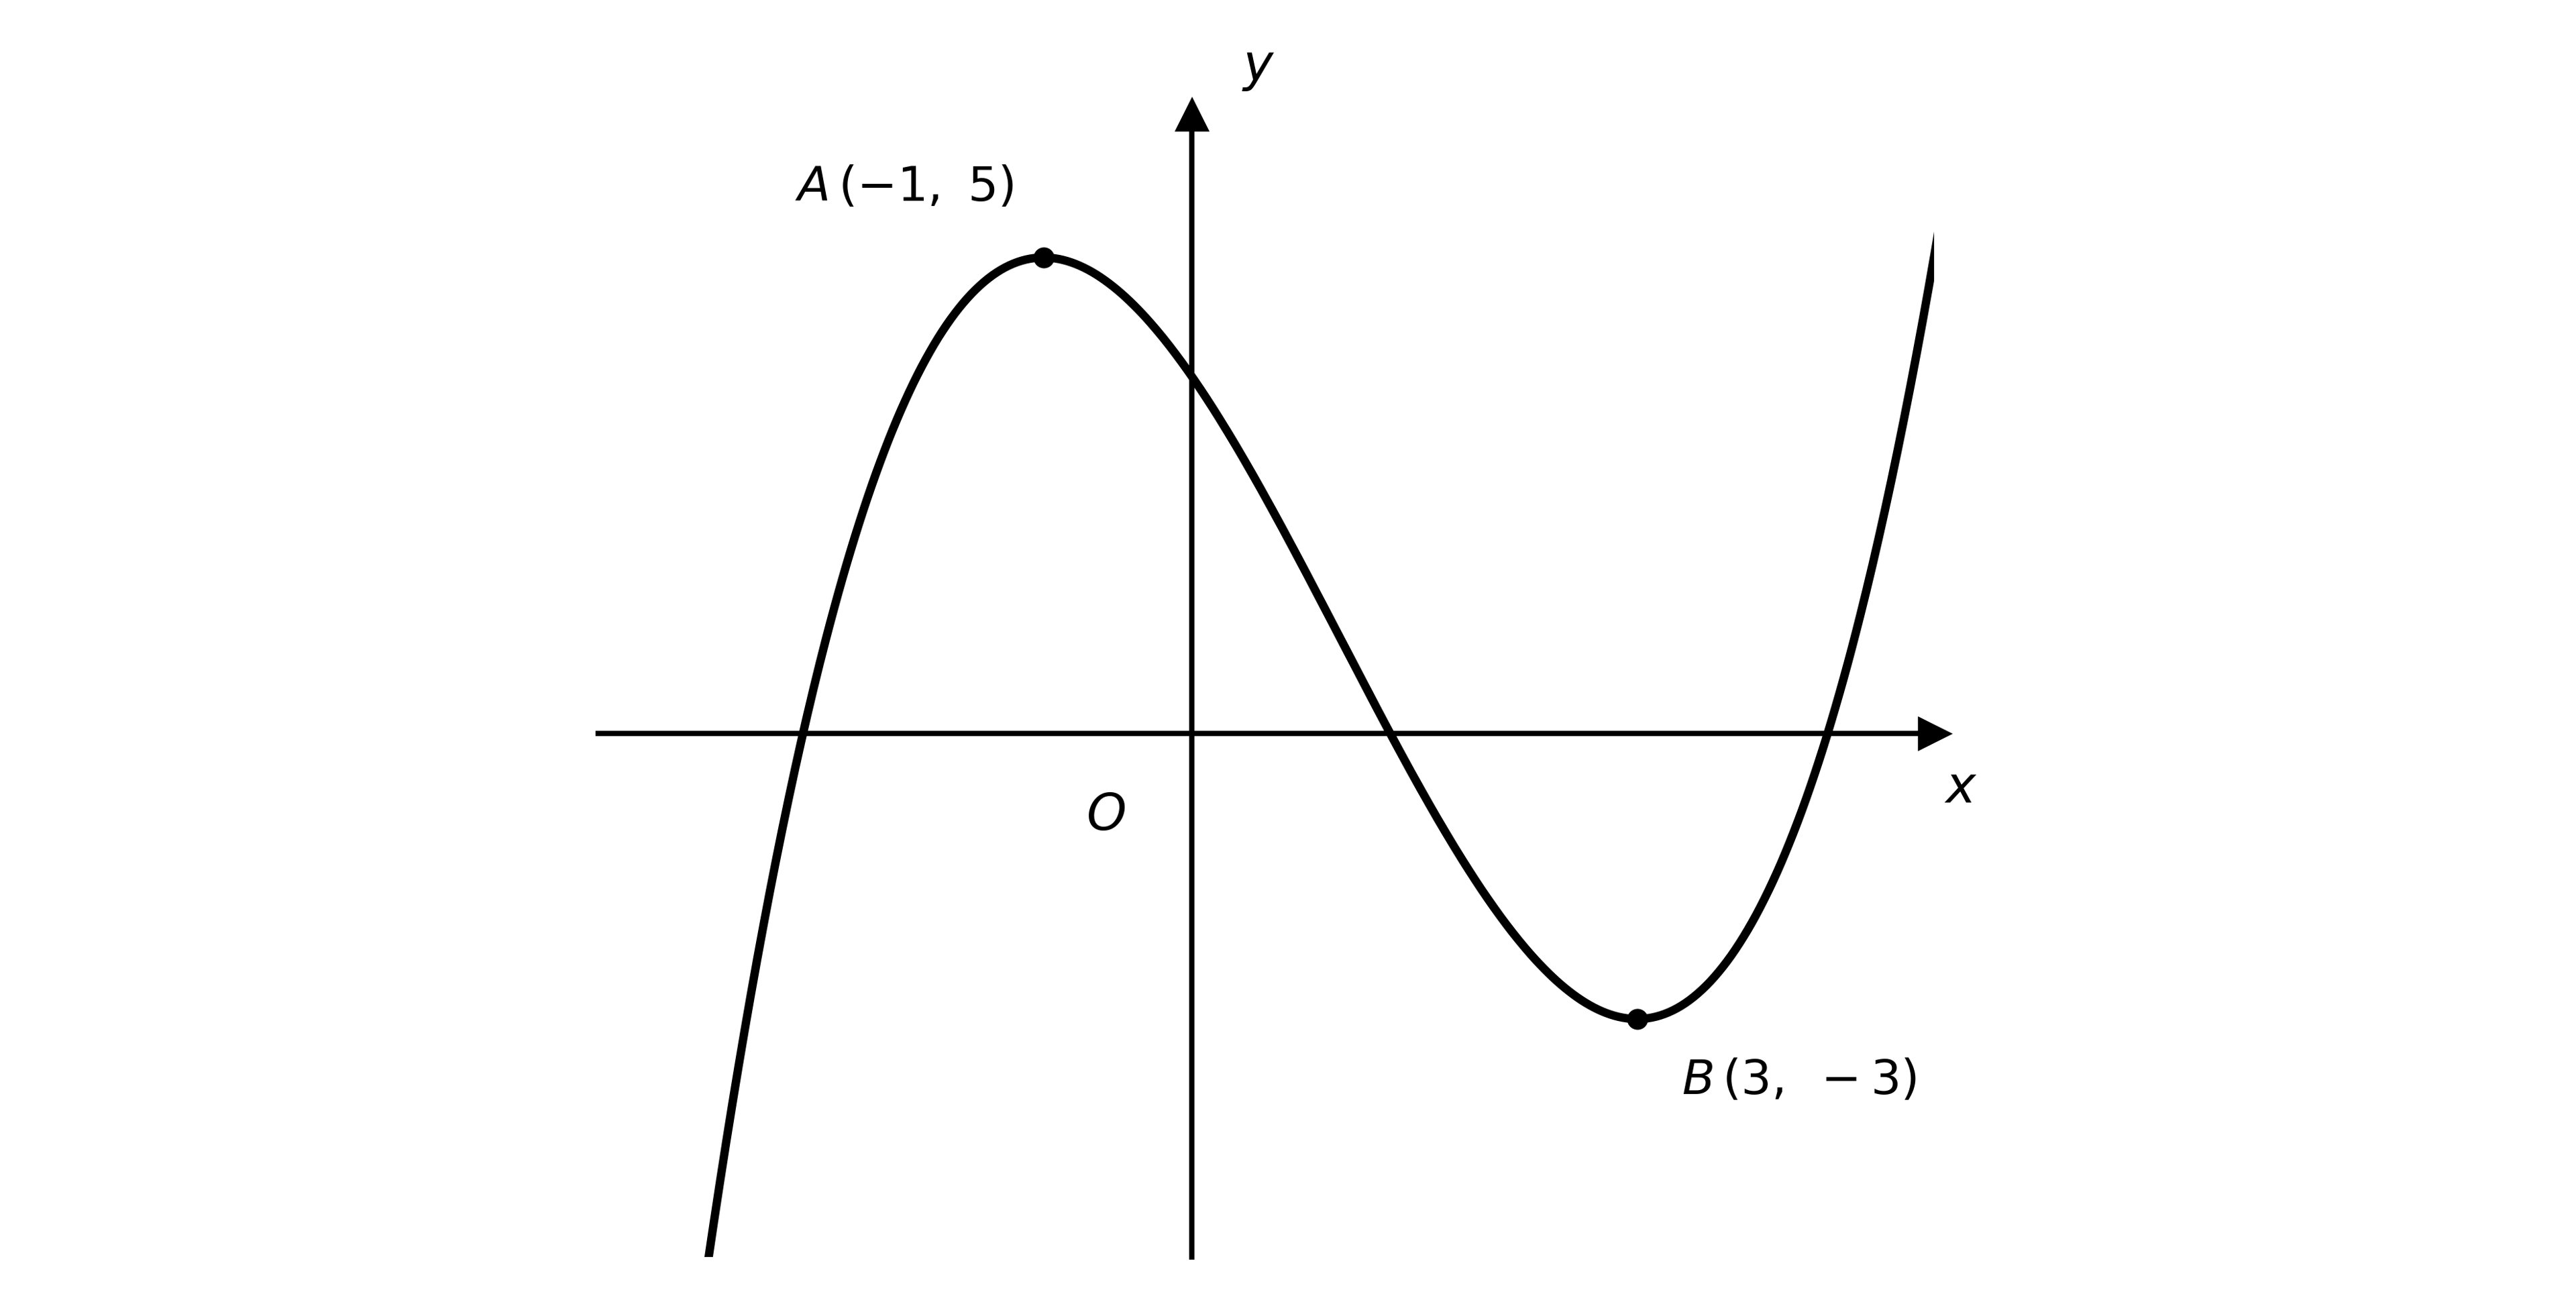
On separate diagrams, sketch the following curves, giving the coordinates of the images of and on each:
(i)
(ii)
On the graph of the images of the two marked points both lie on the same side of the -axis. Find the range of possible values of .
Was this exam question helpful?
The diagram shows the graph of . The marked point lies on the graph, and the graph meets the origin at the marked point .
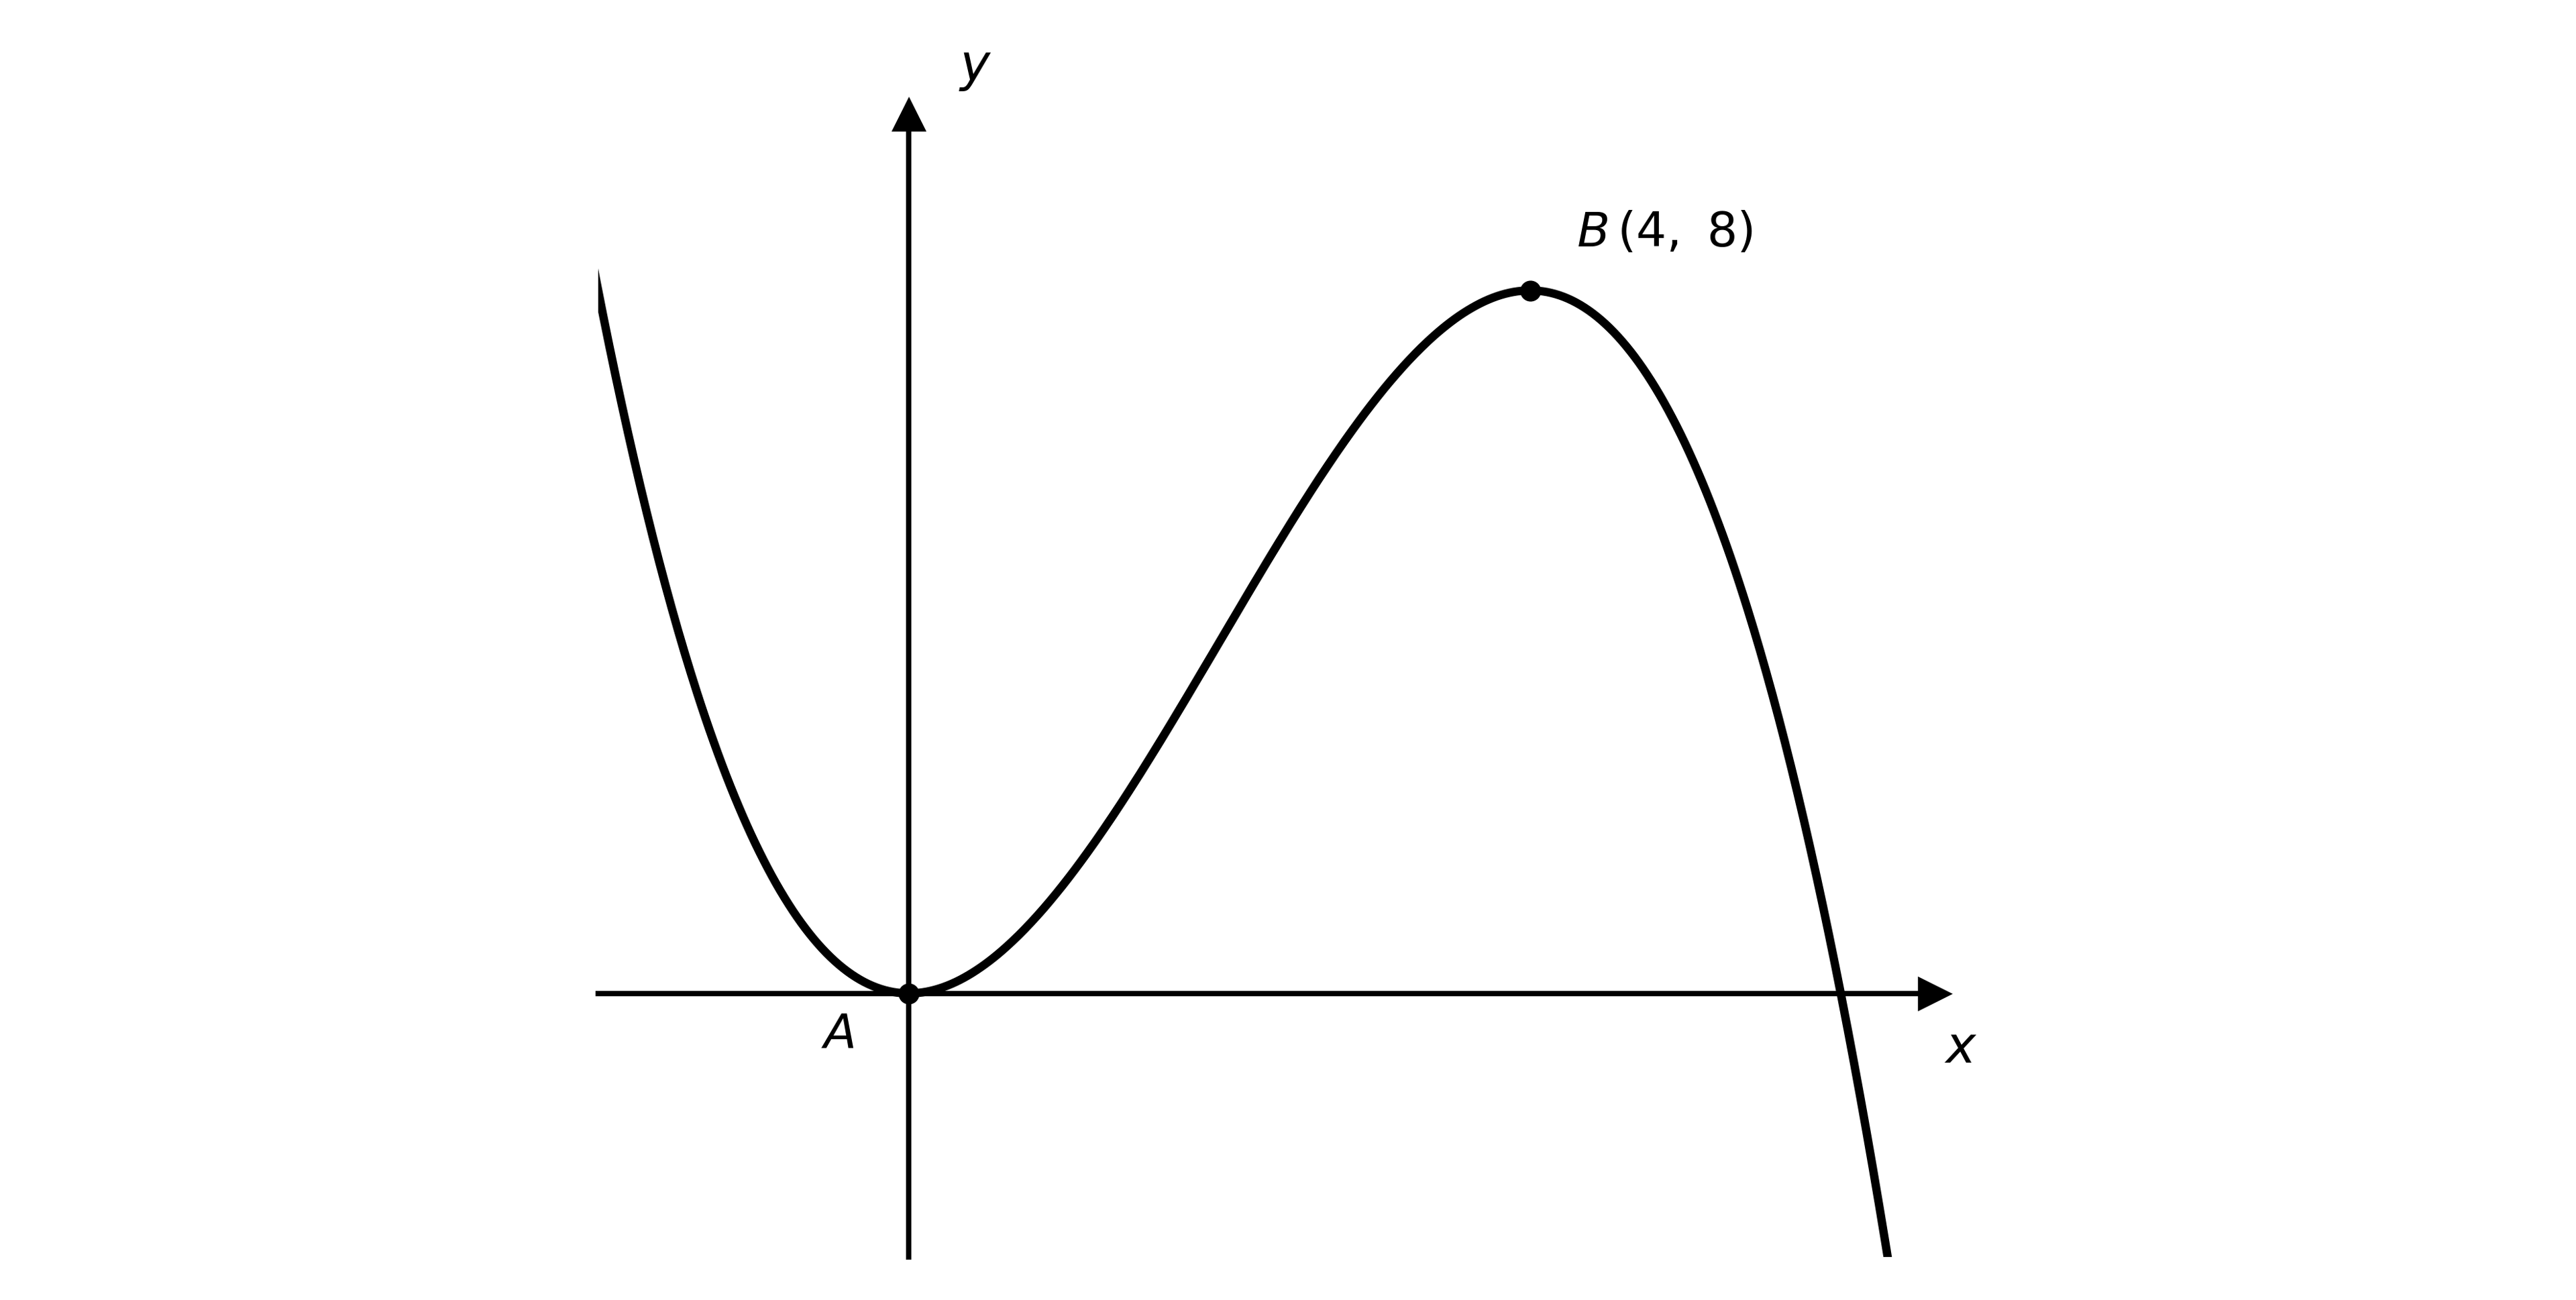
On separate diagrams, sketch the following curves, giving the coordinates of the images of and on each:
(i)
(ii)
Was this exam question helpful?
The diagram shows the graph of . The graph meets the coordinate axes at the marked points and , and has asymptotes with equations and .
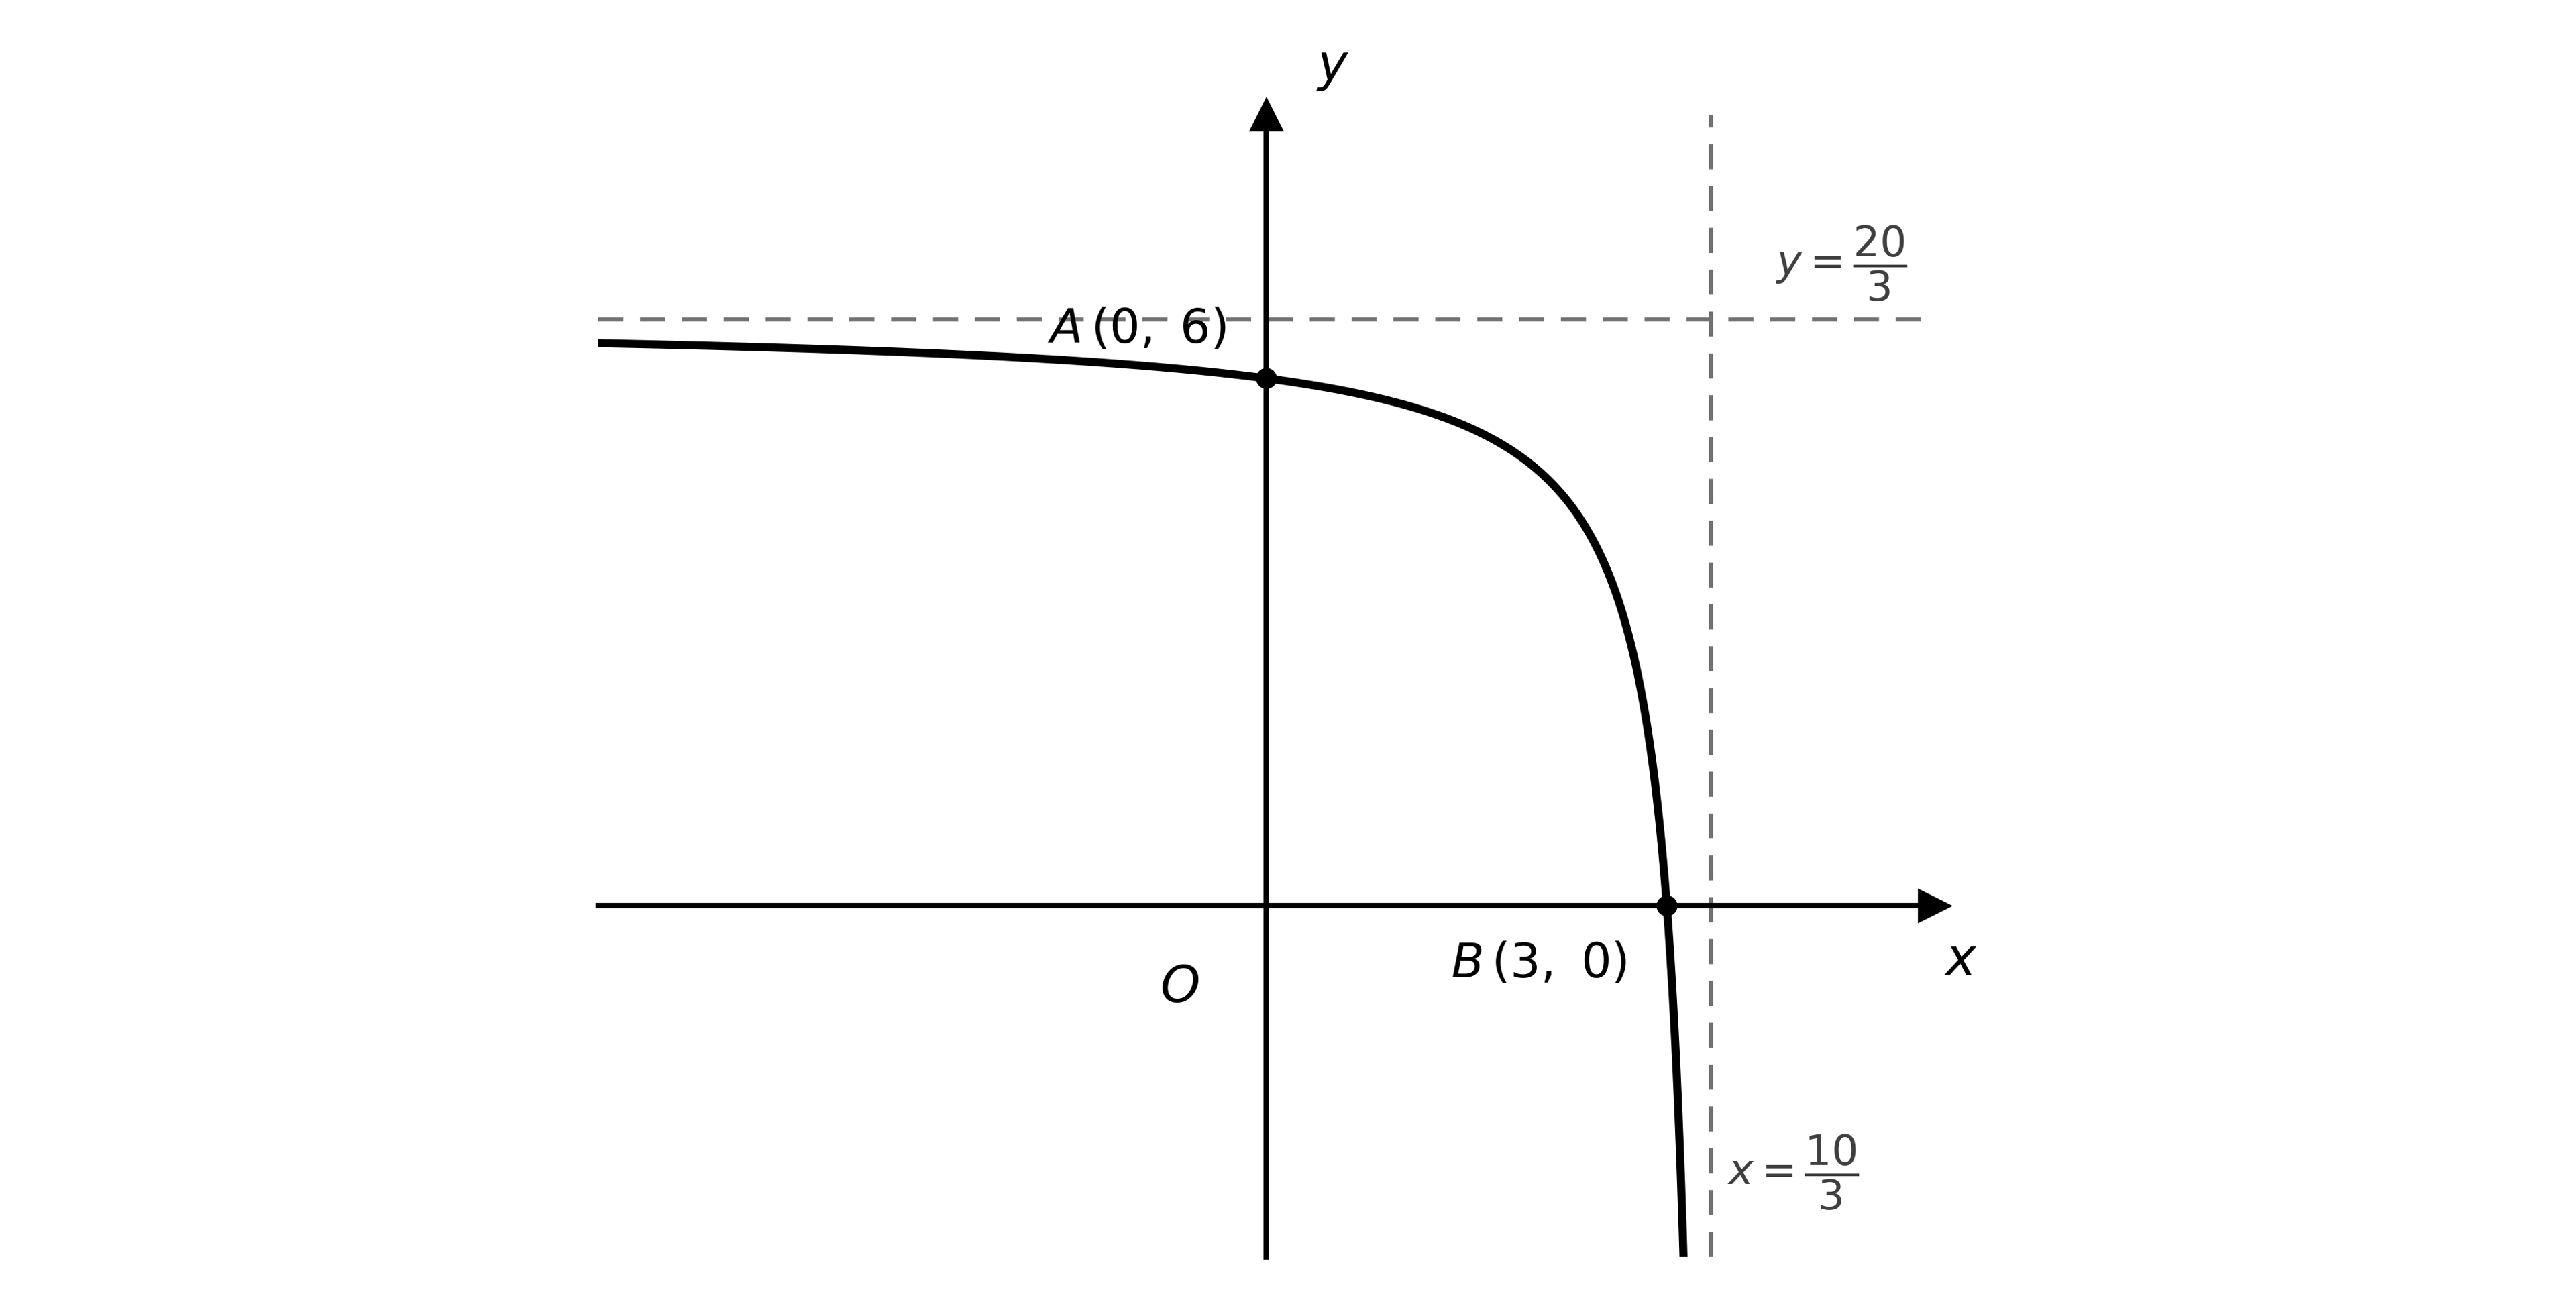
On separate diagrams, sketch the following curves, giving the coordinates of the images of and and the equations of the transformed asymptotes:
(i)
(ii)
The graph of has an asymptote with equation . Find the value of .
Was this exam question helpful?
Sketch the graph of , showing clearly the points where the curve crosses the coordinate axes and stating the equations of the asymptotes.
The graph of passes through the origin. Find the two possible values of .
Was this exam question helpful?
Given that
sketch the graph of , showing clearly the coordinates of the point where the curve crosses the -axis and the coordinates of any minimum points.
The curve crosses the -axis once; show this crossing in the correct position, but you are not required to find its coordinates.
(You do not need to state the coordinates of any maximum points.)
The graph with equation crosses the -axis three times. Find the range of possible values of .
Was this exam question helpful?
The curve with equation has two asymptotes, with equations and .
Give the equations of the asymptotes of each of the following curves:
(i)
(ii)
Was this exam question helpful?
The curve with equation has two asymptotes, with equations and .
Give the equations of the asymptotes of each of the following curves:
(i)
(ii)
Was this exam question helpful?
The curve with equation has two asymptotes, with equations and .
Give the equations of the asymptotes of each of the following curves:
(i)
(ii)
Was this exam question helpful?
The diagram shows the graph of . The marked point lies on the graph, and the graph meets the origin at the marked point .
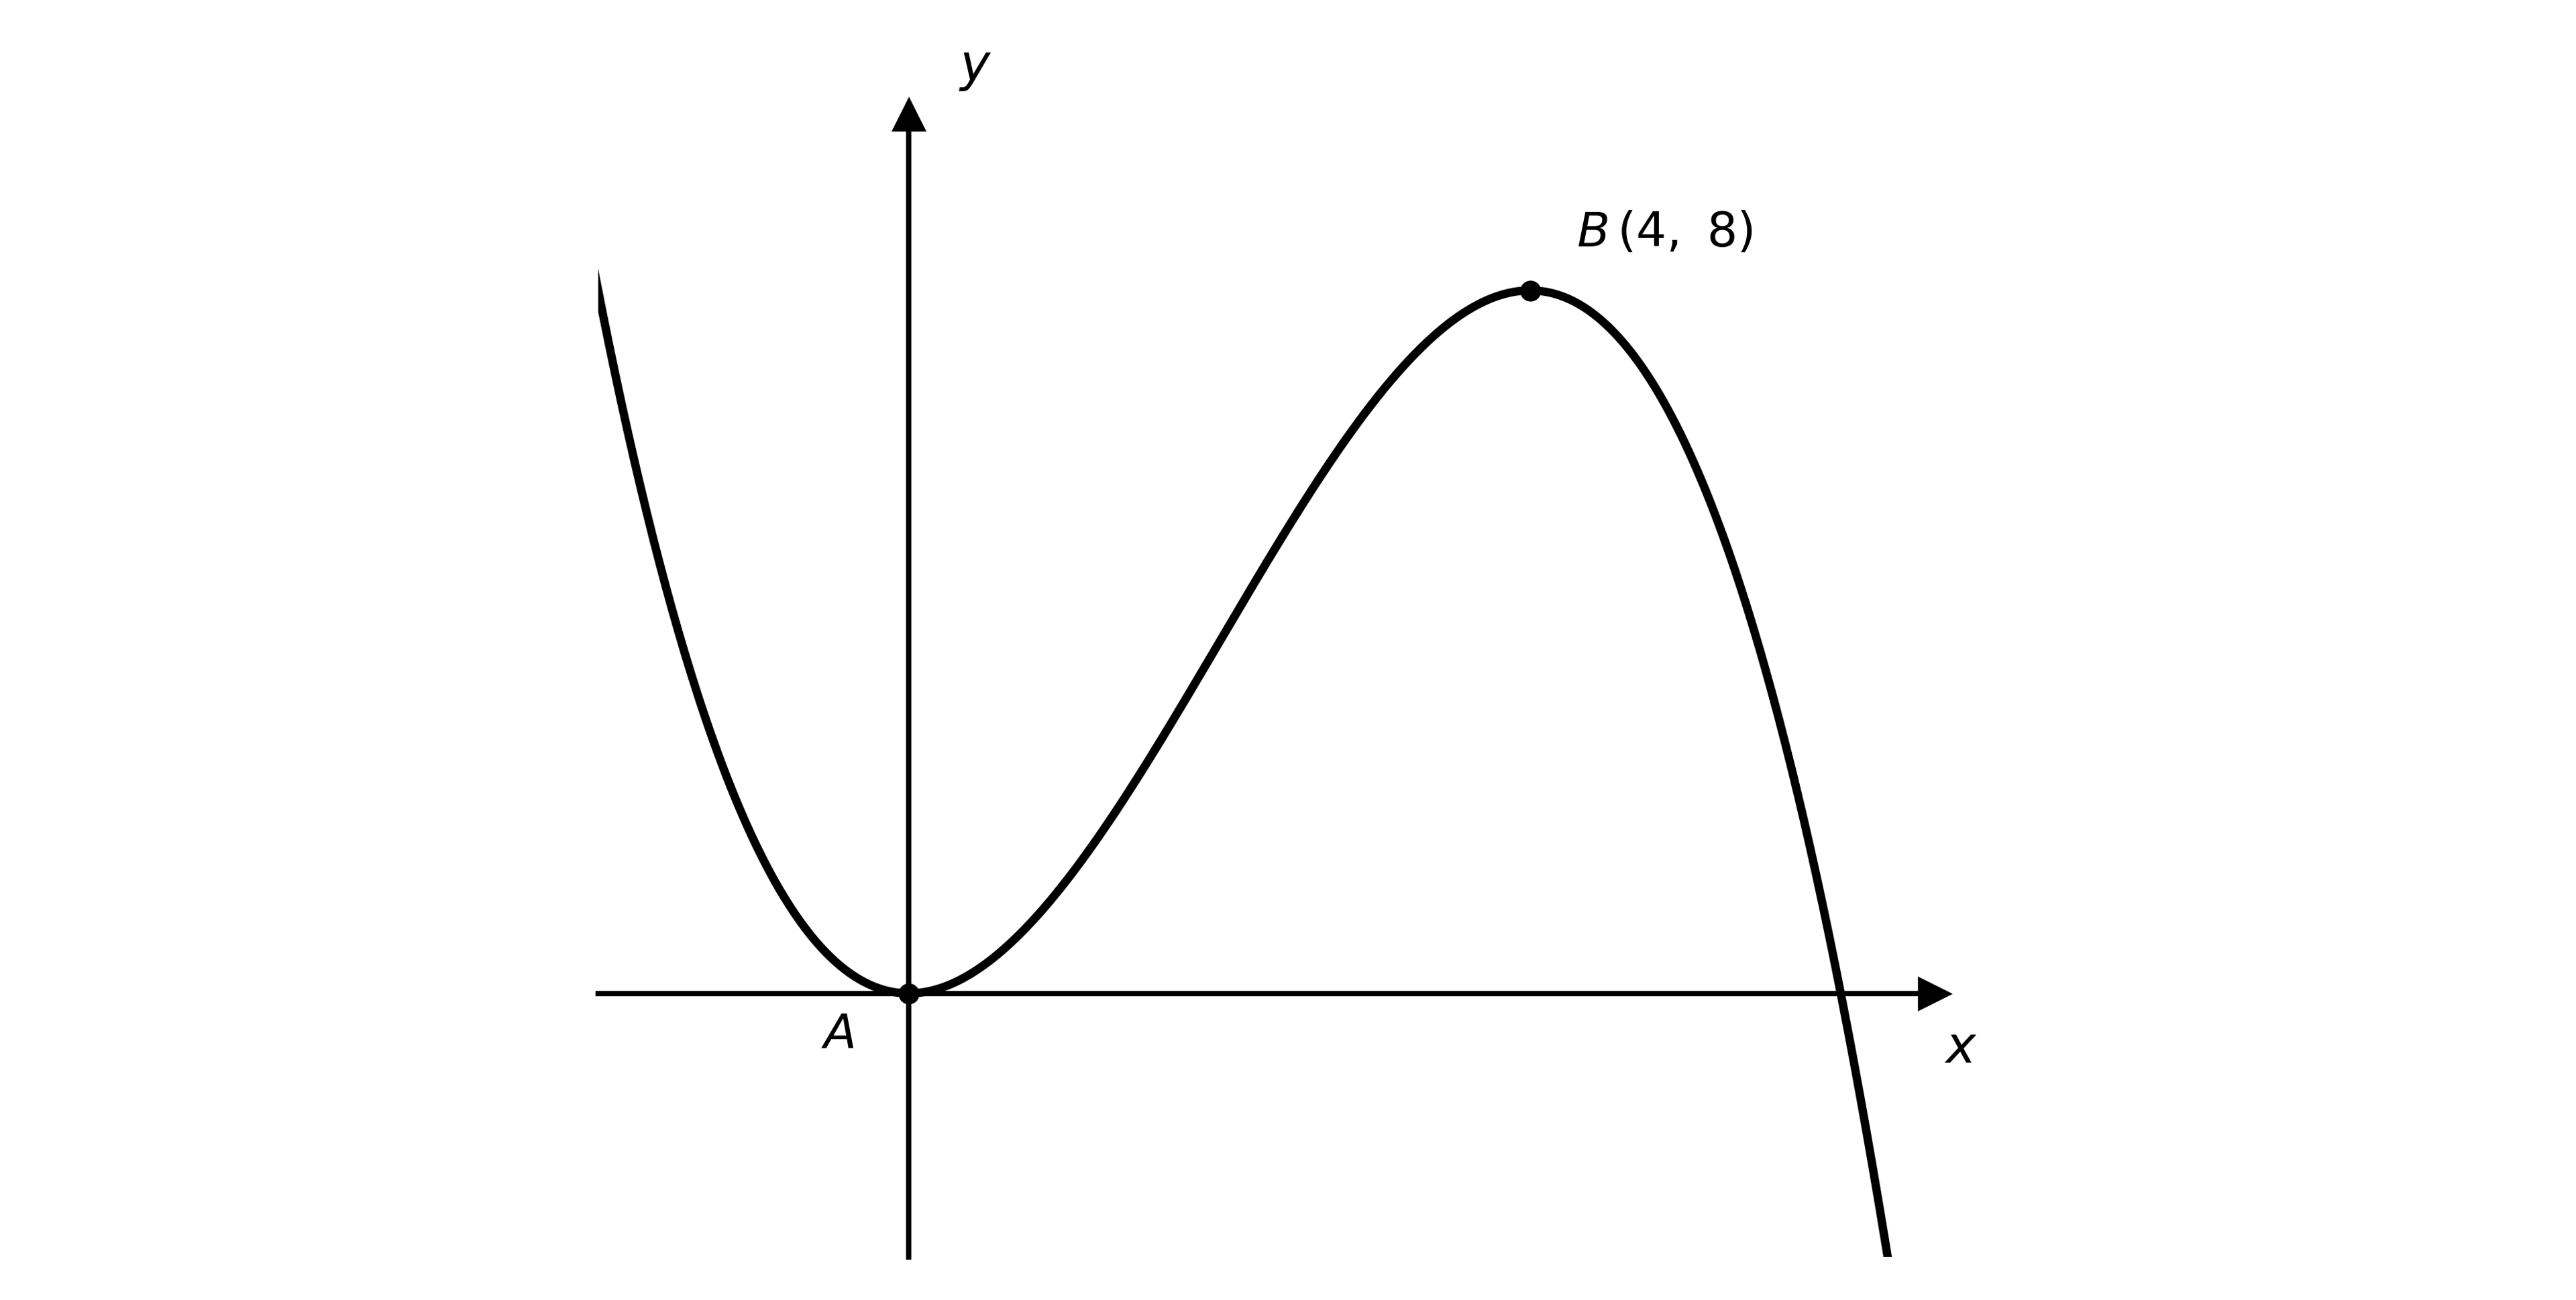
Consider the three transformations of the graph
where and are constants and .
State which of the transformations satisfies each of the following conditions, determining the range of possible values of or where relevant:
(i) the images of the two marked points lie on opposite sides of the -axis;
(ii) the image of point has coordinates , where ;
(iii) the image of point has coordinates , where .
Was this exam question helpful?
The diagram shows the graph of . The marked points are and .
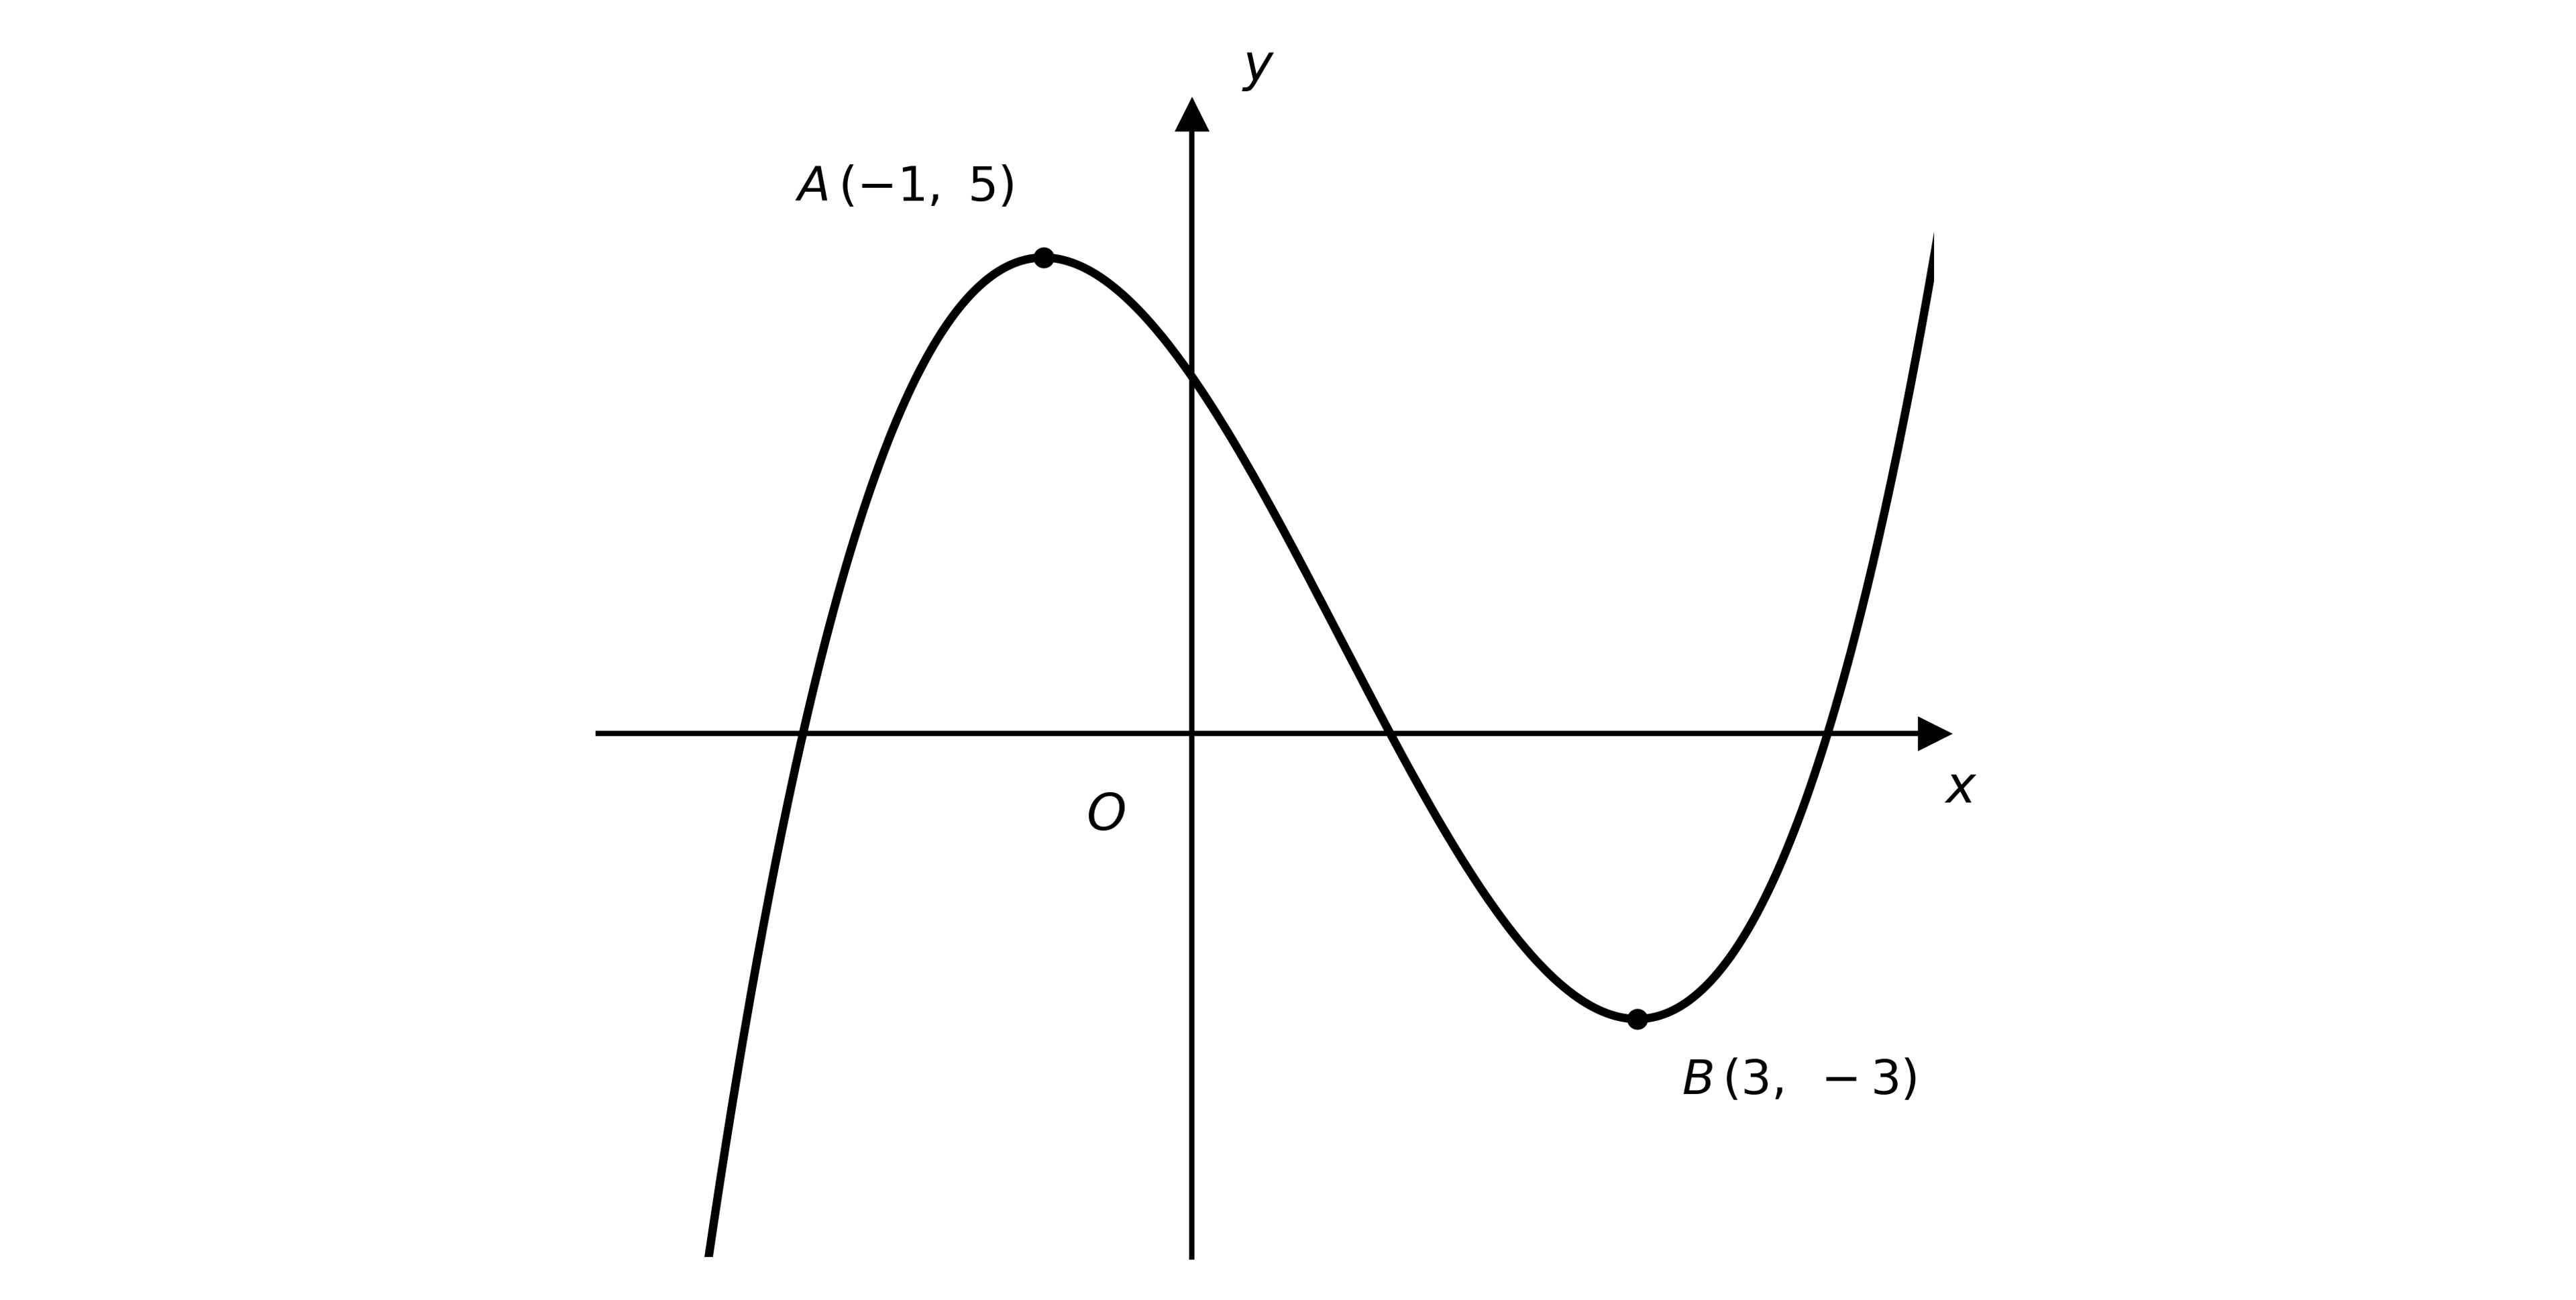
On separate diagrams, sketch the following curves, giving the coordinates of the images of and on each:
(i)
(ii)
On the graph of the image of one of the two marked points has an -coordinate of . Given that , find the value of .
Was this exam question helpful?
The diagram shows the graph of . The graph meets the coordinate axes at the marked points and , and has asymptotes with equations and .
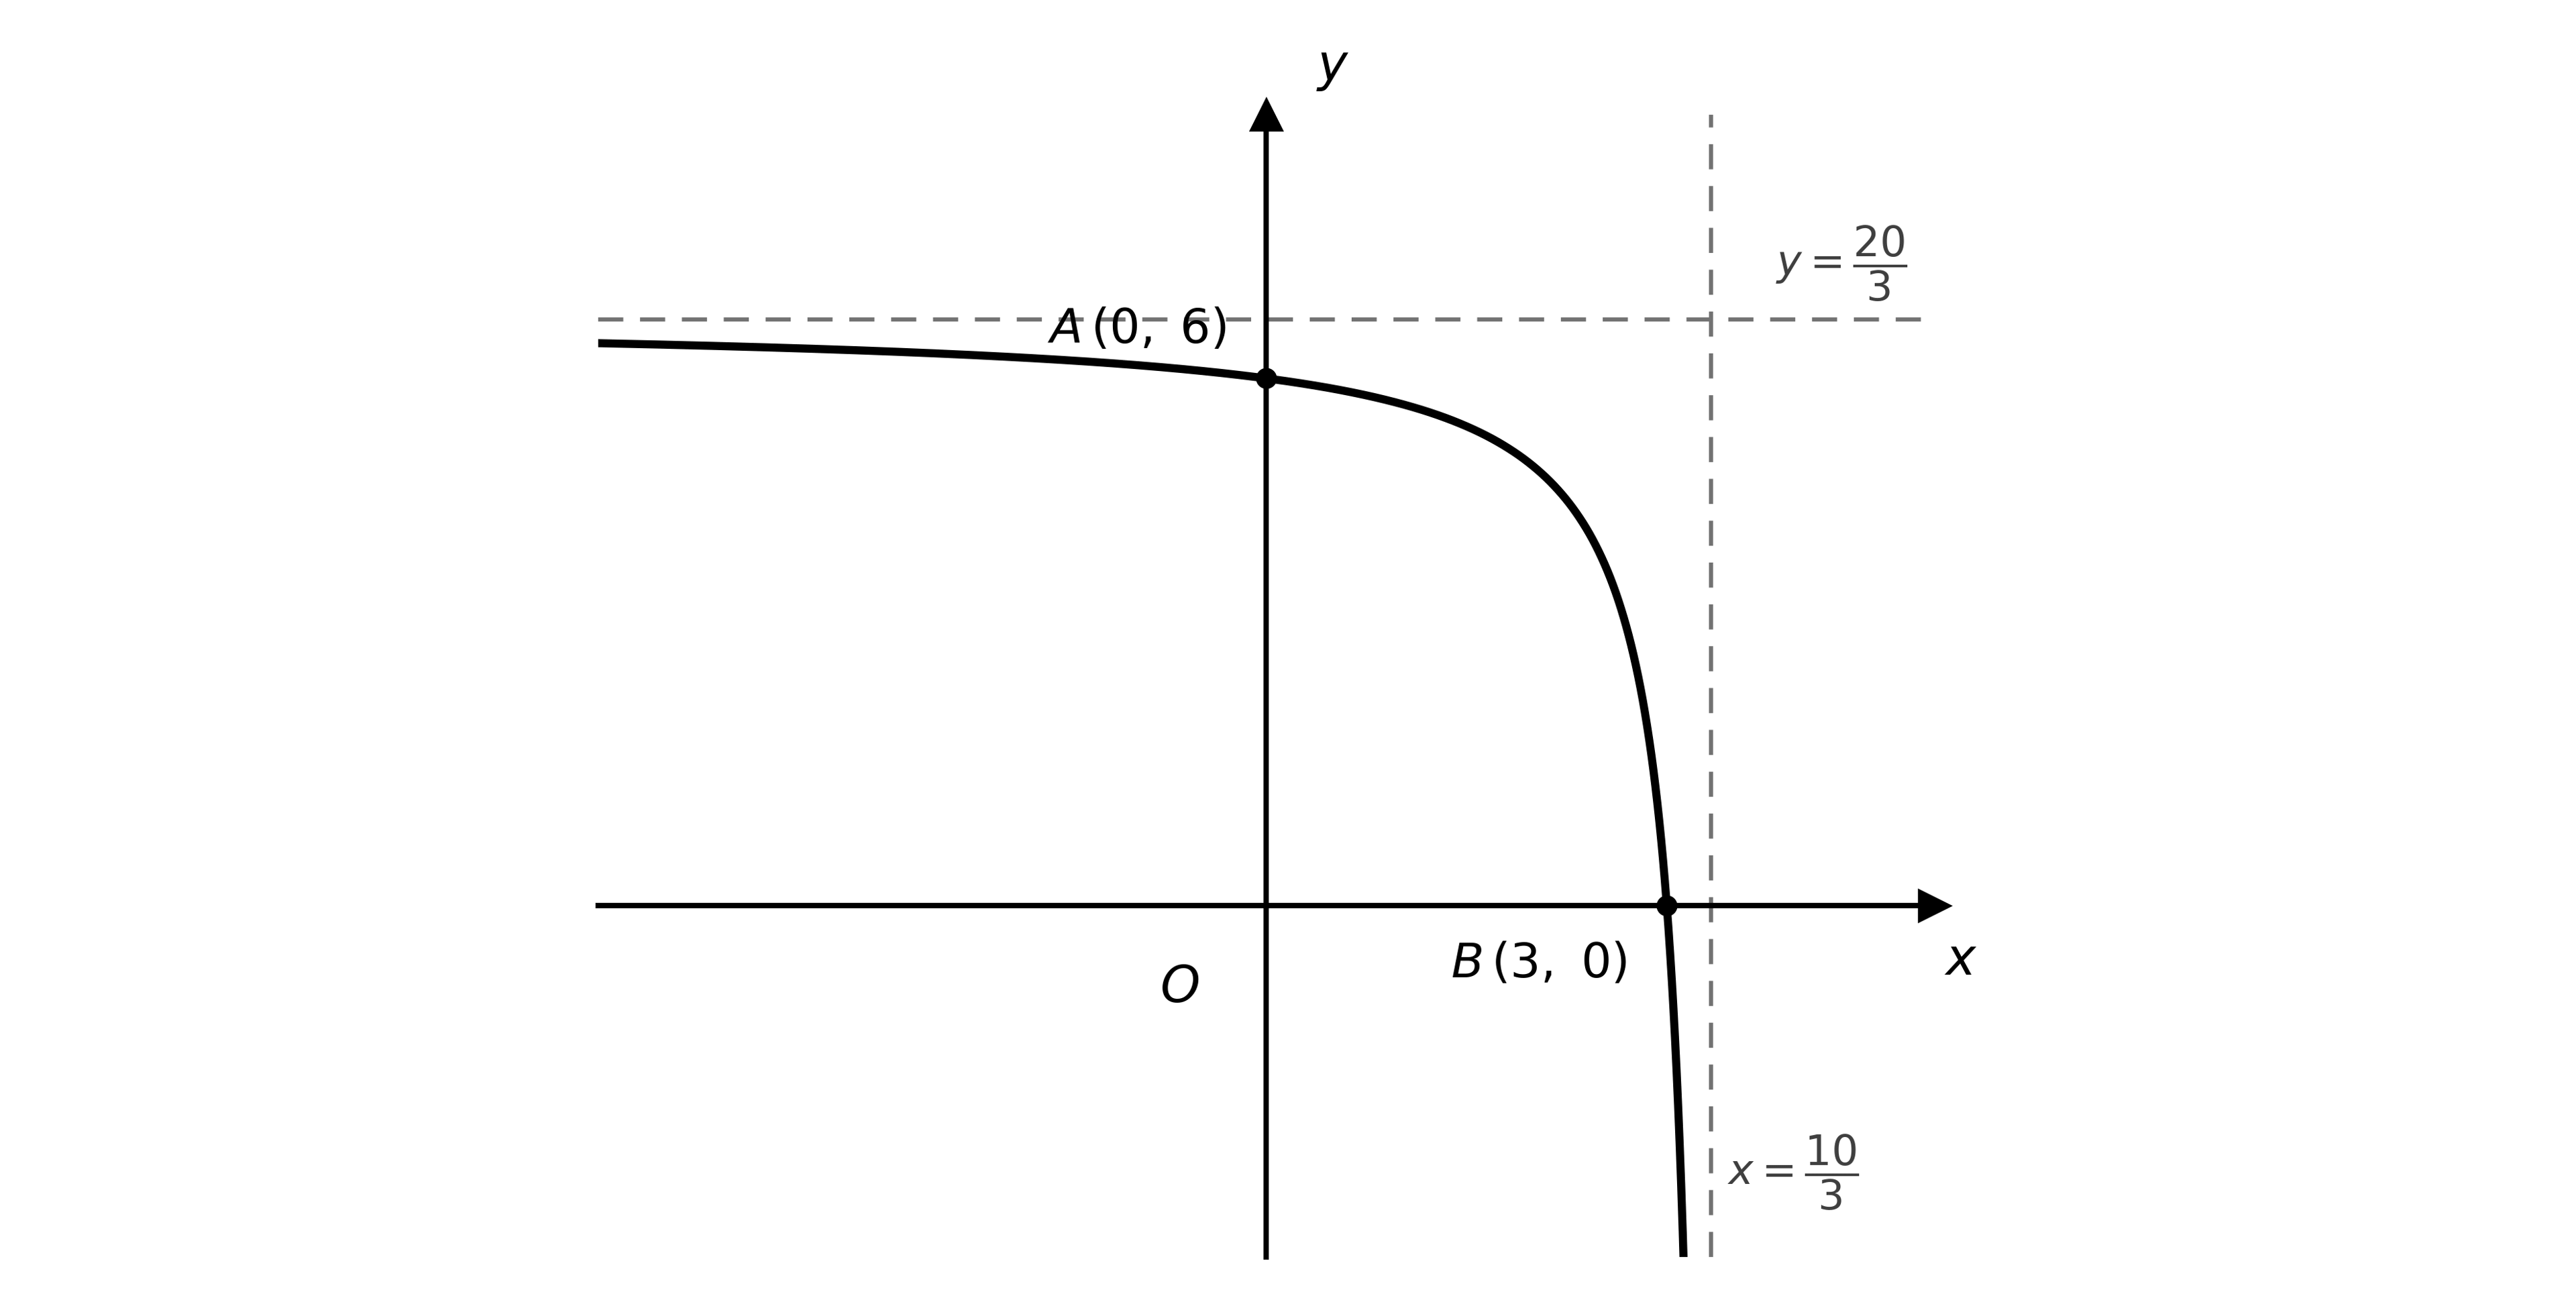
On separate diagrams, sketch the following curves, giving the coordinates of the images of and and the equations of the transformed asymptotes:
(i)
(ii)
The graph of has an asymptote with equation , where . Find the range of possible values of .
Was this exam question helpful?
The function is defined by
Sketch the graph of , showing clearly the points where the curve crosses the coordinate axes and stating the equations of the asymptotes.
The graph of is such that, for all points that lie on the graph, if the -coordinate is less than then the -coordinate is less than zero. Find the range of possible values of .
Was this exam question helpful?
The function is defined by
Sketch the graph of , showing clearly the coordinates of the points where the curve crosses or touches the coordinate axes.
The functions and are defined by
The graph of touches the -axis at the point . Find the exact value of .
Was this exam question helpful?