Costs (Edexcel A Level Economics A): Revision Note
Exam code: 9EC0

The Relationships Between Different Types of Costs
Fixed costs are costs that do not change as the level of output changes
These have to be paid whether output is zero or 5000
e.g. building rent, management salaries, insurance, bank loan repayments etc
Variable costs are costs that vary directly with output
These increase as output increases and vice versa
E.g. raw material costs, wages of workers directly involved in production
Marginal cost is the cost of producing an additional unit of output
Cost calculations
Based on the above definitions, we can calculate several different types of costs
Cost Calculations Using the Above Formulas
Output (Q) | TFC | TVC | TC = | AFC = | AVC = | AC = | MC = |
|---|---|---|---|---|---|---|---|
0 | 200 | - | - | - | - | - | - |
1 | 200 | 60 | 260 | 200 | 60 | 260 | 60 |
2 | 200 | 100 | 300 | 100 | 50 | 150 | 40 |
3 | 200 | 130 | 330 | 66.67 | 43.33 | 110 | 30 |
4 | 200 | 170 | 370 | 50 | 42.50 | 92.50 | 40 |
5 | 200 | 230 | 430 | 40 | 46 | 86 | 60 |
6 | 200 | 320 | 520 | 33.34 | 53.33 | 86.77 | 90 |
7 | 200 | 440 | 640 | 28.58 | 62.86 | 91.44 | 120 |
8 | 200 | 620 | 820 | 25 | 77.50 | 102.5 | 180 |
Short-run Cost Curves
Concepts That Help to Provide Understanding of How the Cost Curves Are Derived
Concept | Explanation |
|---|---|
Short-run | That period of time in which at least one factor of production is fixed. E.g. it is difficult to change machinery or the number of factories in the short run, but this can be achieved in the long run. The variable factor that is usually added to production is labour as it is easier to hire new workers |
Long-run | That period of time in which all of the factors of production are variable. This is also called the planning stage as firms can plan for increased capacity and production |
Marginal product of labour (MP) | The change in output that results from adding an additional unit of labour |
Law of diminishing marginal productivity | In the short run, as more of a variable factor (e.g. labour) is added to fixed factors (e.g. capital), there will initially be an increase in productivity. However, a point will be reached where adding additional units begins to decrease productivity due to the relationship between labour and capital |
In the short-run, the shapes of the cost curves (AC, AVC and MC) are determined by the law of diminishing marginal productivity
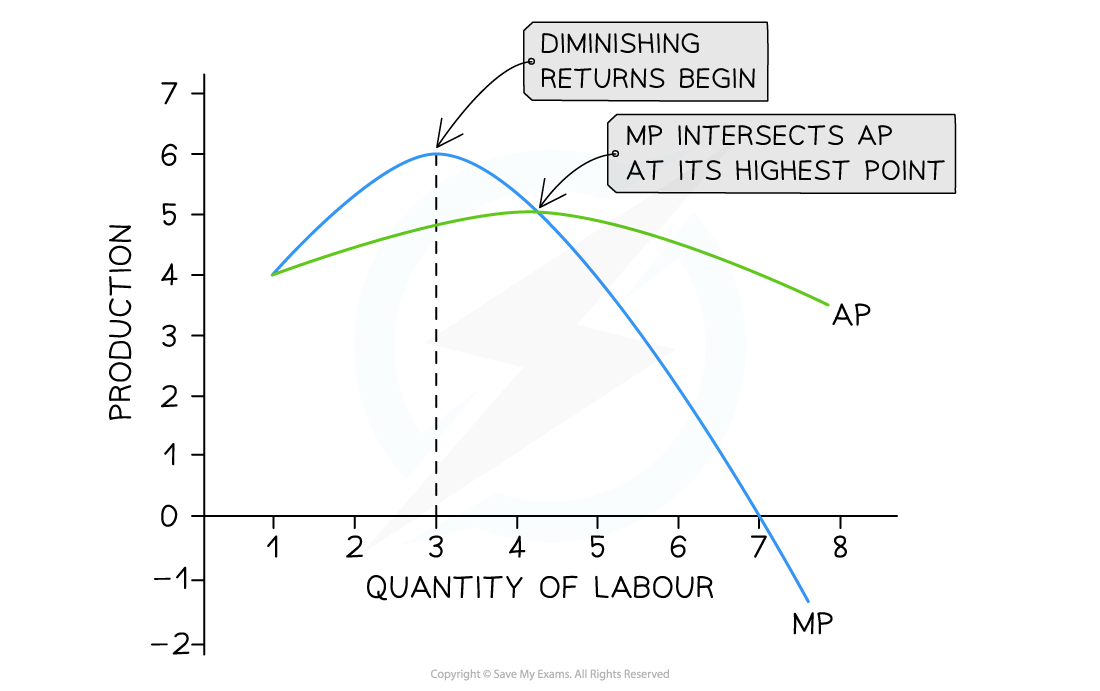
Diagram analysis
A small food van selling burgers (product) at a music festival increases productivity up to the addition of a third worker
After that, workers get in each other's way and there is not enough grill space (capital) so MP no longer increases
If more workers are hired, then the MP of each additional worker begins to fall
Adding additional workers up to the 7th worker will keep increasing the total product
With the hiring of the 7th worker, the MP turns negative, which will decrease the total product
Connection between diminishing marginal returns and the cost curves
As the marginal product increases, marginal costs decrease
There is an inverse relationship
Increasing returns = decreasing costs
Decreasing returns = increasing costs
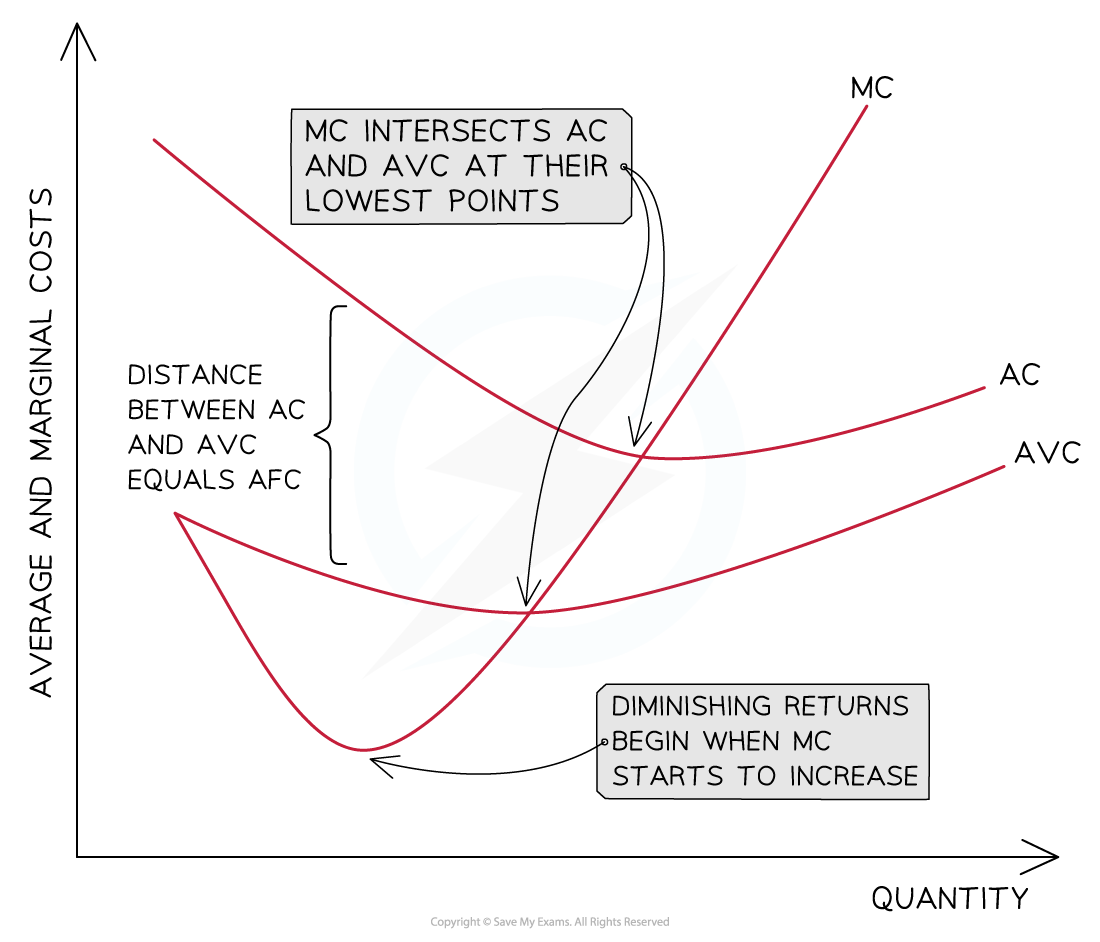
Diagram analysis
The distance between the AVC and AC = the AFC
AVC converges towards AC as the AFC continuously decreases with an increase in output
AVC decreases as additional workers are added and each worker produces additional product
Marginal costs (MC) decrease initially as additional workers are added and the marginal product is increasing
Diminishing returns begin when the MC starts to increase
MC will cross the AVC and AC curves at their lowest point
As long as the cost of producing the next unit (MC) is lower than the average, it will pull down the average
When the cost of producing the next unit (MC) is higher than the average, it will pull up the average
Short-run and Long-run Average Costs Curves
Day-to-day operations of a firm occur in the short-run
In the long-run, they are able to plan to increase the scale of production
E.g by increasing the size of the factory
Larger scale = more output and the firm moves onto a new SRAC curve in which the average unit costs are lower
In the long-run, a growing firm is likely to keep repeating this process.
Each time a more efficient SRAC is generated
The long-run average cost curve (LRAC) is the line of best fit between the lowest points of the short-run ATC curves


Unlock more, it's free!
Join the 100,000+ Students that ❤️ Save My Exams
the (exam) results speak for themselves:

Was this revision note helpful?
Build on this topic