1
3 marks
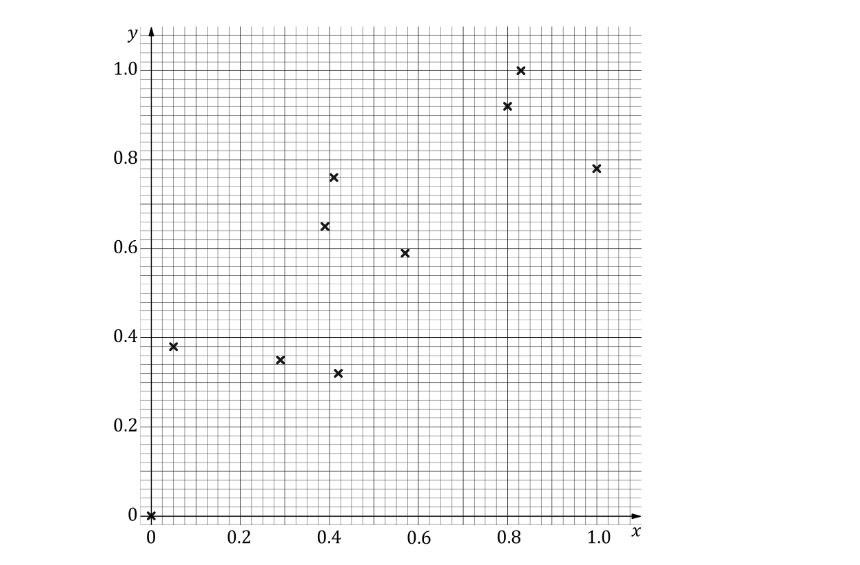
A teacher is interested in the relationship between the number of hours her students spend on a phone per day and the number of hours they spend on a computer. She takes a sample of nine students and records the results in the table below.
Hours spent on a phone per day | 7.6 | 7 | 8.9 | 3 | 3 | 7.5 | 2.1 | 1.3 | 5.8 |
Hours spent on a computer per day | 1.7 | 1.1 | 0.7 | 5.8 | 5.2 | 1.7 | 6.9 | 7.1 | 3.3 |
(i) Plot a scatter diagram of this data on the axes below.
(ii) Describe the linear correlation shown in your diagram.
(iii) Interpret the correlation in the context of the question.

Was this exam question helpful?