PMCC & Non-linear Regression (Edexcel A Level Maths: Statistics): Revision Note
Exam code: 9MA0

Product moment correlation coefficient (PMCC)
What is the product moment correlation coefficient?
The product moment correlation coefficient (PMCC) is a way of giving a numerical value to linear correlation of bivariate data
The PMCC of a sample is denoted by the letter
can take any value such that
A positive value of describes positive correlation
A negative value of describes negative correlation
If there is no correlation
means perfect positive correlation and means perfect negative correlation
The closer to 1 or -1, the stronger the correlation
The gradient does not change the value of

How is the product moment correlation coefficient calculated?
You must learn how to use your calculator to calculate value of the PMCC, for the relationship between two variables
All calculators are different and you should make sure you can calculate the PMCC on your personal calculator
Make sure you know how put your calculator into the statistics mode
You will be given the option to turn the frequency on or off, choose off for most calculations of the PMCC
With the statistics mode switched on on your calculator, there will be a ‘statistics’ option, followed by a regression option in the form A + BX
Your calculator will give you two columns into which you can input the and data values
Once the data has been entered into your calculator, choose the ‘r’ value from the ‘STAT’ options
Worked Example

Three scatter diagrams, showing observations from different bivariate data sets, are shown above.
(i) Match each of the three scatter diagrams show above to one of the values of given below. You should use each given value of no more than once.
Answer:
(ii) Sketch a scatter diagram for the remaining value of listed above.
Answer:

Non-linear regression
You have learned how to use linear regression models to describe a relationship between two variables. However, it is possible for two variables to have a relationship that does not fit a linear model, but still shows a pattern based on exponential growth or decay. A linear regression model is only appropriate if the PMCC is close to 1 or -1.
What are non-linear regression models?
If a bivariate data set appears to have a non – linear relationship it could fit an exponential model
A non – linear regression model could take the form or where a, n, k and b are constants
It is possible to use logarithms to rearrange the non – linear form of the model to obtain a linear regression model which can then be used to examine trends in the data
If the regression model takes the form the data should be coded from - values to - values using and
If for constants a and n, then
Plotting against will give a linear graph
The y – intercept would be and the gradient of the line would be n
This can be shown by taking logarithms of both sides
If the regression model takes the form the data should be coded from values to values using and
If for constants k and b , then or
Plotting against will give a linear graph
The y – intercept would be and the gradient of the line would be
This can be shown in the same way by taking logarithms of both sides
For example:
Take logarithms of both sides
Use the addition law for logarithms
Use the power law for logarithms
Using logarithms to code the data in this way is called changing the variables
How do I use non–linear regression models?
Non – linear regression models can be used in much the same way as linear regression models
By coding the original data using logarithms (changing the variables) a regression line of Y on X can be found
This can be used to make predictions for data values that are within the range of the given data (interpolation)
Making a prediction outside of the range of the given data is called extrapolation and should not be done
The non – linear regression model can then be found by substituting and back into the X and Y values in the regression line and rearranging
Worked Example
The graph below shows the distribution of the height, m, of a group of children and the amount of time, hours, they spend napping in the day. It is believed the data can be modelled using the form .

The data are coded using the changes of variables and . The regression line of on is found to be .
(i) Find the values of and for a child that is 75 cm tall and naps for 4 hours per day, giving your answers to four decimal places.
(ii) Using the regression line, show that a child of height 0.9 metres would be expected to nap for approximately 1.45 hours per day.
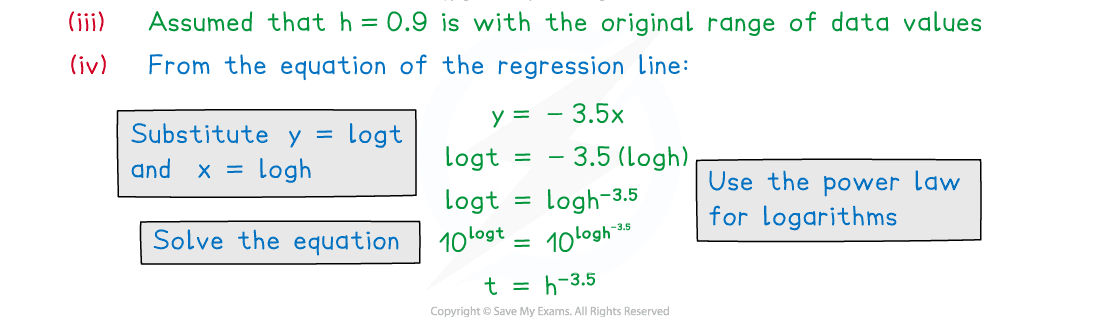
(iii) State an assumption that was made in order to justify the use of the regression line in part (ii).
(iv) By first substituting for and for in the equation of the regression line given, show that the relationship between the height of a child and the time they spend sleeping can be modelled by .
Answer:

Examiner Tips and Tricks
Be careful when using original and coded data interchangeably, it is easy to forget which one you are working with. Remember that if your regression line was calculated using coded data then you will need to reverse this if finding predictions. Make sure that you are familiar with using logarithms, indices and their laws. Be careful to check which base logarithms were used for coding the data, if was used then it is reversed using , but is was used then it should be reversed using .

Unlock more, it's free!
Join the 100,000+ Students that ❤️ Save My Exams
the (exam) results speak for themselves:

Was this revision note helpful?
Build on this topic
