Glaciers as Natural Systems (AQA AS Geography): Exam Questions

Exam code: 7036

14 mins4 questions
1
6 marks

Figure 3 shows information about the cumulative change in glacial mass of six European glaciers compared to 1945 levels.

The change in ice mass is measured in cubic metres (m3) of water equivalent. On the y-axis ‘0’ represents glacial mass in 1945.
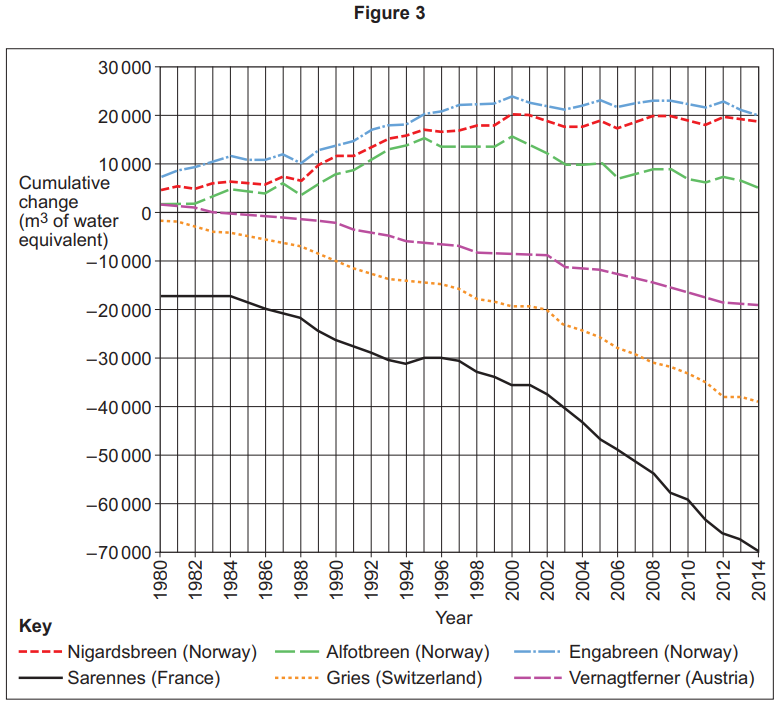
Graph showing cumulative change in glacier mass for six glaciers from 1980 to 2014. Nigardsbreen, Engabreen increase; others decrease significantly.

Analyse the information shown in Figure 3.

2
1 mark

Which of the following outlines a positive feedback in cold environments?

  • Atmosphere warms up more vegetation grows in warmer environments CO2 removed from atmosphere reduces warming.

  • Atmosphere warms sea ice melts more sunlight allows phytoplankton to photosynthesise more in oceans CO2 removed from atmosphere limits atmospheric warming.

  • Sea ice melts darker surfaces exposed less solar radiation reflected more insolation absorbed temperatures rise more melting.

  • Temperatures rise increased evaporation of water increased cloud formation more precipitation falls as snow snow reflects incoming solar radiation less warming.

3
1 mark

In systems in physical geography, which of the following correctly defines negative feedback?

  • Changes in a system amplify, or speed up, the impacts of an initial action.

  • Changes in a system decrease, or slow down, the impacts of an initial action.

  • When there is a balance between the inputs and outputs of a system.

  • When there is a transfer of energy beyond the boundary of the system.

4
6 marks

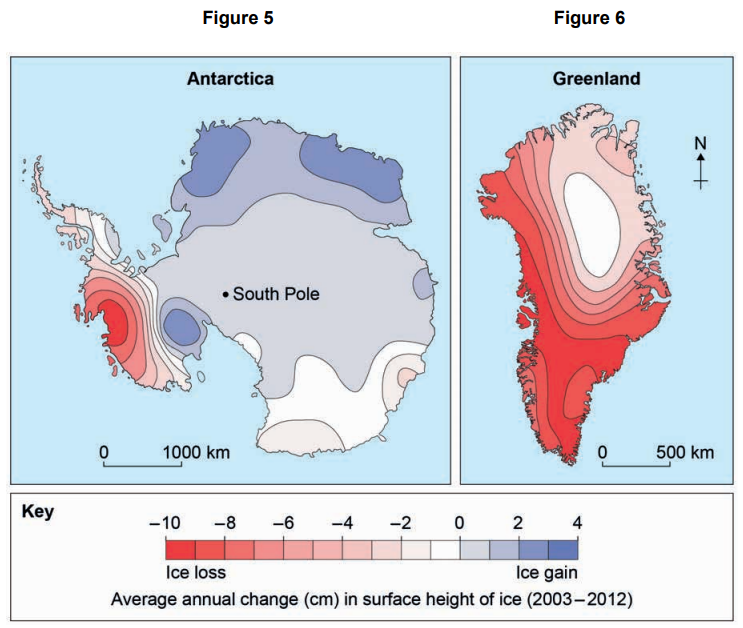
Figure 5 and Figure 6 provide information about changes to the amount of ice in Antarctica and Greenland.

Comparison maps showing average annual change in ice height from 2003-2012; Antarctica experiences mixed changes, Greenland uniformly loses ice.

Analyse the data shown in Figure 5 and Figure 6.