The Rate & Extent of Chemical Change (AQA GCSE Combined Science: Synergy: Physical Sciences): Exam Questions

Exam code: 8465

2 hours18 questions
1a
1 mark

Magnesium reacts with hydrochloric acid.

A student investigated the effect of changing the hydrochloric acid concentration on the rate of this reaction.

Figure 2 shows the apparatus.

Figure 2
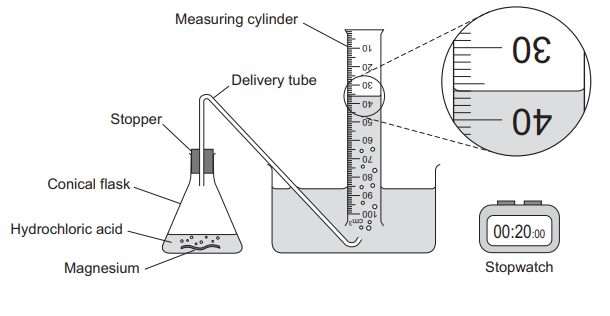
Diagram showing apparatus: conical flask with stopper and delivery tube connected to a measuring cylinder for gas collection, with a stopwatch

This is the method used.

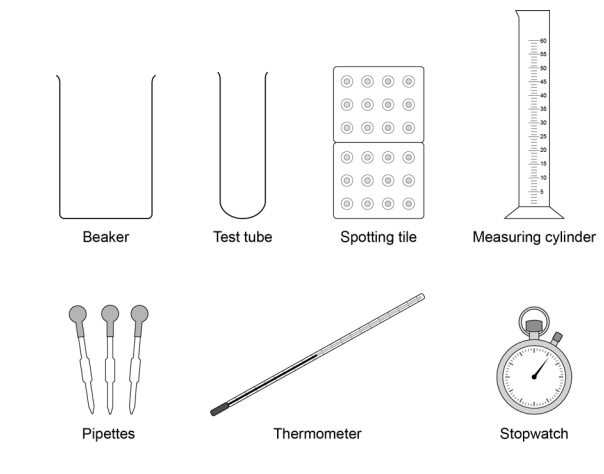
  1. Add 50 cm³ of hydrochloric acid to the conical flask.

  2. Add a 3 cm strip of magnesium to the hydrochloric acid in the conical flask.

  3. Fit the stopper and delivery tube to the top of the conical flask and start timing.

  4. Record the volume of hydrogen gas collected in the measuring cylinder every 20 seconds for a total of 100 seconds.

  5. Repeat steps 1 to 4 with a different concentration of hydrochloric acid.

What volume of hydrogen gas has been collected in the measuring cylinder in Figure 2?

1b
2 marks

The stopper and delivery tube were fitted to the conical flask in step 3.

Explain why the time taken to fit the stopper and delivery tube may cause an error in this investigation.

1c
1 mark

Figure 3 shows the results for one concentration of hydrochloric acid.

Figure 3
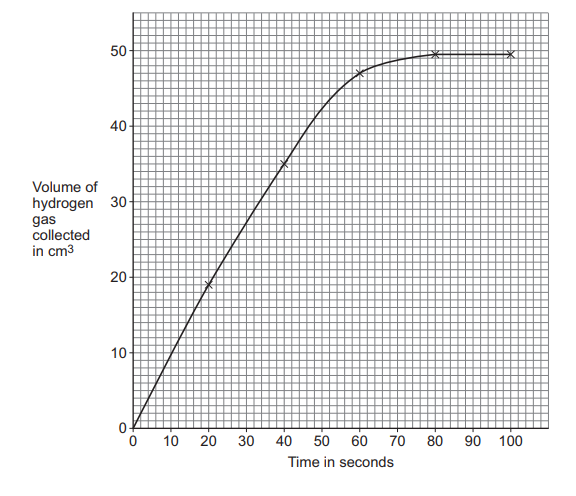
Graph showing volume of hydrogen gas collected in cm³ (y-axis, 0–50) against time in seconds (x-axis, 0–100). The curve rises steeply at first then levels off at approximately 45 cm³ around 80 seconds.

Determine the time taken for the reaction to be complete.

Use Figure 3.

1d
1 mark

The student repeated the method using a higher concentration of hydrochloric acid.

How would the line of best fit for a higher concentration of hydrochloric acid compare with the line of best fit on Figure 3?

Select your answer.

  • Initially the line of best fit would have a lower gradient.

  • Initially the line of best fit would have the same gradient.

  • Initially the line of best fit would have a higher gradient.

2a
1 mark

How must the apparatus for the reaction be designed so that dynamic equilibrium can be reached?

2b
2 marks

Explain what happens to the relative amounts of nitrogen, hydrogen and ammonia after dynamic equilibrium has been reached.

3a
1 mark

How does the equation show that the reaction is reversible?

3b
1 mark

When does a reversible reaction reach dynamic equilibrium?

  • When the forward reaction is slower than the reverse reaction.

  • When the forward reaction and the reverse reaction have the same rate.

  • When the forward reaction is faster than the reverse reaction.

3c
1 mark

How must the apparatus for the reaction be designed so that dynamic equilibrium can be reached?

  • So all of the substances can escape.

  • So none of the substances can escape.

  • So only ammonia and hydrogen chloride can escape.

4a
Sme Calculator
5 marks

Hydrogen bromide decomposes to form hydrogen and bromine.

The equation for the reaction is:

2HBrH2+Br2

The energy needed to break the existing bonds is 103 kJ/mol greater than the energy released in forming new bonds.

TABLE 3 shows some bond energy values.

TABLE 3

Bond

Bond energy in kJ/mol

H–Br

Y

H–H

436

Br–Br

193

Y is the bond energy of a H–Br bond.

Calculate Y. [5 marks]

Y = _________________ kJ/mol

4b
4 marks

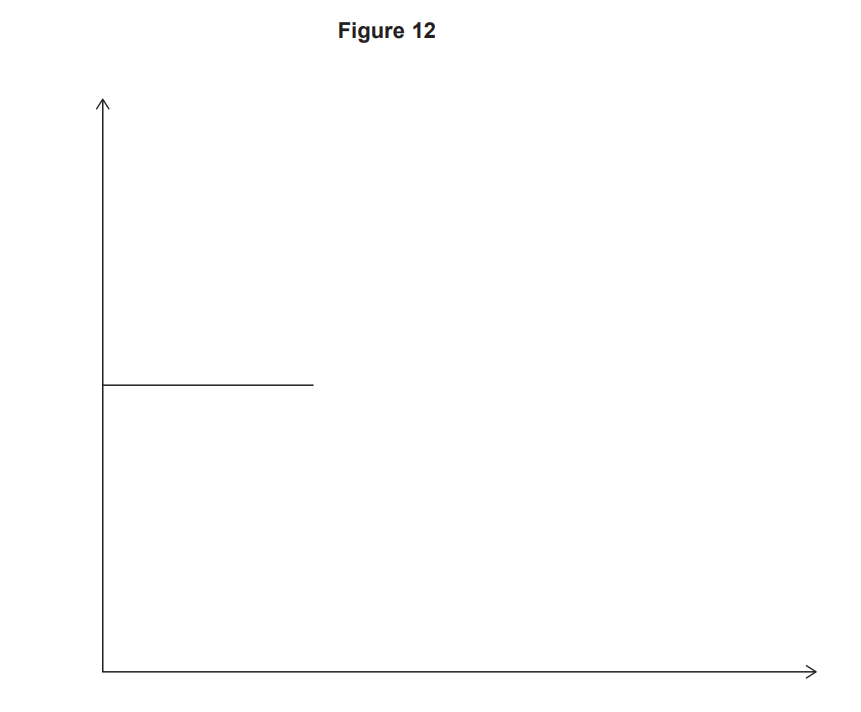
FIGURE 12 shows part of the reaction profile when hydrogen bromide decomposes to form hydrogen and bromine.

Complete FIGURE 12.

You should:

  • label the axes

  • draw the reaction profile

  • label the reactant and the products

  • label the activation energy.

Figure 12: blank Cartesian graph with horizontal and vertical axes, and a short horizontal line segment from the y-axis across the middle left
5a
1 mark

Calcium carbonate reacts with hydrochloric acid.

The equation for the reaction is:

CaCO₃(s) + 2HCl(aq) → CaCl₂(aq) + H₂O(l) + CO₂(g)

A student investigated the effect of changing the surface area of the calcium carbonate on the rate of this reaction.

The student used calcium carbonate in the form of lumps and of powder.

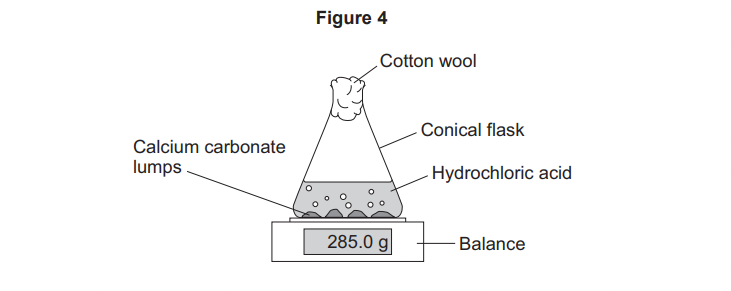
Figure 4 shows the apparatus.

Diagram of a conical flask on a balance reading 285.0 g, containing hydrochloric acid and calcium carbonate lumps, plugged with cotton wool

The rate of reaction is determined by measuring the decrease in mass of the conical flask and contents at regular time intervals.

Give the reason why the mass of the conical flask and contents decreases.

5b
Sme Calculator
3 marks

The mean rate of reaction using the calcium carbonate lumps was 0.0012 g/s.

Calculate the time taken for the mass of the conical flask and contents to decrease by 0.36 g.

5c
3 marks

The results showed that calcium carbonate powder reacted faster than calcium carbonate lumps.

Explain why calcium carbonate powder reacted faster than calcium carbonate lumps.

5d
Sme Calculator
3 marks

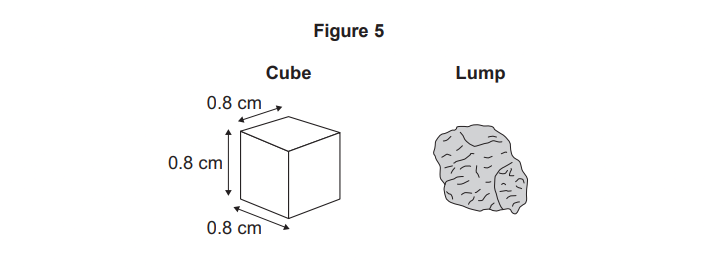
The surface area of a calcium carbonate lump can be estimated by comparing the lump with a cube.

Figure 5 shows a cube and a similar-sized calcium carbonate lump.

Diagram labelled Figure 5 showing a 0.8 cm cube with dimensions marked, next to an irregularly shaped lump of similar size.

Calculate the total surface area of the cube in Figure 5.

5e
1 mark

The total surface area of the calcium carbonate lump in Figure 5 is estimated rather than measured.

Suggest one reason why.

6a
1 mark

A student investigated the reaction between calcium carbonate and hydrochloric acid.

The equation for the reaction is:

CaCO3+2HClCaCl2+H2O+CO2

The student investigated the effect of changing the concentration of hydrochloric acid on the rate of the reaction.

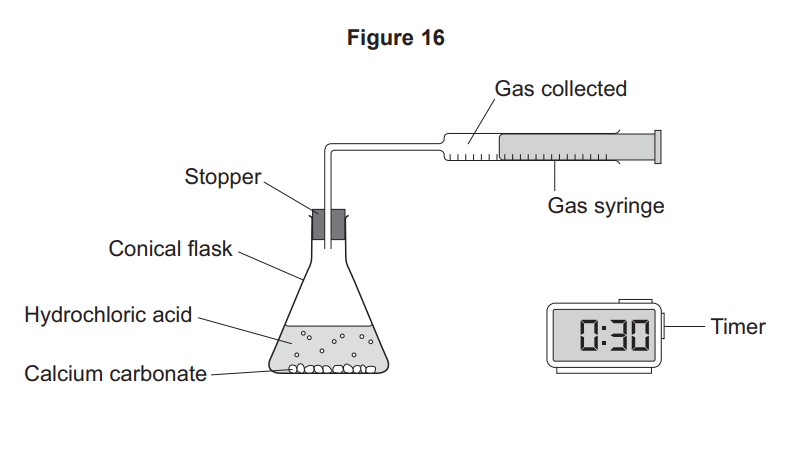
FIGURE 16 shows the apparatus.

Diagram of a conical flask with calcium carbonate and hydrochloric acid, stopper connected to a gas syringe collecting gas, with a digital timer at 0:30.

This is the method used.

  1. Add 50 cm³ of hydrochloric acid to the conical flask.

  2. Add 2.0 g of calcium carbonate to the conical flask.

  3. Immediately insert the stopper into the conical flask and start the timer.

  4. Record the volume of gas collected in the gas syringe every 30 seconds.

  5. Stop recording when the volume of gas in the gas syringe does not change.

  6. Repeat steps 1 to 5 using different concentrations of hydrochloric acid.

Name the independent variable in this investigation.

6b
Sme Calculator
5 marks

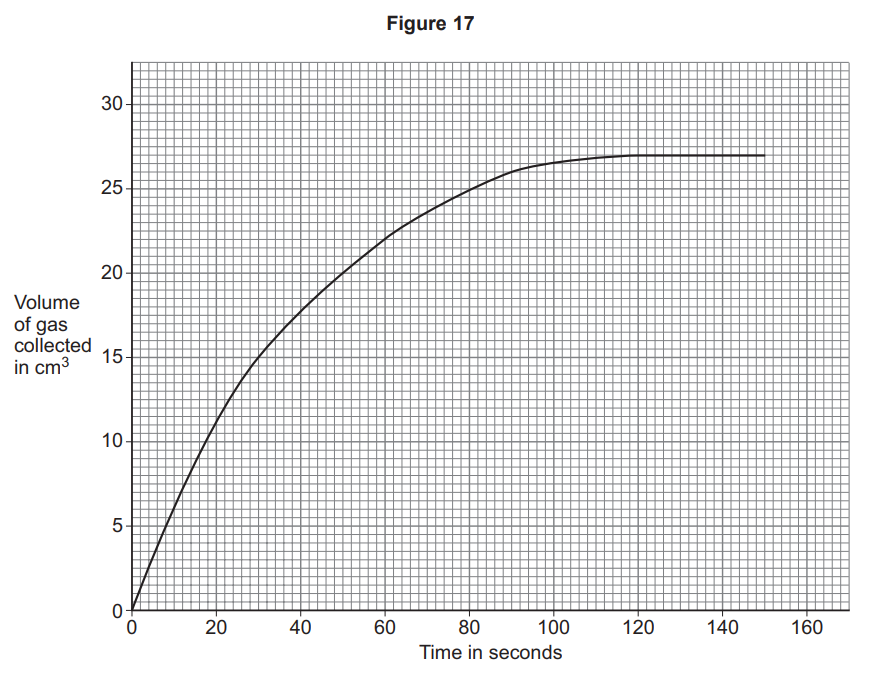
FIGURE 17 shows the results for one concentration of hydrochloric acid.

Line graph of gas volume against time, rising steeply then levelling off at about 27 cm³ after 80 seconds, showing gas collection slowing over time.

Determine the rate of reaction at 60 seconds.

Show your working on FIGURE 17.

Give your answer to 2 significant figures.

6c
1 mark

How does FIGURE 17 show that the rate of reaction decreases with time?

6d
3 marks

Explain why the rate of reaction between calcium carbonate and hydrochloric acid decreases with time.

7
1 mark

Complete the sentence.

The minimum amount of energy that particles must have to react is called the ________ .

8a
1 mark

This question is about a reversible reaction.

Ethene reacts with steam to produce ethanol.

The equation for the reaction is:

C2H4(g)+H2O(g)C2H5OH(g)

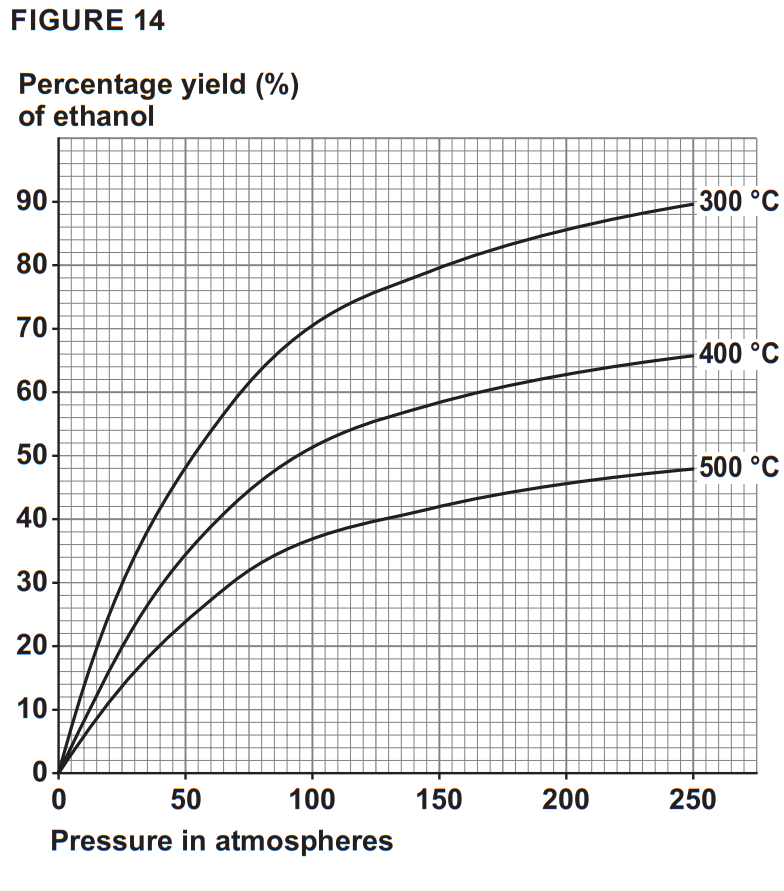
FIGURE 14 shows the percentage yield of ethanol using different reaction conditions.

Graph of ethanol percentage yield versus pressure, showing yield increases with pressure and is highest at 300 °C, then 400 °C, and lowest at 500 °C.

Predict the percentage yield of ethanol at a pressure of 100 atmospheres and a temperature of 350 ºC.

Use FIGURE 14.

Percentage yield =___________________ %

8b
3 marks

Explain why changing the temperature affects the percentage yield of ethanol.

Use FIGURE 14.

8c
1 mark

How must the apparatus for the reaction be designed so that equilibrium can be reached?

8d
1 mark

A catalyst is used to increase the rate of the reaction.

Define the term 'catalyst'.

8e
2 marks

What is the effect of the catalyst on the percentage yield of ethanol at equilibrium?

Give ONE reason for your answer.

9a
1 mark

Calcium carbonate reacts with hydrochloric acid.

The word equation for the reaction is:

calcium carbonate + hydrochloric acid → calcium chloride + water + carbon dioxide

A student investigated the effect of changing the surface area of the calcium carbonate on the rate of this reaction.

The student changed the surface area of the calcium carbonate by using different-sized lumps.

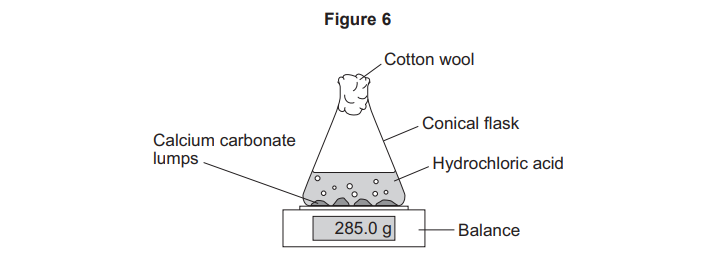
Figure 6 shows the apparatus.

Diagram of a conical flask on a balance, containing hydrochloric acid and calcium carbonate lumps, with cotton wool in the neck; mass reads 285.0 g

The rate of reaction is determined by measuring the decrease in mass of the conical flask and contents at regular time intervals.

This is the method used.

  1. Place a conical flask on a balance.

  2. Add 50 cm3 of hydrochloric acid to the conical flask.

  3. Add 2 g of small lumps of calcium carbonate to the hydrochloric acid.

  4. Put cotton wool in the top of the conical flask.

  5. Record the mass every 60 seconds until the mass remains constant.

  6. Repeat steps 1 to 5 with 2 g of large lumps of calcium carbonate.

Why was cotton wool put in the top of the conical flask?

  • To slow down the reaction

  • To stop acid splashing out of the conical flask

  • To stop carbon dioxide gas escaping

9b
1 mark

What was the independent variable in this investigation?

9c
1 mark

Give one control variable used in this investigation.

9d
Sme Calculator
2 marks

Table 3 shows some of the results.

Table 3

Size of calcium carbonate lumps

Decrease in mass after 60 seconds in grams

Small

0.09

Large

0.06

Calculate the mean rate of reaction from 0 to 60 seconds for the small lumps.

Use the equation:

mean rate of reaction=decrease in masstime taken

Use Table 3.

9e
3 marks

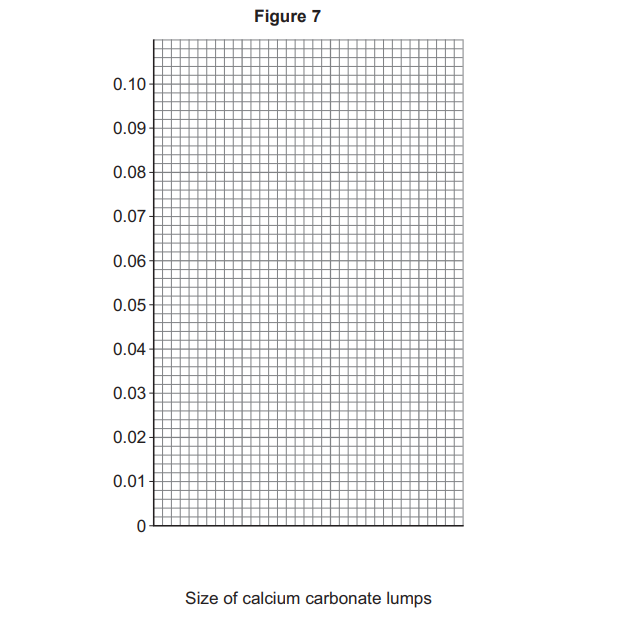
Complete Figure 7.

You should:

  • label the y-axis

  • plot the data from Table 3 as a bar chart

  • label each bar.

Blank grid chart titled Figure 7, with vertical axis 0 to 0.10 and horizontal label “Size of calcium carbonate lumps”, containing no plotted data
9f
1 mark

Why are the results plotted as a bar chart and not as a line graph?

9g
1 mark

Table 3 is repeated below.

Table 3

Size of calcium carbonate lumps

Decrease in mass after 60 seconds in grams

Small

0.09

Large

0.06

What effect does the size of the calcium carbonate lumps have on the rate of reaction?

Use Table 3 .

  • Increasing the size of the lumps decreases the rate of reaction.

  • Increasing the size of the lumps does not affect the rate of reaction.

  • Increasing the size of the lumps increases the rate of reaction.

9h
Sme Calculator
2 marks

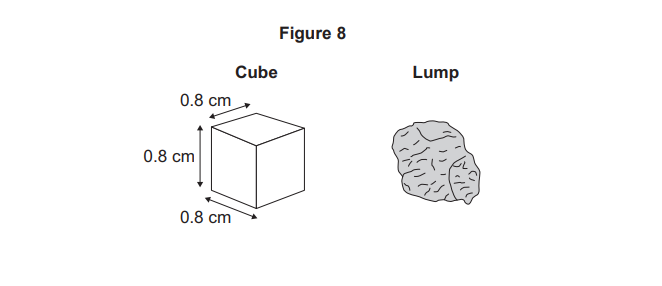
The surface area of a calcium carbonate lump can be estimated by comparing the lump with a cube.

Figure 8 shows a cube and a similar-sized calcium carbonate lump.

Diagram labelled Figure 8 showing a 0.8 cm cube with dimensions marked and, to the right, an irregular lump of similar size.

Calculate the total surface area of the cube in Figure 8.

Use the equation:

total surface area of cube=6×length of one side×length of one side

9i
1 mark

Suggest one reason why the total surface area of the lump in Figure 8 is estimated rather than measured.

10a
1 mark

Magnesium reacts with hydrochloric acid.

A student investigated the effect of changing the hydrochloric acid concentration on the rate of this reaction.

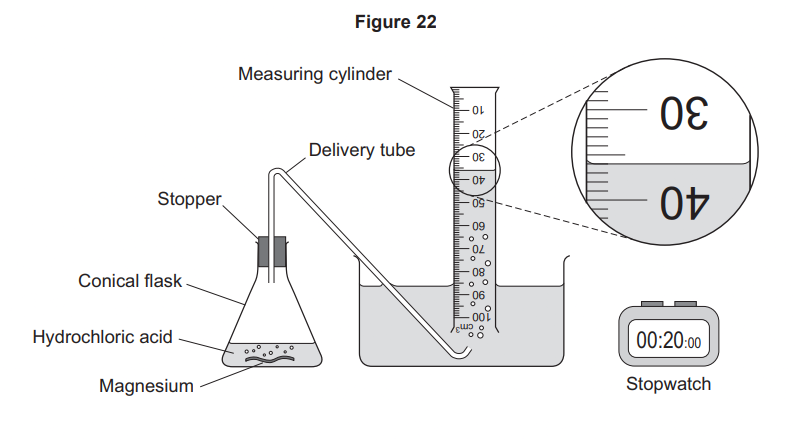
Figure 22 shows the apparatus.

Diagram of a magnesium and hydrochloric acid reaction, with gas collected in an inverted measuring cylinder in water and timed using a stopwatch.

This is the method used.

  1. Add 50 cm³ of hydrochloric acid to the conical flask.

  2. Add a 3 cm strip of magnesium to the hydrochloric acid in the conical flask.

  3. Fit the stopper and delivery tube to the top of the conical flask and start timing.

  4. Record the volume of hydrogen gas collected in the measuring cylinder every 20 seconds for a total of 100 seconds.

  5. Repeat steps 1 to 4 with a different concentration of hydrochloric acid.

What volume of hydrogen gas has been collected in the measuring cylinder in Figure 22?

10b
2 marks

The stopper and delivery tube were fitted to the conical flask in step 3.

Explain why the time taken to fit the stopper and delivery tube may cause an error in this investigation.

10c
1 mark

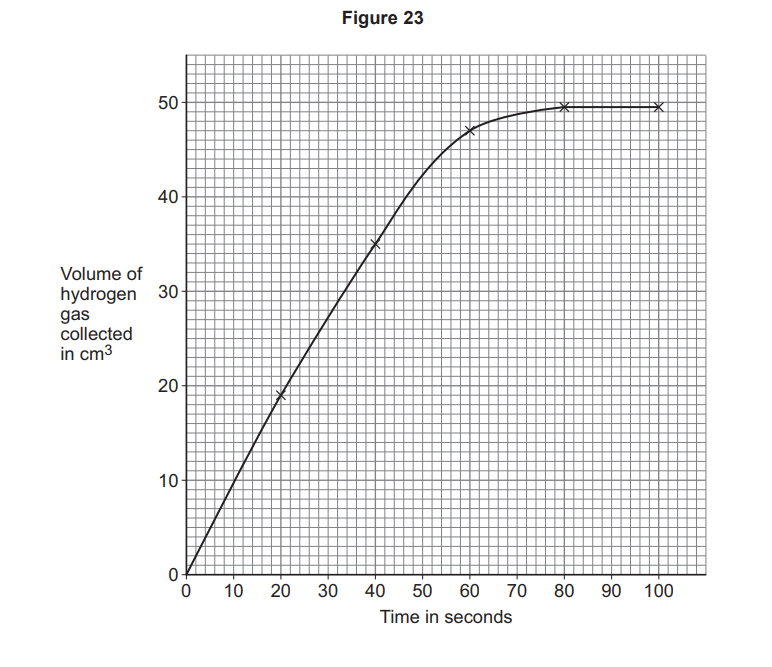
Figure 23 shows the results for one concentration of hydrochloric acid.

Line graph of hydrogen volume (cm³) against time (s), rising steeply then levelling off at about 50 cm³ after 70 seconds, showing reaction completion.

Determine the time taken for the reaction to be complete.

Use Figure 23.

10d
1 mark

The student repeated the method using a higher concentration of hydrochloric acid.

How would the line of best fit for a higher concentration of hydrochloric acid compare with the line of best fit on Figure 23?

  • Initially the line of best fit would have a lower gradient.

  • Initially the line of best fit would have the same gradient.

  • Initially the line of best fit would have a higher gradient.

11a
1 mark

A student investigated the rate of the reaction between calcium carbonate and hydrochloric acid.

The word equation for the reaction is:

calcium carbonate + hydrochloric acid → calcium chloride + water + carbon dioxide

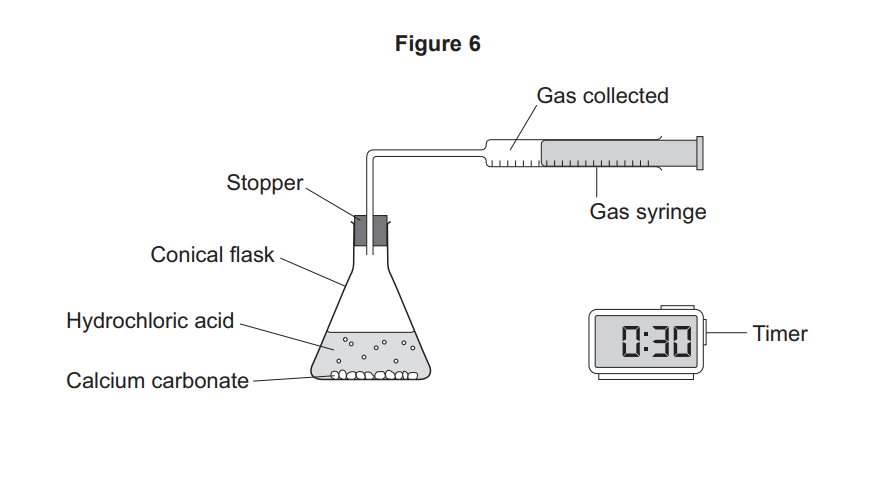
Figure 6 shows the apparatus.

Diagram of a conical flask with calcium carbonate and hydrochloric acid, sealed by a stopper and connected to a gas syringe, with a digital timer reading 30 s

This is the method used:

  1. Add 50 cm3 of hydrochloric acid to the conical flask

  2. Add 2.0 g of calcium carbonate to the conical flask

  3. Immediately insert the stopper into the conical flask and start the timer

  4. Record the volume of gas collected in the gas syringe every 30 seconds

  5. Stop recording when the volume of gas in the gas syringe does not change

Which piece of equipment is the most suitable to measure the volume of hydrochloric acid?

Tick (✓) one box.

  • Beaker

  • Measuring cylinder

  • Test tube

11b
1 mark

Name one piece of equipment that can be used to measure the mass of calcium carbonate.

11c
1 mark

Why must the stopper be inserted immediately after the reactants are added to the flask?

11d
2 marks

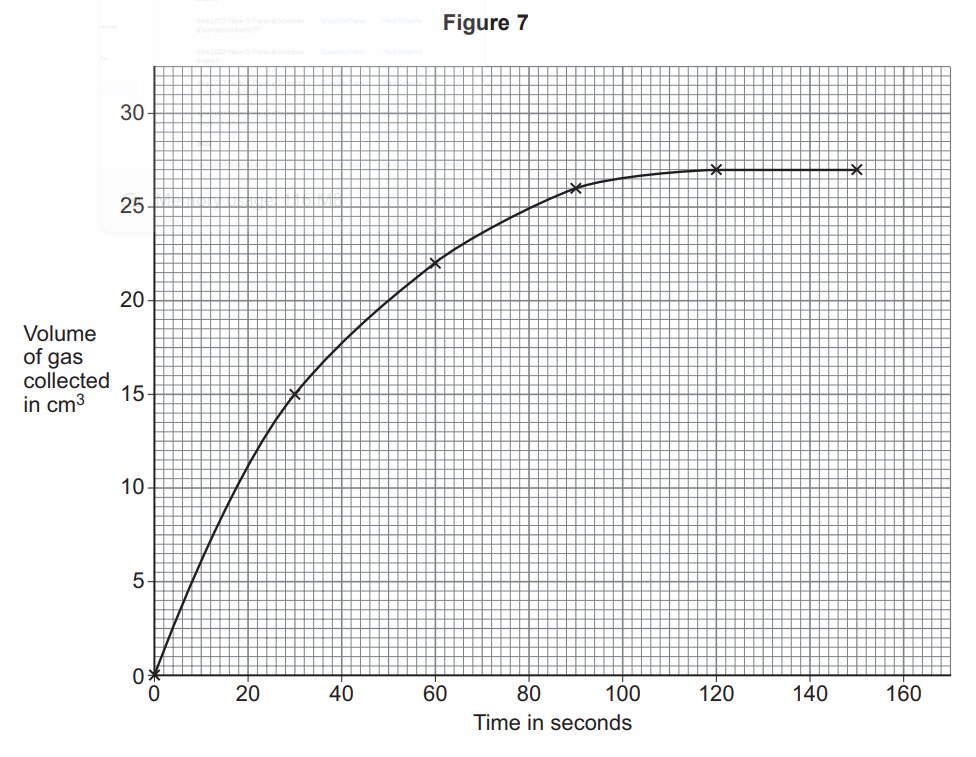
Figure 7 shows the results.

Line graph titled Figure 7 showing volume of gas in cm³ against time in seconds, rising steeply then levelling off near 27 cm³ after about 120 s

Describe the trend for the volume of gas collected.

Use Figure 7.

11e
Sme Calculator
4 marks

Determine the mean rate of reaction from 0 to 30 seconds.

Use Figure 7.

Use the equation:

mean rate of reaction=volume of gas collectedtime taken

Choose the unit from the box.

cm3/s

s/cm3

scm3

Mean rate of reaction =_____________ Unit _____________

11f
2 marks

The student repeated the investigation using hydrochloric acid of higher concentration.

Complete the sentences.

Choose answers from the box.

decreases

stays the same

increases

When the concentration of hydrochloric acid increases, the rate of reaction increases.

This is because the mean distance between particles ________________.

Therefore the frequency of collisions between particles______________.

11g
1 mark

What is the minimum amount of energy that particles must have to react?

Tick (✓) one box.

  • Activation energy

  • Kinetic energy

  • Potential energy

12
2 marks

Give two measurements the student should make to determine the rate of reaction.

13a
2 marks

Ammonia reacts with hydrogen chloride to produce ammonium chloride.

The reaction is reversible.

Write the word equation for the reaction.

Include the symbol for a reversible reaction.

________________+__________________ ________________

13b
1 mark

Which condition needs to be changed so that the direction of the reaction is reversed?

14a
1 mark

Enzymes are large molecules and biological catalysts.

What type of molecule is an enzyme?

14b
1 mark

A catalyst changes the rate of a chemical reaction.

What happens to the mass of a catalyst during a chemical reaction?

Tick (✓) one box.

  • The mass of the catalyst decreases.

  • The mass of the catalyst stays the same.

  • The mass of the catalyst increases.

14c
2 marks

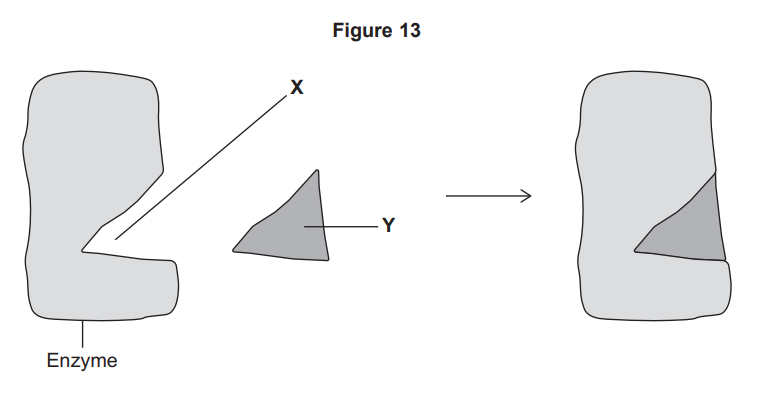
Figure 13 shows a model of enzyme action.

Diagram of an enzyme with an active site labelled X binding a triangular substrate labelled Y, forming an enzyme–substrate complex on the right

Name X and Y in Figure 13.

14d
1 mark

Name the model shown in Figure 13.

14e
2 marks

Amylase is an enzyme that breaks down starch.

A student investigated how changing the pH affected the activity of amylase.

This is the method used.

  1. Heat a test tube containing 2 cm³ of amylase solution at pH 5.0 in a water bath at 35 °C.

  2. Heat a test tube containing 2 cm³ of starch solution in the same water bath.

  3. Transfer the amylase solution into the test tube of starch solution and mix.

  4. After 30 seconds remove a drop of the amylase–starch mixture and test the drop for starch.

  5. Repeat step 4 until no starch is detected.

  6. Record the total time taken for no starch to be detected.

  7. Repeat steps 1 to 6 using amylase solution at different pH values.

Explain why the solutions are all placed in the same water bath.

14f
2 marks

Describe the test for starch.

Give the result of the test if starch is present.

Test:______________________________________________________

Result:____________________________________________________

14g
1 mark

Table 4 shows the results.

Table 4

pH

Time taken for no starch to be detected in seconds

5.0

120

5.5

120

6.0

90

6.5

90

7.0

60

7.5

60

8.0

90

8.5

120

Which range of pH values had the fastest rate of reaction?

Tick (✓) one box.

  • pH 5.0 to pH 5.5

  • pH 6.0 to pH 6.5

  • pH 7.0 to pH 7.5

  • pH 8.0 to pH 8.5

14h
1 mark

How could the method be improved to obtain a more accurate pH value for the fastest rate of reaction?

15a
4 marks

The rate of chemical reactions can be changed by changing the conditions.

Methane burns in oxygen to produce carbon dioxide and water.

The activation energy for the reaction is 2648 kJ/mol.

The reaction gives out 818 kJ/mol of energy.

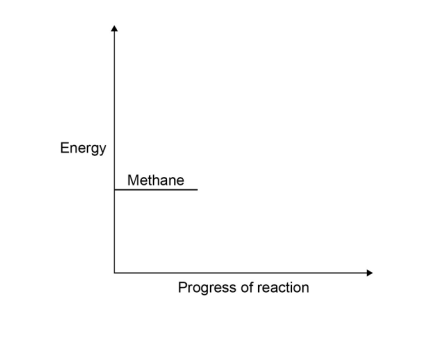
Figure 1 shows the reaction profile for this reaction.

Figure 1

(axes: y = energy, x = progress of reaction; the curve rises from the reactants level to a peak and then falls).

Complete the reaction profile.

Draw arrows to represent:

  • the activation energy

  • the energy given out.

15b
Sme Calculator
1 mark

What percentage of the activation energy is the energy given out?

15c
1 mark

Calcium carbonate decomposes when it is heated.

The decomposition of calcium carbonate is an endothermic reaction.

How would the reaction profile for decomposition of calcium carbonate be different from the reaction profile of methane burning in oxygen?

15d
4 marks

Catalysts are used in chemical reactions in industry.

Give two properties of catalysts.

For each property, explain why it makes the catalyst useful in industry.

15e
1 mark

Enzymes are biological catalysts.

What type of molecule is an enzyme?

Tick (✓) one box.

  • Carbohydrate

  • Hydrocarbon

  • Lipid

  • Protein

15f
2 marks

If enzymes are denatured they stop working.

Give two ways an enzyme can be denatured.

15g
3 marks

An enzyme called lactase catalyses the reaction that breaks down lactose to smaller molecules.

One model used to explain how enzymes affect reactions is called the lock and key model.

Use the lock and key model to explain why lactase cannot be used to speed up all chemical reactions.

16a
2 marks

Farmers use ammonium nitrate as a fertiliser.

Farmers want to slow down the rate at which ammonium nitrate fertiliser dissolves in the water in the soil.

Suggest why they spread the fertiliser in the form of small beads instead of a fine powder.

16b
4 marks

Ammonia is needed to make ammonium nitrate.

The reaction used to make ammonia is:

N2(g)+3H2(g)2NH3(g)

The forward reaction is exothermic.

At equilibrium, about 35% of the nitrogen and hydrogen are converted to ammonia at 450 °C and 200 atmospheres pressure.

Explain the effects of increasing the temperature, or increasing the pressure, on the amount of ammonia produced at equilibrium.

17a
2 marks

A student investigates how the concentration of an acid affects the rate of a reaction.

This is the method used.

  1. Put a 3 cm piece of magnesium ribbon into a conical flask.

  2. Add 50 cm³ of 0.5 mol/dm³ hydrochloric acid to the flask.

  3. Collect and measure the volume of gas produced at 10 second intervals.

  4. Repeat with different concentrations of hydrochloric acid using the same length of magnesium ribbon and volume of acid.

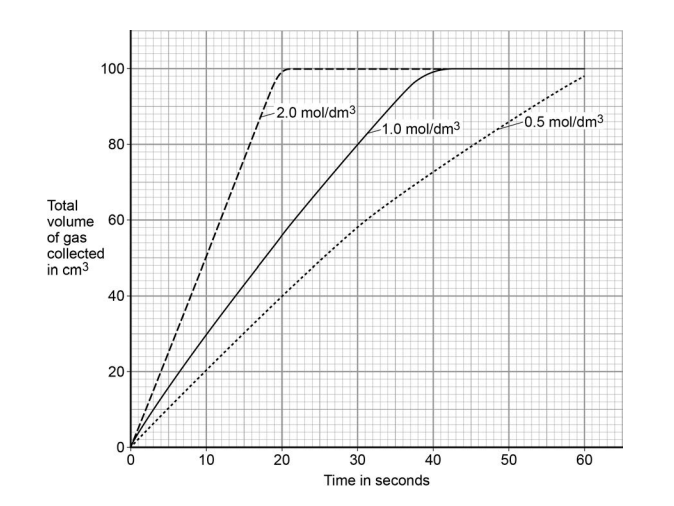
The student's results are shown in Figure 3.

Figure 3

(a graph of volume of gas collected in cm³ on the y-axis against time in seconds on the x-axis, with three curves for acid concentrations of 0.5 mol/dm³, 1.0 mol/dm³ and 2.0 mol/dm³; the curves rise steeply and level off at higher volumes for higher concentrations).

How do the results show that increasing the concentration of acid increases the rate of reaction?

17b
3 marks

Explain why the rate of reaction changes as the concentration of the acid increases.

You should answer in terms of particles.

17c
2 marks

Student A said that the final volume of gas collected was lower for a concentration of 0.5 mol/dm³ because the reaction had not finished.

Student B said it was because all the acid had reacted.

Describe further experimental work the students could do to find out which student was correct.

18a
1 mark

Amylase catalyses the breakdown of starch into sugars.

A student investigated the effect of amylase on the reaction at different temperatures.

Figure 14 shows the apparatus the student used.

Figure 14

(a test tube of starch suspension with amylase added, placed in a water bath at a measured temperature; samples are removed every 30 s and tested for starch in a spotting tile with iodine)

Method:

  1. Put starch suspension into a test tube.

  2. Add amylase solution.

  3. Put the test tube in a beaker of water at 15 °C.

  4. Remove a small sample of the mixture every 30 seconds and put in a spotting tile.

  5. Test the sample for starch.

  6. Time how long it takes to break down all of the starch in the mixture.

  7. Repeat steps 1–5 at 20 °C, 25 °C and 30 °C.

  8. Repeat for each temperature twice more.

Table 8 shows the student's results.

Table 8

Temperature in °C

Time taken until there was no starch in the sample in minutes

Test 1 (min)

Test 2 (min)

Test 3 (min)

Mean (min)

15

6.1

9.4

10.0

8.5

20

4.8

5.0

4.6

4.8

25

3.0

2.5

3.0

3.2

30

1.5

2.0

2.0

?

One of the results in Table 8 is anomalous.

Draw a ring around the anomalous result.

18b
Sme Calculator
1 mark

Calculate the mean for 30 °C.

18c
1 mark

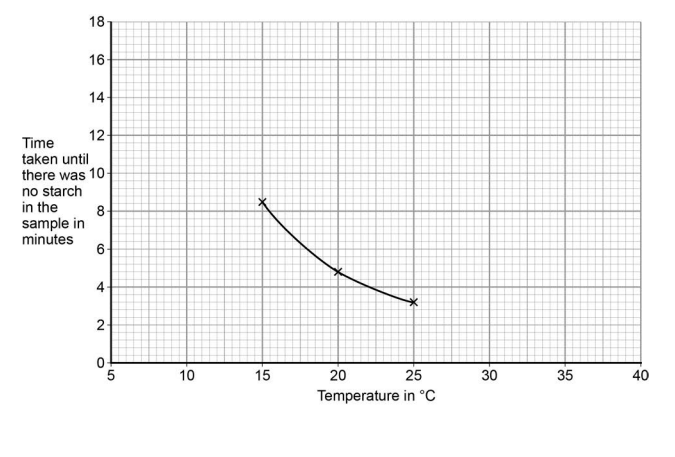
Figure 15 shows a graph of the student's results.

(mean time taken on y-axis against temperature on x-axis; a curve falling from high values at 15 °C to low values at 30 °C)

Use the graph to predict how long it would take to break down all of the starch at 10 °C.

Time = __________________ minutes

18d
2 marks

The student tested samples of the mixture for starch every 30 seconds.

In each test she added one drop of iodine to the sample in the spotting tile.

Predict the colour of the samples from the 20 °C test at 4.0 minutes and 7.0 minutes.

Colour at 4.0 minutes: _________________________

Colour at 7.0 minutes: _________________________

18e
1 mark

The student did a fourth test at 30 °C.

In this test the starch did not break down, even after 45 minutes.

Why did the amylase not break down the starch in this test?

Tick (✓) one box.

  • The amylase solution and the starch suspension were mixed before the start of the experiment.

  • The amylase solution had been prepared with water at 95 °C.

  • The amylase solution had been prepared with water at 20 °C.

  • The amylase solution had been stored in the fridge.

18f
6 marks

The student made the following conclusion about the optimum temperature for amylase to work at.

'Amylase works fastest at 40 °C'

Her teacher said that this is not a valid conclusion from her results.

Describe how the student could change her method to give results that would improve the validity of her conclusion.