Probability Diagrams (AQA GCSE Statistics: Higher): Revision Note
Exam code: 8382

Sample Space Diagrams
What is a sample space diagram?
In probability, the sample space means all the possible outcomes
A sample space diagram is a way of showing all these outcomes in a systematic and organised way
In simple situations sample space diagram can just be a list
For flipping a coin, the sample space is: Heads, Tails
the letters H, T can be used
For flipping two coins the sample space could be given as: HH, HT, TH, TT (4 possible outcomes)
For rolling a six-sided dice, the sample space is: 1, 2, 3, 4, 5, 6
But for rolling two dice there would be 36 possibilities!
When combining two things a grid can be used to show the sample space
For example, rolling two six-sided dice and adding their scores
A list of all the possibilities would be very long
It would be hard to spot if you had missed any possibilities
It would be hard to spot any patterns
Use a grid instead

If you need to combine more than two things you'll probably need to go back to using a list
For example, flipping three coins (or flipping one coin three times!)
In this case the sample space is: HHH, HHT, HTH, THH, HTT, THT, TTH, TTT (8 possible outcomes)
How do I use a sample space diagram to calculate probabilities?
Probabilities can often be found by counting the possibilities you want,
then dividing by the total number of possibilities in the sample space
For example, in the sample space 1, 2, 3, 4, 5, 6, 7, 8, 9, 10 you can count 4 prime numbers (2, 3, 5 and 7)
So the probability of getting a prime number is
Or for rolling two dice and adding the results, the possibility diagram above shows there are 5 ways to get '8', and 36 outcomes in total
So the probability of getting an 8 is
But be careful - this counting method only works if all possibilities in the sample space are equally likely
For a fair six-sided dice: 1, 2, 3, 4, 5, 6 are all equally likely
For a fair coin: H, T are equally likely
Winning the lottery: Yes, No. These are not equally likely!
You cannot count possibilities here to say the probability of winning the lottery is
This method can also be used for finding the probability of an event occurring given that another event has occurred (conditional probability)
For example when two dice are rolled, you can use the sample space diagram above to find the probability that an individual dice shows a 6, given that the total showing on the two dice is 7
count the number of outcomes that sum to 7 (there are 6 of them) - this goes in the denominator
count the number of those outcomes in which one of the dice shows a 6 (there are two of these, (1,6) and (6,1)) - this goes in the numerator
So the probability is
Examiner Tips and Tricks
A questions may not say "by drawing a sample space diagram", so you may have to decide to do it on your own
Worked Example
Two fair six-sided dice are rolled.
(a) Find the probability that the sum of the numbers showing on the two dice is an odd number greater than 5, giving your answer as a fraction in simplest form.
Draw a sample space diagram (in this case a grid) to show all the possible outcomes

Circle the possibilities that are odd numbers greater than 5.
(5 is not included!)

Count the number of possibilities that are circled (12) and divide that by the total number of possibilities in the diagram (36)
Finally, simplify your answer
(b) Given that the sum of the numbers showing on the two dice is an odd number greater than 5, find the probability that one of the dice shows the number 2. Give your answer as a fraction in its simplest form.
From part (a) you already know there are 12 ways to get an odd number greater than 5
Now find how many of those ways (i.e., how many of the circled possibilities in the sample space grid) have one of the dice showing the number 2
There are two of these: (2, 5) and (5, 2)
So the probability we are looking for is 2 divided by 12
Finally, simplify your answer
Two-way Tables for Probability
For basic information about Two-way Tables see the 'Two-way Tables & Venn Diagrams' revision note in the 'Tabulation, Diagrams & Representation' topic. Here we are looking at how to use two-way tables to calculate probabilities.
How do I find probabilities from a two-way table?
Consider the data in the following table, on numbers of Year 12 and 13 students studying Spanish and German in a college with 55 students
Here the 'totals' have all been given
On an exam you might need to add the totals rows and columns yourself
| Spanish | German | Total |
|---|---|---|---|
Year 12 | 15 | 10 | 25 |
Year 13 | 5 | 25 | 30 |
Total | 20 | 35 | 55 |
You can use this to answer probability questions
If a random student is selected from the whole college, it will be out of 55
The probability a student selected from the college studies Spanish and is in Year 12 is
The probability a student selected from the college studies Spanish is
If a random student is selected from a specific category, the denominator will be that category total
The probability a student selected from Year 13 studies Spanish is
How do I work with two-way tables and conditional probability?
With two-way tables, conditional probabilities deal with subsets of things in the table
Conditional probability questions are often (but not always!) introduced by the expression 'given that...'
For example 'Find the probability that a randomly chosen student studies German, given that the student is in Year 12'
The answer would be the number of 'Year 12 and German' students divided by the total for the 'Year 12' row
Conditional probabilities can be written using the 'straight bar' notation
That is read as 'the probability of B given A'
It is the probability that B will happen if A has happened
For example would be the probability that a student studies German, given that the student is in Year 12
i.e. if a Year 12 student has been selected, what is the probability that that student will study German
The following example shows how conditional probabilities can be calculated from a more complicated two-way table

Examiner Tips and Tricks
If you had to complete a two-way table (or add the 'total' rows and columns), double-check that your numbers are correct
If there are errors in the table, probabilities calculated from it will be incorrect and you could lose marks
Worked Example
At an art group, children are allowed to choose between colouring, painting, clay modelling and sketching.
A total of 60 children attend and are split into two classes: class A and class B.
The data for the art group is represented in the following two-way table.
| Colouring | Painting | Clay modelling | Sketching | Total |
|---|---|---|---|---|---|
Class A | 12 | 8 | 2 | 8 | 30 |
Class B | 1 | 12 | 13 | 4 | 30 |
Total | 13 | 20 | 15 | 12 | 60 |
A child is selected at random from the art group. Find the probability that the child
(a) chose colouring
A total of 13 children chose colouring, out of 60 students in total
(b) is a member of class B who chose sketching
4 children are in class B and chose sketching
We are still selecting out of 60 children in total
The simplified answer is also accepted, but is not necessary to get full marks
(c) chose painting, given that the child is a member of class A
Now the choice is only 'out of' the 30 children in class A
8 children in that class chose painting
The simplified answer is also accepted, but is not necessary to get full marks
(d) is a member of class B, given that the child chose sketching.
Note that this is not the same thing that is asked in part (b)!
The choice here is out of the 12 students who chose sketching
4 of those children are in class B
The simplified answer is also accepted, but is not necessary to get full marks
Venn Diagrams for Probability
For basic information about Venn Diagrams see the 'Two-way Tables & Venn Diagrams' revision note in the 'Tabulation, Diagrams & Representation' topic. Here we are looking at how to use Venn diagrams to calculate probabilities.
How do I find probabilities from Venn diagrams?
For basic probabilities, count the number of items you want and divide by the total number of items

For the Venn diagram shown above,
The probability of being in A is
There are 16 elements in A out of 45 in total
The probability of being in both A and B is
There are 4 elements in A and B (the 'overlap')
The probability of being in A, but not B, is
12 elements are in A but not B
How do I use Venn diagrams with conditional probability?
With Venn diagrams, conditional probabilities deal with subsets of things in the diagram
Conditional probability questions are often (but not always!) introduced by the expression 'given that...'
For example 'Find the probability that a randomly chosen item is in A and B, given that the item is in B'
The answer would be the number of 'A and B' items divided by the total number of items in B
For the above diagram that would be
Conditional probabilities can be written using the 'straight bar' notation
That is read as 'the probability of B given A'
It is the probability that B will happen if A has happened
So for the above example we could write
i.e. if an item from B has been selected, what is the probability that the item will also be in A
Examiner Tips and Tricks
If you had to create the Venn diagram (or fill in some of the numbers), double-check that your numbers are correct
If there are errors in the Venn diagram, probabilities calculated from it will be incorrect and you could lose marks
Worked Example
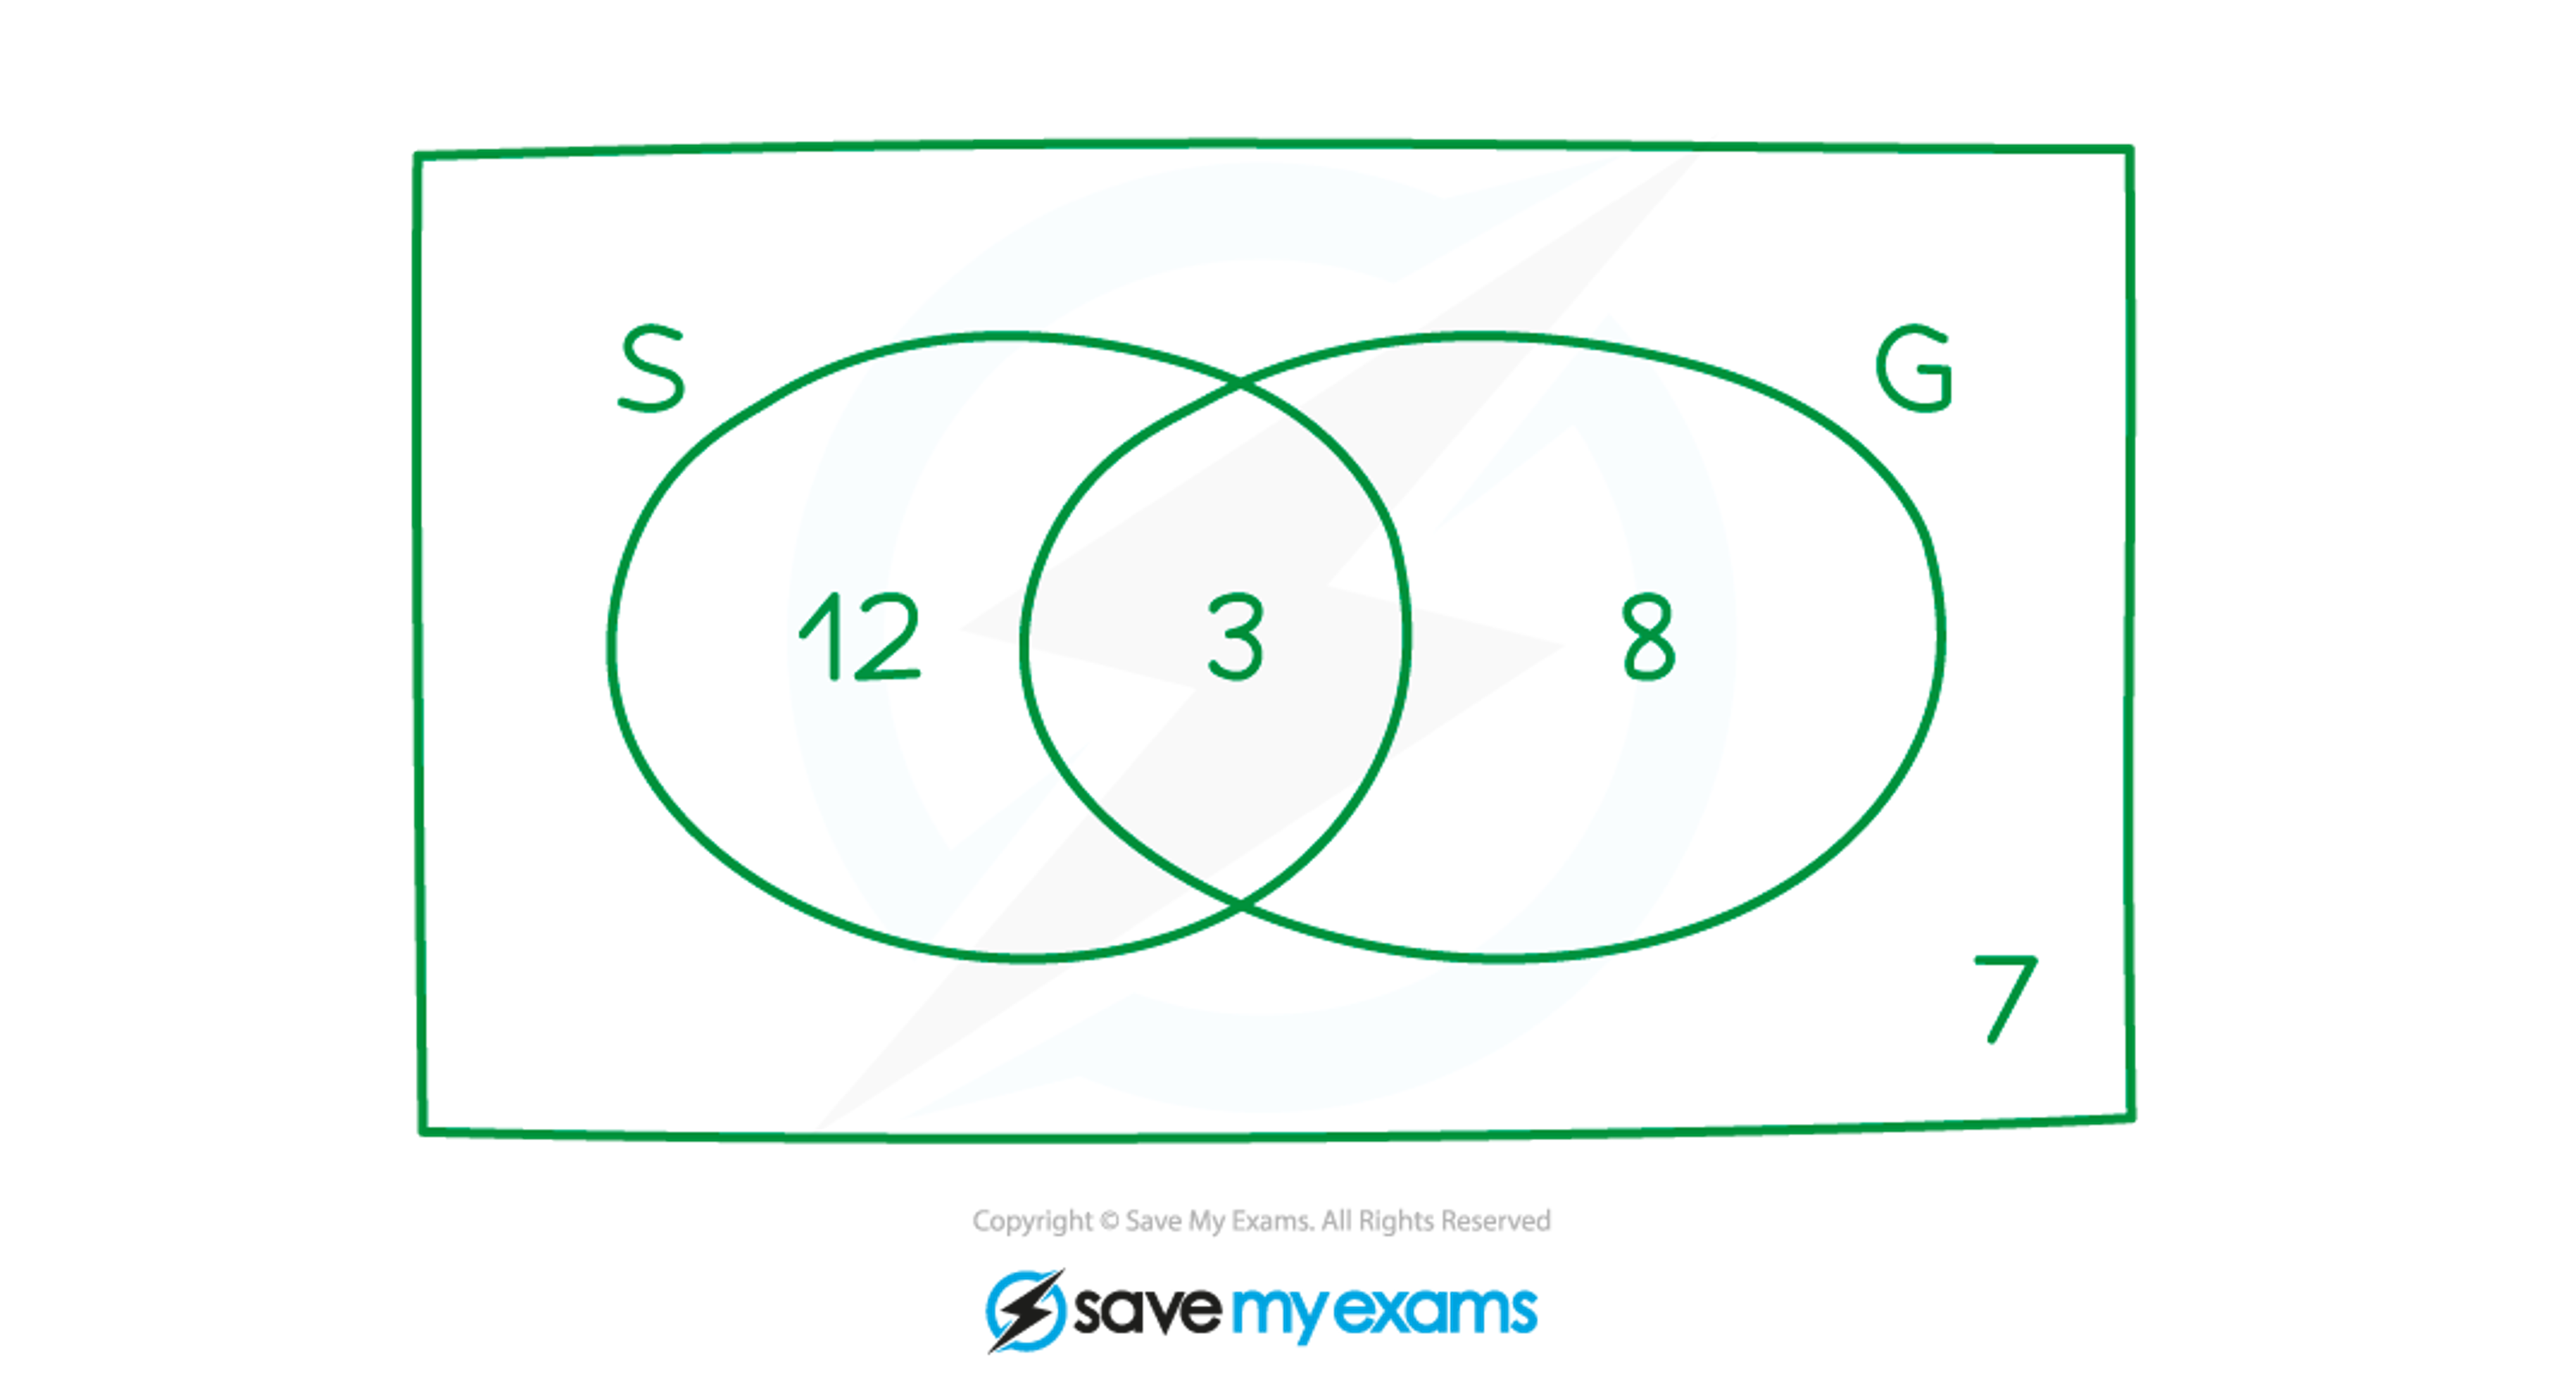
In a class of 30 students, students can study Spanish, German, both, or neither.
The data for the class is represented on the following Venn diagram.
A student is chosen from the class at random. Find the probability that the student
(a) studies German
11 (3+8) students study Spanish, out of 30 students in total
(b) studies Spanish but not German
12 students study Spanish but not German (the part of the 'S' oval that's outside the 'G' oval)
We are still selecting out of 30 students in total
The simplified answer is also accepted, but is not necessary to get full marks
(c) studies German, given that they study Spanish
Now the choice is out of the 15 (12+3) students who study Spanish
3 of those students also study German
The simplified answer is also accepted, but is not necessary to get full marks
(d) studies Spanish, given that they do not study German .
Note that this is not the same thing that is asked in part (b)!
There are 19 (12+7) students who do not study German (all the numbers outside the 'G' oval)
12 of those students study Spanish
Venn diagrams are also a context in which probability formulae can be used to answer questions
See the 'Probability Formulae' revision note to review what these formulae are
Worked Example
The following Venn diagram shows the probabilities associated with two events, and .

It is known that .
(a) Find the values of and .
To find we can either use the general addition law
Or you could just notice that has to be the sum of , 0.03 and 0.12
To find the value of , remember that these are probabilities
So all of them must add up to 1
(b) Show that and are independent.
Remember, if is true, then A and B are independent

, so A and B are independent
(c) Find the probability of given .
Use
(You could also use the fact that because and are independent, )
Tree Diagrams
How do I draw a tree diagram?
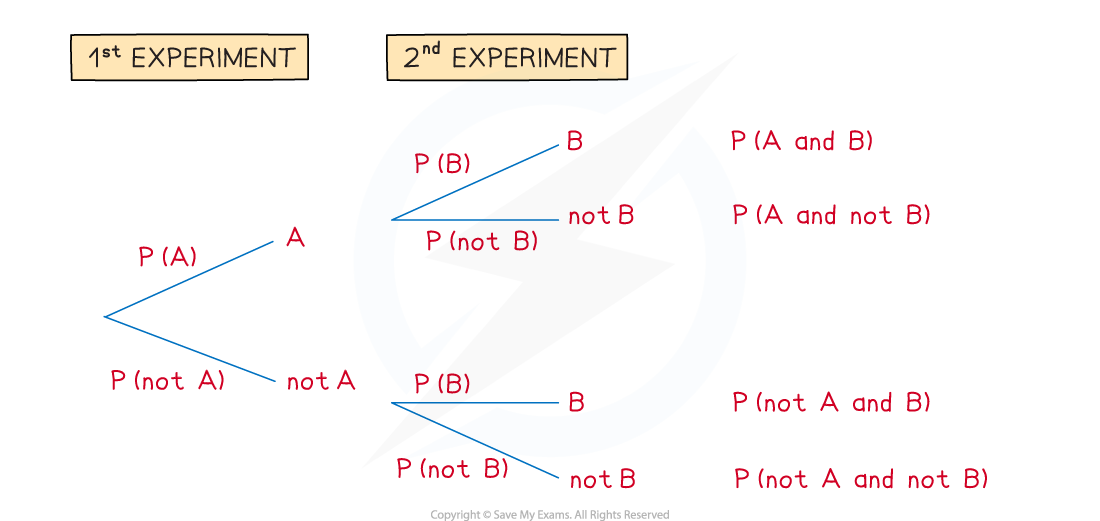
Tree diagrams can be used for repeated experiments with two outcomes
The 1st experiment has outcome A or not A
The 2nd experiment has outcome B or not B
Read the tree diagram from left to right along its branches
For example, the top branches give A followed by B
This is called A and B
How do I find probabilities from tree diagrams?
Write the probabilities on each branch
Remember that P(not A) = 1 - P(A)
Probabilities on each pair of branches add to 1
Multiply along the branches from left to right
This gives P(1st outcome and 2nd outcome)
Add between the separate cases
For example
P('A and B' or 'A and not B') = P(A and B) + P(A and not B)
The probabilities of all possible cases add to 1
How do I use tree diagrams with conditional probability?
Probabilities that depend on a particular thing having happened first in a tree diagram are called conditional probabilities
For example a team's win and loss probabilities in one game may change depending on whether they won or lost the previous game
You might be interested in the probability of them winning a game after losing the previous one
This probability will appear in the tree diagram in the set of branches that follow on from 'lose' in the first set of branches
Or you might be asked to draw or complete a tree diagram for, say, the situation when two counters are drawn from a bag of different coloured counters without replacement
The probabilities on the second set of branches will change depending on which branch has been followed on the first set of branches
The denominators in the probabilities for the second set of branches will be one less than the denominators on the first set of branches
The numerators on the second set of branches will also change depending on what has happened on the first set of branches
See the second Worked Example below for an example of this
Conditional probability questions are sometimes (but not always!) introduced by the expression 'given that...'
For example 'Find the probability that the team win their next game given that they lost their previous game'
Conditional probabilities are sometimes written using the 'straight bar' notation
That is read as 'the probability of A given B'
For example would be the probability that the team wins, given that they lost their previous game
Examiner Tips and Tricks
Remember
Tree diagrams have built-in checks
the probabilities for each pair of branches should add up to 1
the probabilities for all final outcomes should add up to 1
When multiplying along branches with fractions, don't cancel fractions in your working - having the same denominator makes them easier to add together!
Worked Example
Lisa drives through two sets of traffic lights on her way to work.
Each set of traffic lights has only two options: green or red.
The probability of the first set of traffic lights being on green is .
The probability of the second set of traffic lights being on green is .
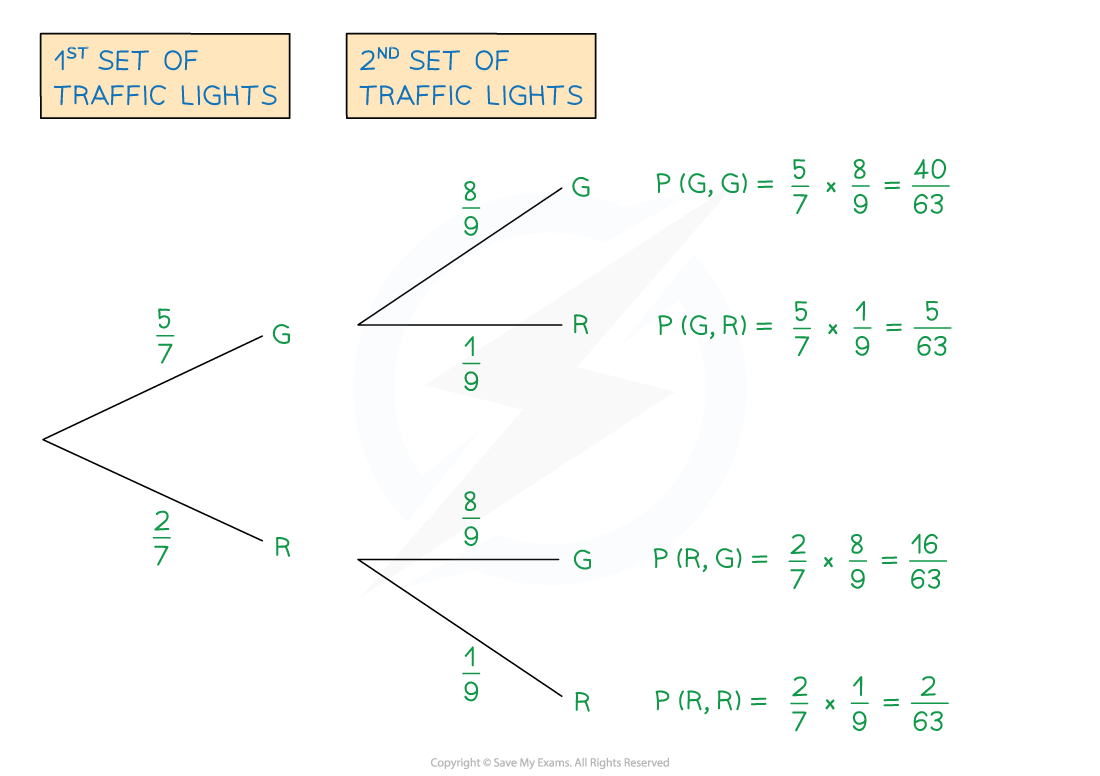
(a) Draw and label a tree diagram. Be sure to show the probabilities of every possible outcome.
Work out the probabilities of each set of traffic lights being on red, R
Use P(red) = 1 - P(green)
Draw the branches (with a label of G or R on the ends)
Write the probabilities above each branch
Calculate probabilities of each outcome by multiplying along the branches from left to right
(b) Find the probability that both sets of traffic lights are on red.
This is the answer for P(R, R) from the tree diagram
(c) Find the probability that at least one set of traffic lights is on red.
This means the 1st is green and the 2nd is red
Or the 1st is red and the 2nd is green
Or the 1st is red and the 2nd is red ('at least one' could mean both)
Add the probabilities for the separate cases
Alternative Method
At least one red means all the possible cases shown except two greens
So P(at least 1 red) = 1 - P(two greens)
Worked Example
Liana has 10 pets: 7 guinea pigs (G) and 3 rabbits (R).
Liana is choosing two pets to feature in her latest online video.
Firstly, she is going to choose one of the pets at random.
Once she has carried that pet to her video studio, she is going to go back and choose a second pet at random, to also feature in the video.
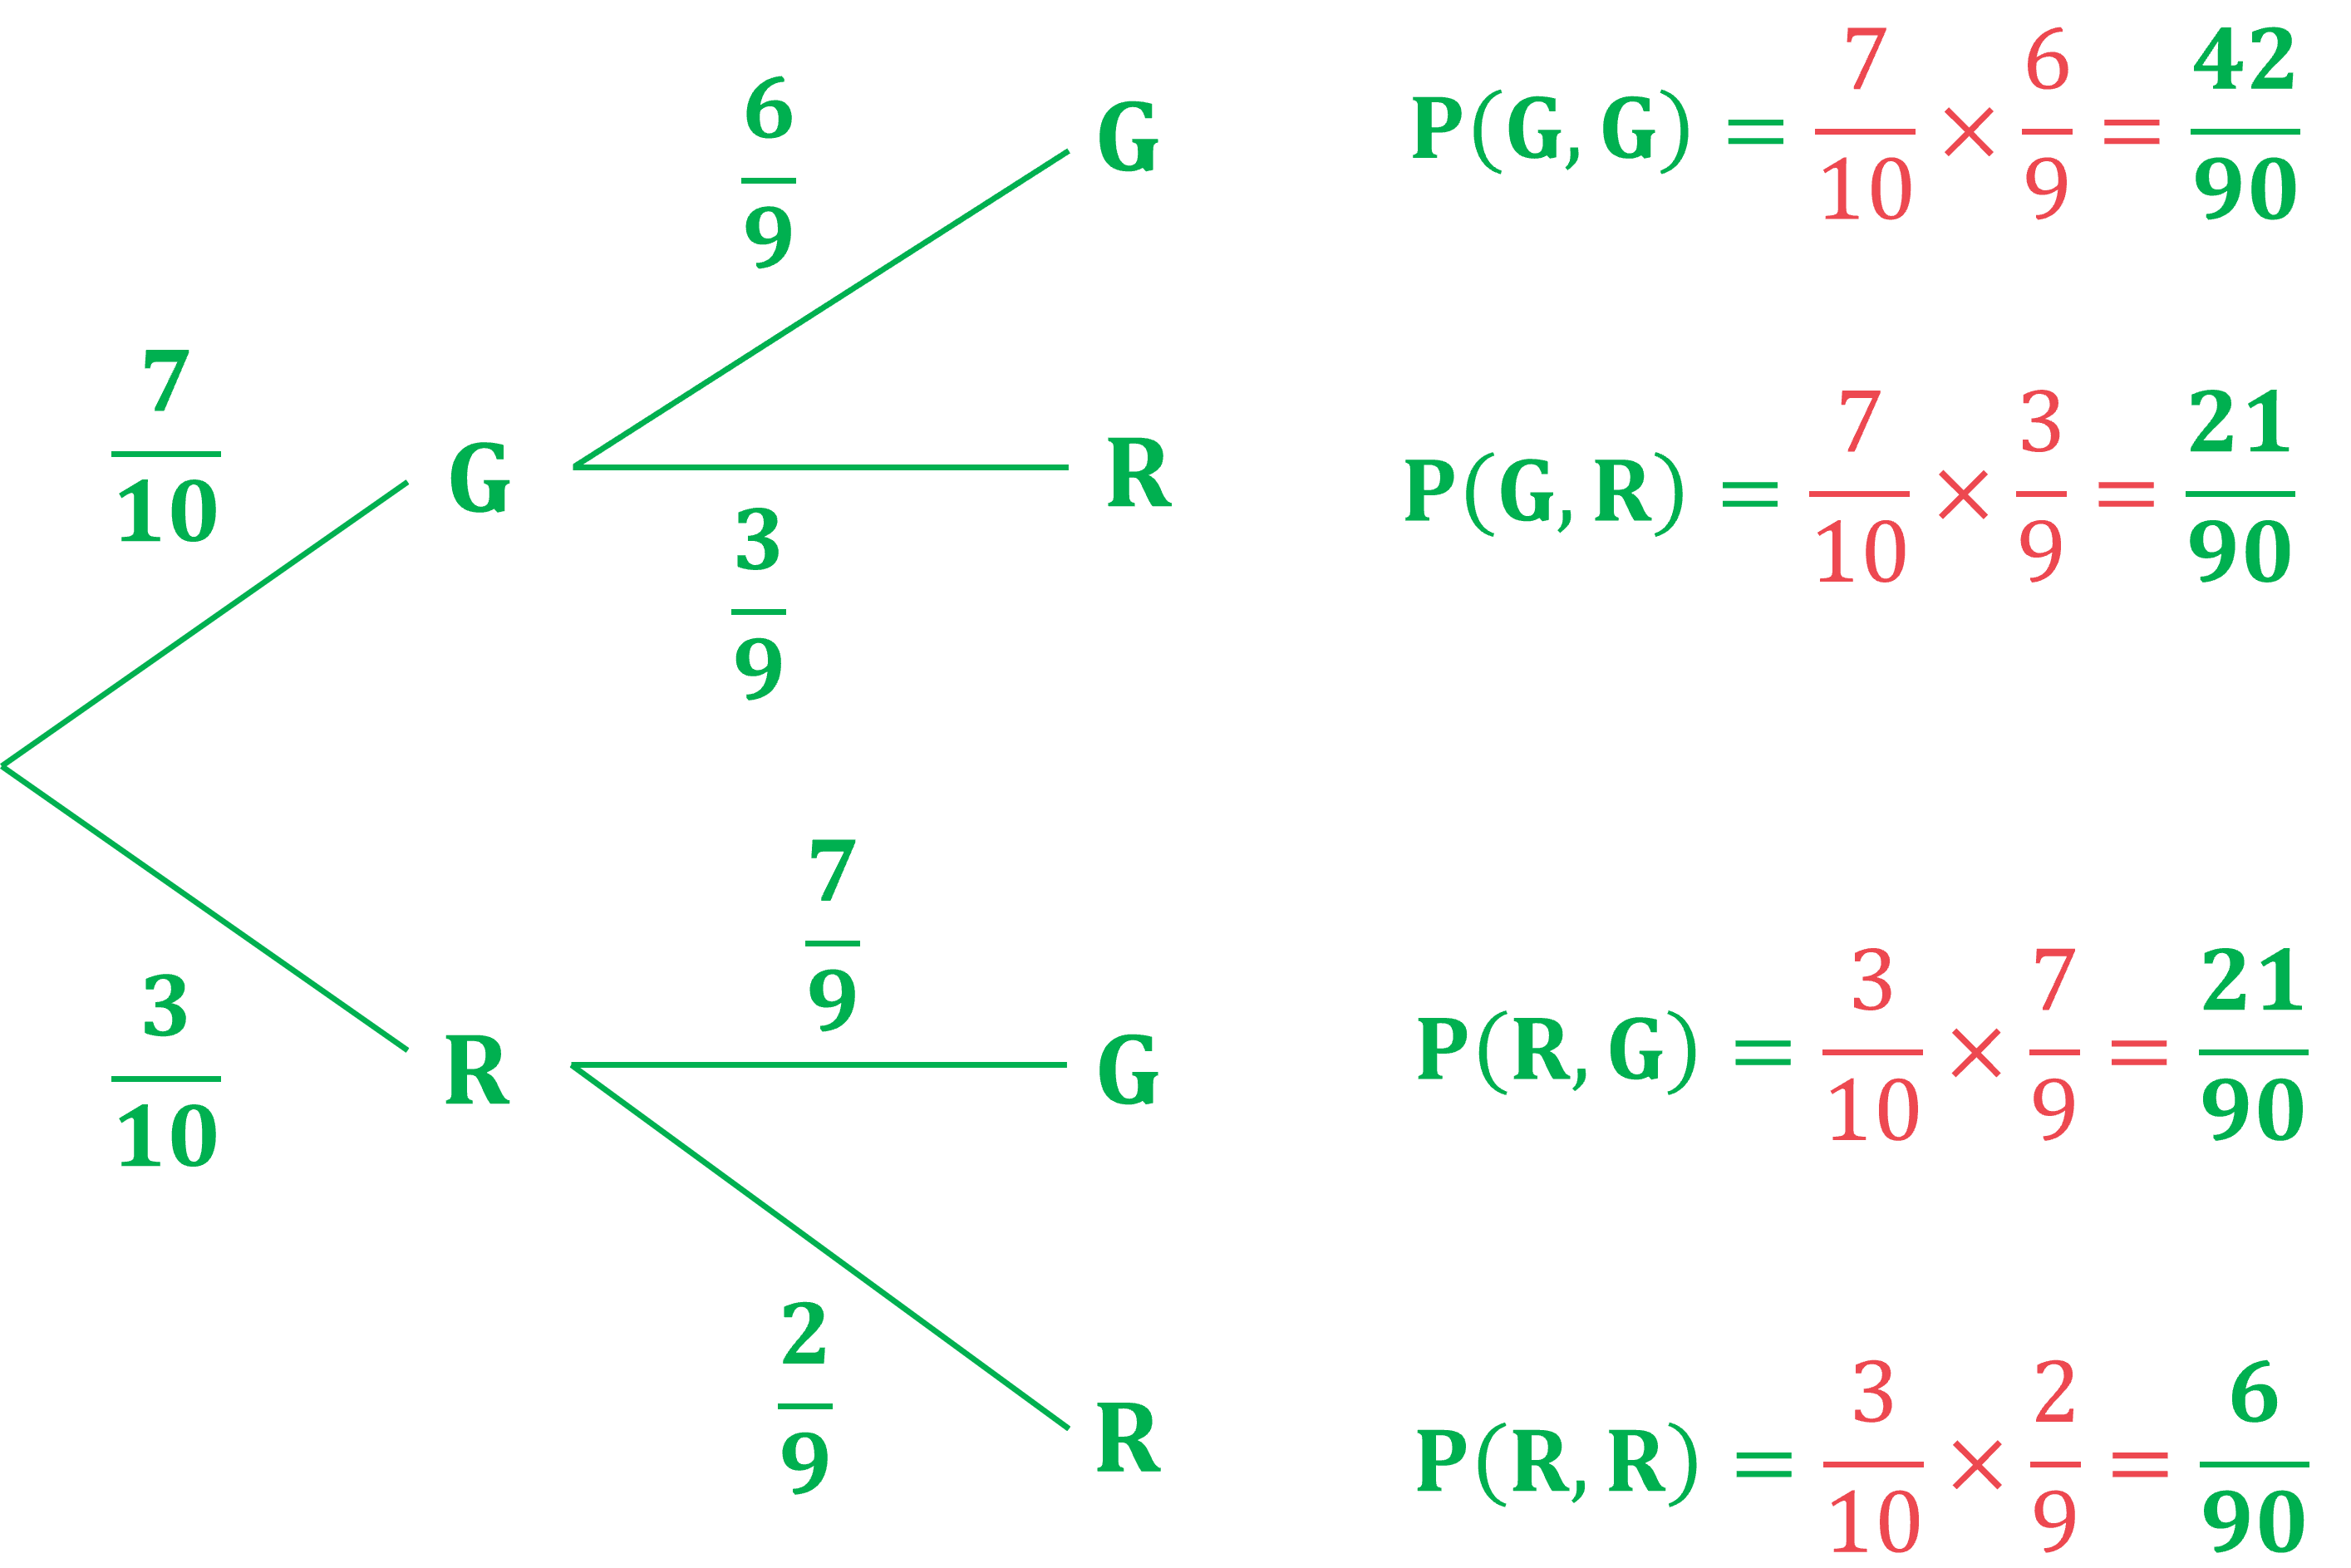
(a) Draw and label a tree diagram including the probabilities of all possible outcomes.
For the 1st pet chosen, there will be a 7/10 probability of choosing a guinea pig, and a 3/10 probability of choosing a rabbit
If the first pet is a guinea pig, there will only be 6 guinea pigs and 3 rabbits left (9 animals total)
So for the second pet the probability of choosing a guinea pig would be 6/9, and probability of choosing a rabbit would be 3/9
If the first pet is a rabbit, there will only be 7 guinea pigs and 2 rabbits left (9 animals total)
So for the second pet the probability of choosing a guinea pig would be 7/9, and probability of choosing a rabbit would be 2/9
Put these probabilities into the correct places on the tree diagram, and then multiply along the branches to find the probabilities for each outcome
(b) Write down the probability that the second pet is a guinea pig, given that the first pet was a rabbit.
This conditional probability can be done by looking at the branches, without needing the conditional probability formula
This is the probability on the second pet 'G' branch that follows 'R' for the first pet
Using the conditional probability formula would also give this answer
(c) Find the probability that Liana chooses two rabbits.
As we have already calculated this probability in the tree diagram, we can just write the answer down
The simplified answer is also accepted, but is not necessary to get full marks
(d) Find the probability that Liana chooses two different kinds of animal.
This would be "G and R" or "R and G" so we need to add two of the final probabilities
The simplified answer is also accepted, but is not necessary to get full marks
You could also do this question using 1 - P(both the same)

Unlock more, it's free!
Join the 100,000+ Students that ❤️ Save My Exams
the (exam) results speak for themselves:

Was this revision note helpful?
Build on this topic
