Gas Exchange (Edexcel IGCSE Science (Double Award) (Modular): Biology Unit 1): Exam Questions

Exam code: 4XSD1

1 hour8 questions
1a
2 marks

The diagram below shows an alveolus (plural alveoli).

Line diagram of a single alveolus, drawn as a rounded sac opening into an airway above. The wall of the sac is made of a single layer of flattened cells, each with a nucleus, while the cells lining the airway above are much taller and carry dark blocks of mucus. Running beneath the alveolus is a capillary, its wall also one cell thick, containing red blood cells drawn as ring shapes. Arrows inside the capillary and beyond its right-hand end show the direction of movement. Three labels read Alveolus, Adjacent capillary and Blood flow

Explain one feature seen in the alveolus in the diagram which allows efficient gas exchange.

1b
1 mark

Label the diagram in part (a), using an 'X', indicate where the oxygen content of the blood is the highest.

1c
2 marks

The estimated surface area of the lung system of a new-born baby is 4.2 m2; this is around one twentieth of the overall surface area of a typical adult's lungs.

Calculate the overall surface area of a typical adult's lungs.

1d
1 mark

The following list contains structures found within the breathing system.

structure

order

 bronchus


nasal cavity


 alveolus

1

 trachea


 bronchioles


Complete the table by numbering the structures to show the sequence in which air passes through them during an exhalation. The first structure has been numbered for you.

1e
2 marks

Describe the actions of the intercostal muscle and diaphragm during inhalation.

2a
1 mark

The diagram below shows some of the structures in the human body involved with the ventilation process.

Line diagram of a cross-section through one human lung, showing the branching airways spreading through the lung tissue and a small cluster of round sacs at the end of one branch labelled Alveolus. The wide tube entering the lung from above is labelled Trachea. A curved, dome-shaped sheet lying beneath the lung and bulging upwards is labelled Organ 1

Identify Organ 1 in the diagram above.

2b
2 marks

Describe how the contraction of Organ 1 in part (a) aids the inhalation process.

2c
1 mark

Other than Organ 1, identify one set of muscles involved with ventilation.

2d
6 marks

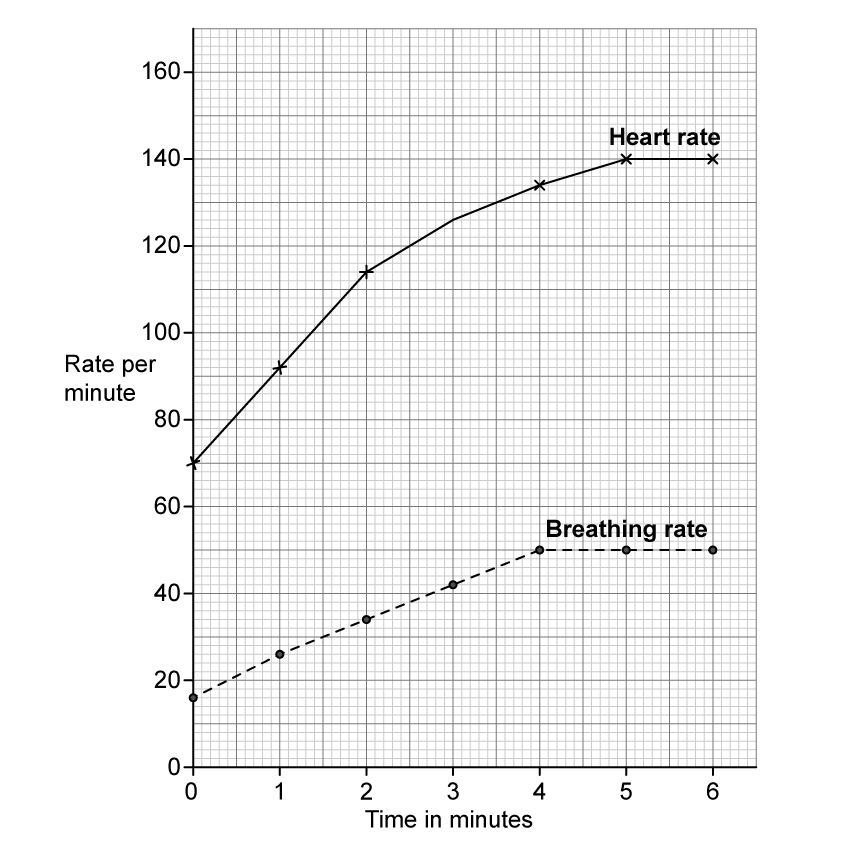
The graph below shows the effect of exercise on heart rate and breathing, or ventilation rate. Exercise started at 0 minutes during the investigation.

Line graph drawn on a fine square grid with time in minutes from 0 to 6 on the horizontal axis and rate per minute from 0 to 160 on the vertical axis. A solid line labelled Heart rate, with crosses as points, rises steeply from 70 at 0 minutes to 140 at 5 minutes and then stays level at 140 at 6 minutes. A dashed line labelled Breathing rate, with round dots as points, rises from 16 at 0 minutes to 50 at 4 minutes and then stays level at 50 at 5 and 6 minutes

(i) Calculate the change in breathing rate between 0 and 4 minutes.

[2]

(ii) Explain the change in breathing rate that occurs during exercise.

[2]

(iii) The individual in the investigation stopped exercising after 6 minutes.

Predict how this would affect the breathing rate line shown on the graph.

[2]

1a
1 mark

Figure 1 shows the human thorax.

Figure 1

Line diagram of the human thorax, drawn as an outline of the head, neck and upper body seen from the front with the airways shown inside. A cutaway of the head shows the nasal cavity, mouth and throat leading into a ringed tube that runs down the centre of the neck. This tube divides into two branches, one entering each lung, and inside each lung the branches divide again and again into finer tubes ending in small circles. Below the lungs lies a curved sheet that arches upwards across the full width of the body cavity. Three label lines read Q, pointing to the ringed central tube, R, pointing to a branch just below the point where the central tube divides, and S, pointing to the curved sheet beneath the lungs

Name structures Q and R.

  • Q = bronchiole and R = trachea

  • Q = bronchus and R = trachea

  • Q = trachea and R = bronchiole

  • Q = trachea and R = bronchus

1b
3 marks

Using Figure 1, explain how structure S helps a person to exhale.

1c
3 marks

The graph shows how the volume of air exhaled varies with time during one breath.

This is shown for a person with lung disease and a person with healthy lungs.

Line graph with time on the horizontal axis and volume of air exhaled on the vertical axis, neither axis carrying a scale. Two curves start together at the origin. The upper curve, labelled person with healthy lungs, rises steeply and levels off early at a high volume. The lower curve, labelled person with lung disease, rises much more gradually and is still climbing towards a lower final volume when the graph ends

Explain why a person with lung disease is often breathless and unable to exercise.

2a
5 marks

The diagram shows apparatus a student uses to compare inhaled and exhaled air.

Line diagram of two conical flasks, labelled flask A on the left and flask B on the right, each holding a shallow shaded layer of limewater and sealed with a bung carrying two glass tubes. A central vertical tube labelled mouthpiece runs down between the flasks and branches left and right into rubber tubing, connecting to the inner tube of each flask. In flask A the inner tube from the mouthpiece stops just below the bung, while the outer tube on the far left, which is open to the air, reaches down into the limewater. In flask B the arrangement is reversed: the inner tube from the mouthpiece reaches down into the limewater, while the outer tube on the far right, which is open to the air, stops just below the bung

The student breathes in and out through the mouthpiece for one minute.

(i) Explain which flask exhaled air passes through.

[2]

(ii) Explain the changes that will happen in the limewater in flask A and in flask B.

[2]

(iii) The student uses limewater to compare the composition of exhaled and inhaled air.

Suggest an alternative substance that they could use.

[1]

2b
4 marks

Describe the role of the diaphragm and the intercostal muscles in inhalation.

3a
4 marks

The table shows the percentage of total blood flow in different body parts of a horse at rest and when running.

Body part

Percentage of total blood flow (%)

At rest

When running

leg muscle

15

82

intestine

30

3

Comment on the changes in the percentage of total blood flow in these body parts.

3b
2 marks

The horse breathes faster and deeper when running.

Explain why the horse continues to breathe faster and deeper for a period of time after it has stopped running.

3c
1 mark

The diagram shows the location of the lungs in a horse.

4bi1br-nov-2020-q3a-horse---sq

Identify the part labelled X.

  • bronchiole

  • bronchus

  • oesophagus

  • trachea

3d
1 mark

Identify which blood vessel transports blood to the horse’s lungs.

  • aorta

  • pulmonary artery

  • pulmonary vein

  • vena cava

3e
1 mark

Identify what happens to the diaphragm and the external intercostal muscles when the horse breathes in.

  • diaphragm contracts and external intercostal muscles contract

  • diaphragm contracts and external intercostal muscles relax

  • diaphragm relaxes and external intercostal muscles contract

  • diaphragm relaxes and external intercostal muscles relax

1a
4 marks

The data in the table were collected in Japan during a seven-year study.

Scientists collected data on the age of mothers and whether they smoked during pregnancy.

They also recorded the percentage of the babies that had a low birth mass.

Age of mother in years

Data for mothers who did not smoke during pregnancy

Data for mothers who did smoke during pregnancy

Number of mothers

Percentage of babies with low birth mass

Number of mothers

Percentage of babies with low birth mass

19 and under

1331

11.5

356

16.0

20-24

11243

9.8

1677

13.2

25-29

24099

9.0

2211

13.3

30-34

28695

9.2

1847

14.5

35-39

16537

10.5

934

21.1

40 and over

3242

12.3

181

22.1

(i) Calculate the percentage of mothers aged 19 years and under who smoked during pregnancy.

[2]

(ii) Determine the ratio of non-smokers to smokers used in the study.

Give the ratio as the nearest whole number (n) in the form n:1

[2]

1b
6 marks

A student examines this data and concludes that smoking is the main factor that causes low birth mass.

Use the data and your own biological knowledge to comment on this conclusion.

2a
6 marks

An electronic cigarette (e‐cigarette) has been invented.

E‐cigarettes are held in the hand like normal cigarettes. Instead of burning tobacco, e‐cigarettes heat a liquid that contains nicotine and flavourings to produce a vapour that is inhaled.

Scientists carried out an investigation to see how the smoking habits of students changed between 2011 and 2016.

Each year they determined the percentage of students who used e‐cigarettes and the percentage of students who smoked normal cigarettes during the year.

The results are shown in the table.

Year

Percentage of students

Using e-cigarettes

Smoking normal cigarettes

2011

1.5

15.8

2012

2.8

14.0

2013

4.5

12.7

2014

13.4

9.5

2015

16.0

9.3

2016

11.3

8.0

Plot a line graph to show how the percentage of students who used e‐cigarettes and the percentage of students who smoked normal cigarettes changed between 2011 and 2016.

Join the points with straight lines.

4bi1br-nov-2020-q8a-graph-paper---sq
2b
2 marks

Describe the changes in the percentages of students smoking cigarettes and using e‐cigarettes between 2011 and 2016.

2c
2 marks

The scientists interviewed 60 000 students each year during the period of the investigation.

Calculate the change in the number of students who were smoking normal cigarettes from 2011 to 2016.

2d
6 marks

Some people are promoting e‐cigarettes as a healthier alternative to smoking normal cigarettes.

(i) Suggest why using e‐cigarettes may be thought to be less harmful than smoking normal cigarettes.

[4]

(ii) Suggest why many doctors are concerned about promoting the use of e‐cigarettes to young people.

[2]

3a
8 marks

The scientist Richard Doll collected data about deaths from cancer in the 1950s.

The table shows data for four groups.

Cause of death

Number of deaths

non-smokers

light smokers

medium smokers

heavy smokers

total

 lung cancer

0

12

11

13

36

 other cancers

15

35

24

18

92

 all deaths

82

345

206

157

790

(i) Plot a bar chart to show the number of deaths from lung cancer and from other cancers for each of the four groups.

[5]

6mJEBkx4_graph-q9a

(ii) Calculate the difference in the percentage of all deaths caused by lung cancer in heavy smokers compared to the percentage of all deaths caused by lung cancer in light smokers.

[3]

3b
2 marks

This table gives no information about the age of the people who died.

Suggest why age may affect the likelihood of dying from lung cancer.

3c
2 marks

Explain one effect, other than lung cancer, that smoking has on health.