Probability Density Function (Edexcel International A Level (IAL) Maths: Statistics 2): Revision Note
Exam code: YMA01

Calculating Probabilities using PDF
What is a probability density function (p.d.f.)?
For a continuous random variable, it is often possible to model probabilities using a function
This function is called a probability density function (p.d.f.)
For the continuous random variable, X , it would usually be denoted as a function of x (such as f(x) or g(x) ) and is usually given piecewise
e.g.
f(x) should be defined for all values of
The distribution (or density) of probabilities can be illustrated by the graph of f(x)
The graph does not need to start and end on the x-axis
The graph does not have to be continuous

For f(x) to represent a p.d.f. the following conditions must apply
for all values of x
This is the equivalent to for a discrete random variable
The area under the graph must total 1
This is equivalent to for a discrete random variable
How do I find probabilities using a probability density function (p.d.f.)?
The probability that the continuous random variable X lies in the interval
, where X has the probability density function f(x) , is given by
As with the normal distribution
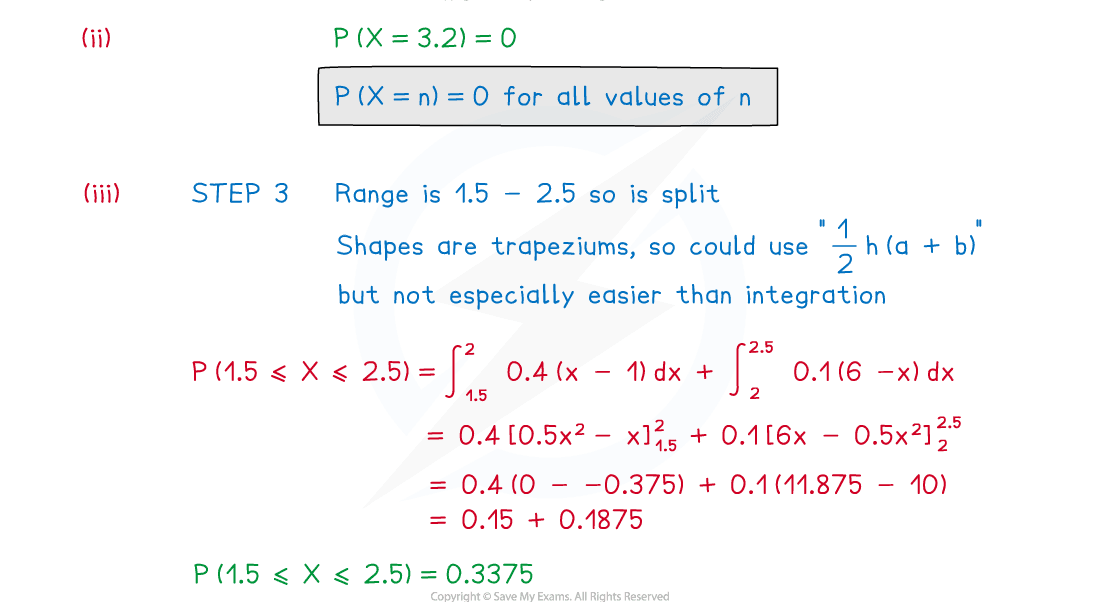
for any continuous random variable, for all values of n
One way to think of this is that in the integral above
Piecewise Function are often used as the p.d.f. is not often a single function of x
Finding a probability may involve splitting the area across more than one piece of the function
This will depend on the limits a and b in that is being found
How do I solve problems using the PDF?
Some questions may ask for justification of the use of a given function for a probability density function
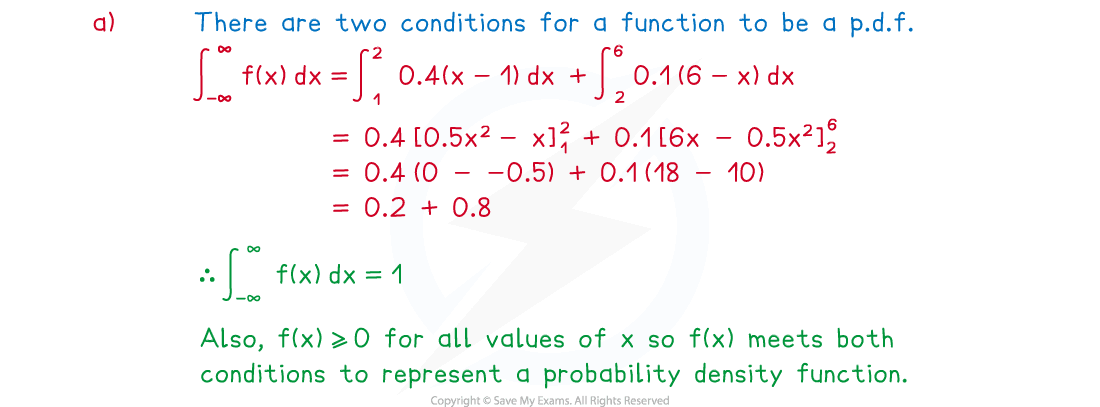
In such cases check that the function meets the two conditions for all values of and the total area under the graph is 1
If asked to find a probability
STEP 1
As the probability density function, f(x), is usually given piecewise make sure you are clear about the values of x for which each part applies
e.g.
STEP 2
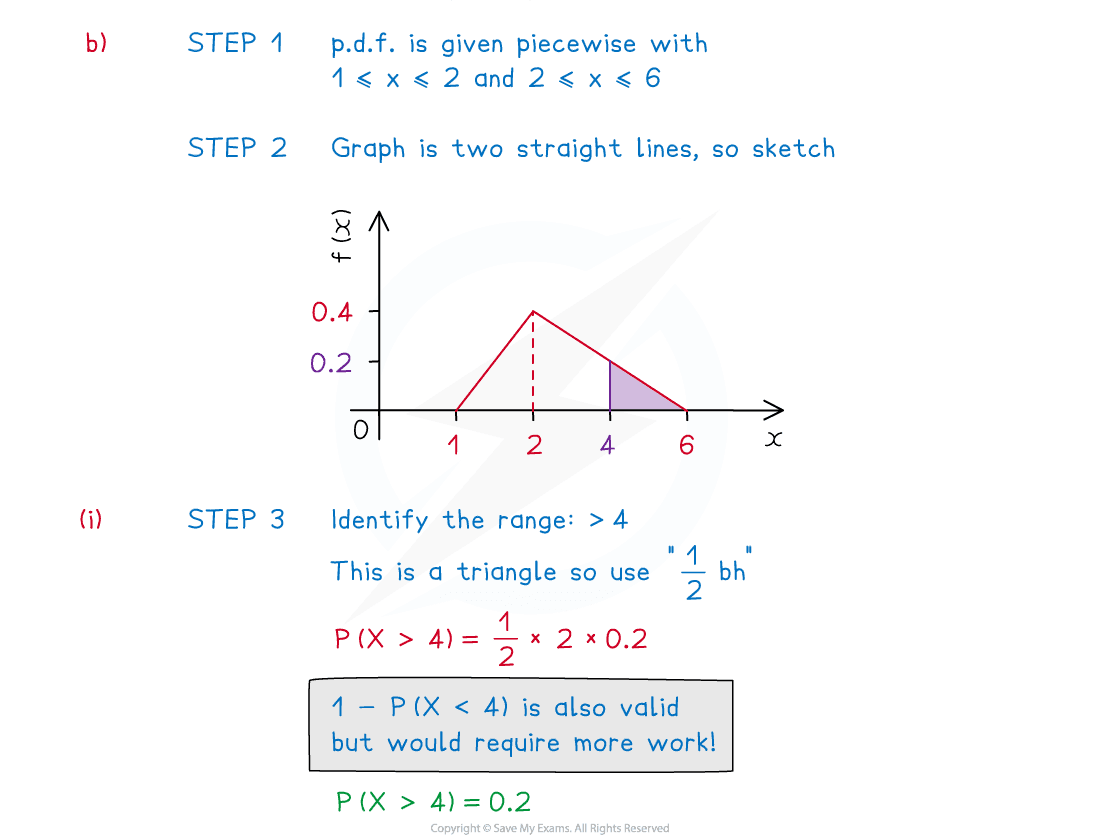
If simple to do so, sketching the graph of y= f(x) may help to find the probability
Look for basic shapes such as triangles or rectangles; finding areas of these is easy and avoids integration
Look for symmetry in the graph that may make the problem easier
STEP 3
Identify the range of X, particularly noting if it is split across different parts of the p.d.f.
Find the required area (probability), either by basic shapes or integrate f(x) and evaluate it between the two limits, splitting if necessary
Trickier problems may involve finding a limit of the integral given its value
i.e. one of the values in the range of X, given the probability
e.g. Find the value of given
Worked Example
The continuous random variable, , has probability density function
(a) Show that can represent a probability density function.
(b) Find
(i)
(ii)
(iii)
Answer:
Examiner Tips and Tricks
If the graph is easy to draw, then a sketch of f(x) is helpful
Some p.d.f. graphs have symmetry, common shapes such as triangles or rectangles so areas are easier to find, avoiding the need for integration
Always keep an eye for probabilities that are split across different parts of a piecewise function
Median and Mode of a CRV
What is meant by the median of a continuous random variable?
The median, m, of a continuous random variable, X , with probability density function f(x) is defined as the value of the continuous random variable X, such that
Since this can also be written as
If the p.d.f. is symmetrical (i.e. the graph of y = f(x) is symmetrical) then the median will be halfway between the lower and upper limits of x
In such cases the graph of y=f(x) has axis of symmetry in the line x = m
How do I find the median of a continuous random variable?
By solving one of the equations to find m
and
If the graph of is symmetrical, symmetry may be used to deduce the median
For piecewise functions, you will need to determine which part of the function the median lies within to determine which equation to use
If there are more than two (non-zero) parts to a function then the integration may need splitting
You can also use the cumulative distribution function to find the median
How do I find quartiles (or percentiles) of a continuous random variable?
In a similar way to finding the median
The lower quartile will be the value L such that P(X ≤ L) = 0.25 or
P(X ≥ L) = 0.75The upper quartile will be the value U such that P(X ≤ U) = 0.75 or
P(X ≥ U) = 0.25
Percentiles can be find in the same way
The 15th percentile will be the value k such that P(X ≤ k) = 0.15 or
P(X ≥ k) = 0.85
In all cases start by determining which part(s) of the function are involved
What is meant by the mode of a continuous random variable?
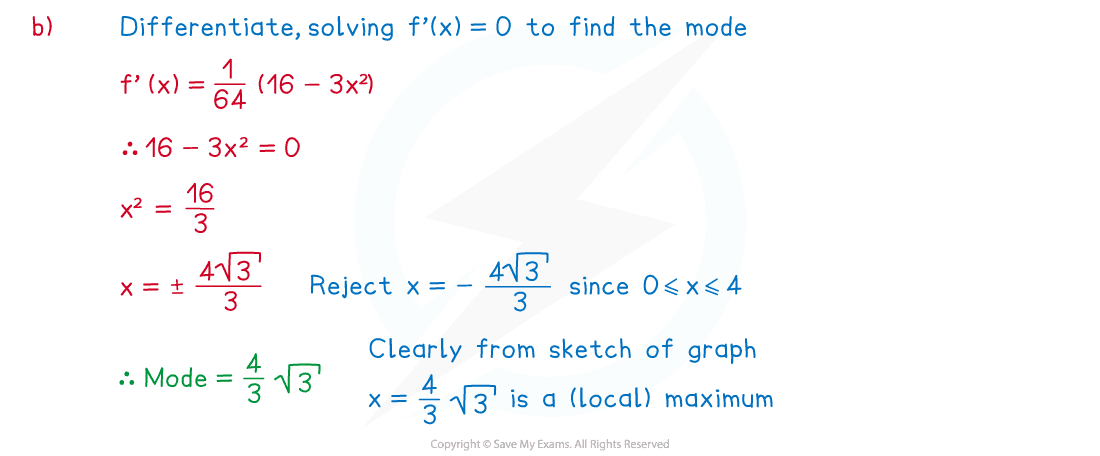
The mode of a continuous random variable, X , with probability density function f(x) is the value of x that produces the greatest value of f(x) .
How do I find the mode of a PDF?
This will depend on the type of function f(x); the easiest way to find the mode is by considering the shape of the graph of y= f(x)
If the graph is a curve with a (local) maximum point, the mode can be found by differentiating and solving the equation f'(x) = 0
If there is more than one solution to f'(x) = 0 , further work may be needed to deduce which answer is the mode
Look for valid values of from the definition of the p.d.f.
Use the second derivative (f'' (x) ) to deduce the nature of each stationary point
You may need to check the values of f(x) at the endpoints too
Worked Example
The continuous random variable has probability density function defined as
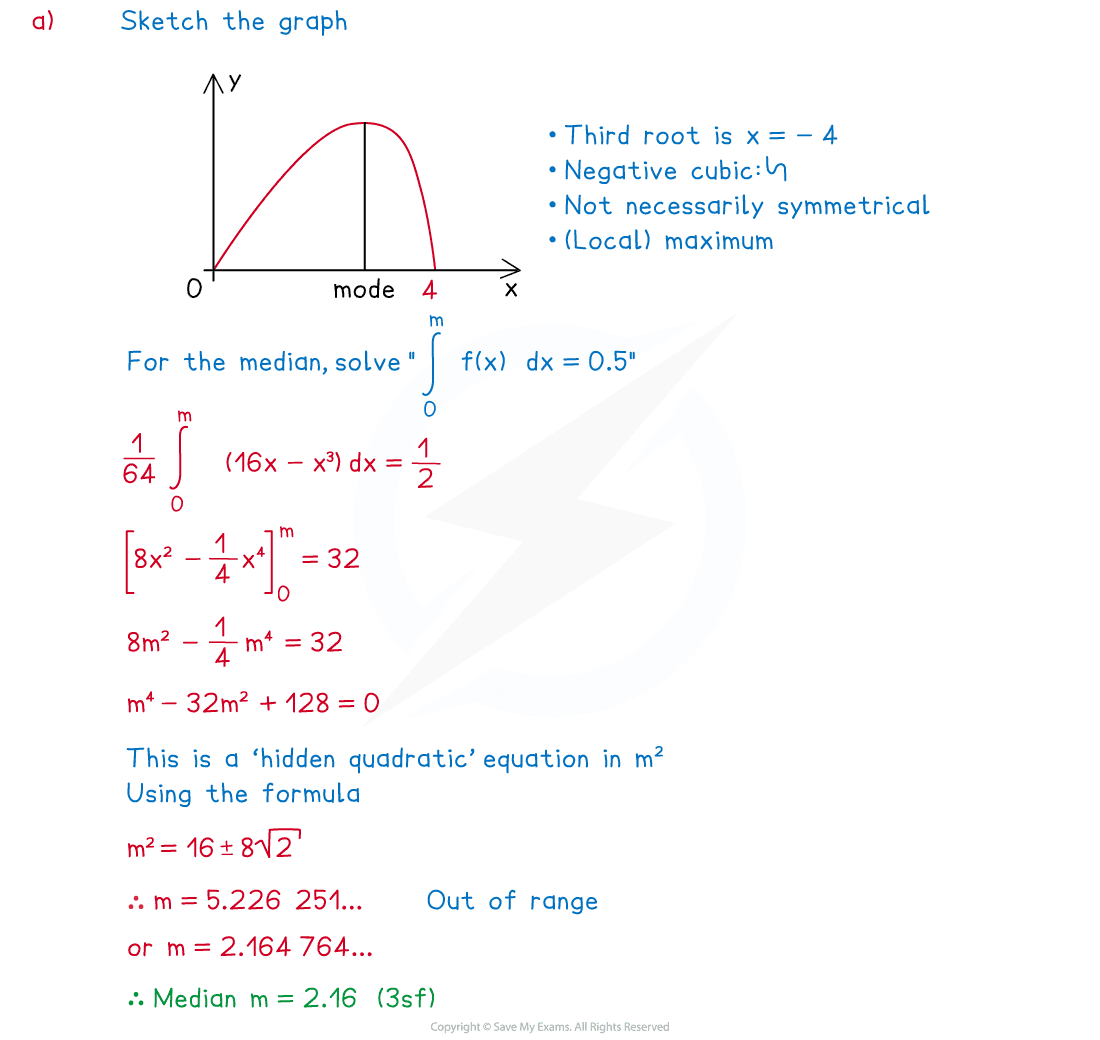
(a) Find the median of X, giving your answer to three significant figures
(b) Find the exact value of the mode of X
Answer:
Examiner Tips and Tricks
Avoid spending too long sketching the graph of y = f(x), only do this if the graph is straightforward as finding the median and mode by other means can be just as quick

Unlock more, it's free!
Join the 100,000+ Students that ❤️ Save My Exams
the (exam) results speak for themselves:

Was this revision note helpful?
Build on this topic
