13 marks
In this question you must show all stages of your working.
Solutions relying on calculator technology are not acceptable.
Use the substitution to show that
where , and are constants to be determined.
Was this exam question helpful?
Exam code: 9FM0
In this question you must show all stages of your working.
Solutions relying on calculator technology are not acceptable.
Use the substitution to show that
where , and are constants to be determined.
Was this exam question helpful?
During 2029, the number of hours of daylight per day in London, , is modelled by the equation
where is the number of days after 1st January 2029 and the angle is in radians.
Show that, according to the model, the number of hours of daylight in London on the 31st January 2029 will be 8.13 to 3 significant figures.
Use the substitution to show that can be written as
where , and are constants to be determined.
Hence determine, according to the model, the date of the first day of 2029 when there will be at least 12 hours of daylight in London.
Was this exam question helpful?
Use the substitution to show that
where is an arbitrary constant.
Was this exam question helpful?
Show that the substitution transforms the integral
into the integral
Was this exam question helpful?
Use the substitution to prove the identity
Was this exam question helpful?
Using the substitution
show that can be written in the form
Hence solve, for , the equation
giving your answers to 2 decimal places where appropriate.
Was this exam question helpful?
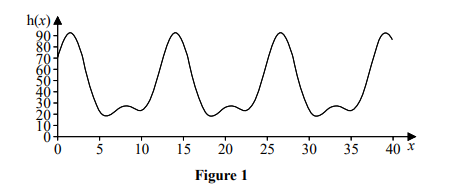
Figure 1 shows the graph of the function with equation
Show that
where
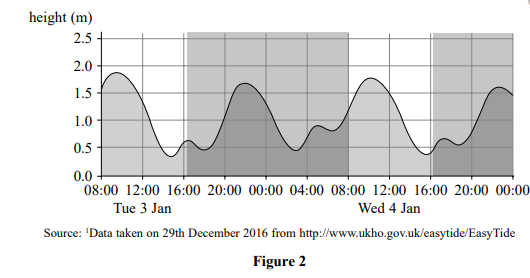
Figure 2 shows a graph of predicted tide heights, in metres, for Portland harbour from 08:00 on the 3rd January 2017 to the end of the 4th January 2017.
The graph of , where is a constant and is the number of hours after 08:00 on 3rd of January, can be used to model the predicted tide heights, in metres, for this period of time.
(i) Suggest a value of that could be used for the graph of to form a suitable model.
(ii) Why may such a model be suitable to predict the times when the tide heights are at their peaks, but not to predict the heights of these peaks?
Use Figure 2 and the result of part (a) to estimate, to the nearest minute, the time of the highest tide height on the 4th January 2017.
Was this exam question helpful?
In this question you must show all stages of your working.
Solutions relying on calculator technology are not acceptable.
Use the substitution to show that
where , and are constants to be determined.
Was this exam question helpful?