14 marks
Outline the relationship between the physical environment and health in a local area you have studied.
Was this exam question helpful?
Exam code: 7037
Outline the relationship between the physical environment and health in a local area you have studied.
Was this exam question helpful?
Outline the role of external agencies in improving global health.
Was this exam question helpful?
Which of the following best describes the epidemiological transition?
A fall in both birth rates and death rates as a country becomes wealthier.
The movement of people from rural areas to cities in search of better health care.
A shift in the main causes of death from infectious diseases to non-communicable, degenerative diseases as a country develops.
An increase in life expectancy caused entirely by improvements in medical technology.
Was this exam question helpful?
Outline strategies used to manage and mitigate the spread of malaria.
Was this exam question helpful?
Which of the following best explains why rates of asthma are often higher in urban areas?
Urban areas have larger populations of mosquitoes that transmit asthma.
Higher levels of air pollution from traffic and industry trigger and worsen asthma.
People in urban areas have less access to clean drinking water.
Urban areas have colder climates that cause asthma to spread between people.
Was this exam question helpful?
Figure 8 shows the relationship between access to improved drinking water and life expectancy for selected countries by income group.
Figure 8

The figure portrays the correlation between life expectancy and access to clean water. From the figure above, it is obvious to note the importance clean water has on people around the globe. Countries in which all their citizens have access to clean water have the highest life expectancy. Source: Isma Shahid 2015 (opens in a new tab)
Using Figure 8 and your own knowledge, assess links between water quality and health.
Was this exam question helpful?
Figure 7a shows deaths attributed to air pollution by country income groups in 2016.
Figure 7b shows the global distribution of the concentration of PM2.5 atmospheric pollution in 2016.
Figure 7a
deaths attributed to air pollution by country income groups in 2016

Note: PM2.5 refers to fine particles with diameters less than 2.5 micrometers.
Figure 7b
the global distribution of the concentration of PM2.5 atmospheric pollution in 2016

Note: The WHO Guideline for healthy air is less than 10 PM2.5
Analyse the data shown in Figure 7a and Figure 7b.
Was this exam question helpful?
Figure 7a shows the global pattern of obesity in 2014.
Figure 7b shows the highest ranked countries with diabetes in 1980 and 2014.
Figure 7c shows a Spearman’s rank calculation used to study whether there is a relationship between prevalence of obesity and diabetes in the countries shown for 2014.
Figure 7a
The global pattern of obesity in 2014

Figure 7b
Highest ranked countries with diabetes, 1980 and 2014

Figure 7c
The null hypothesis is: ‘There is no relationship between obesity and diabetes in the selected countries.’
Rs Value | 0.598 |
|---|---|
Critical Value at 0.05 significance level(n = 14) | 0.538 |
Analyse the data shown in Figures 7a, 7b and 7c.
Was this exam question helpful?
Figure 8 is a newspaper article from The Guardian which discusses food security issues in Ghana.
Figure 8

Using Figure 8 and your own knowledge, evaluate strategies used to ensure food security.
Was this exam question helpful?
Analyse the data shown in Figure 1, which shows global malaria deaths and cases, 2000–2022.
Figure 1: Global malaria deaths (thousands) and malaria cases (millions), 2000–2022
Year | Malaria deaths (thousands) | Malaria cases (millions) |
|---|---|---|
2000 | 900 | 263 |
2005 | 980 | 269 |
2010 | 655 | 218 |
2015 | 438 | 212 |
2019 | 558 | 229 |
2020 | 627 | 241 |
2022 | 608 | 249 |
Source: WHO World Malaria Report, 2022.
Was this exam question helpful?
Figure 8a shows deaths attributed to air pollution by country income groups in 2016.
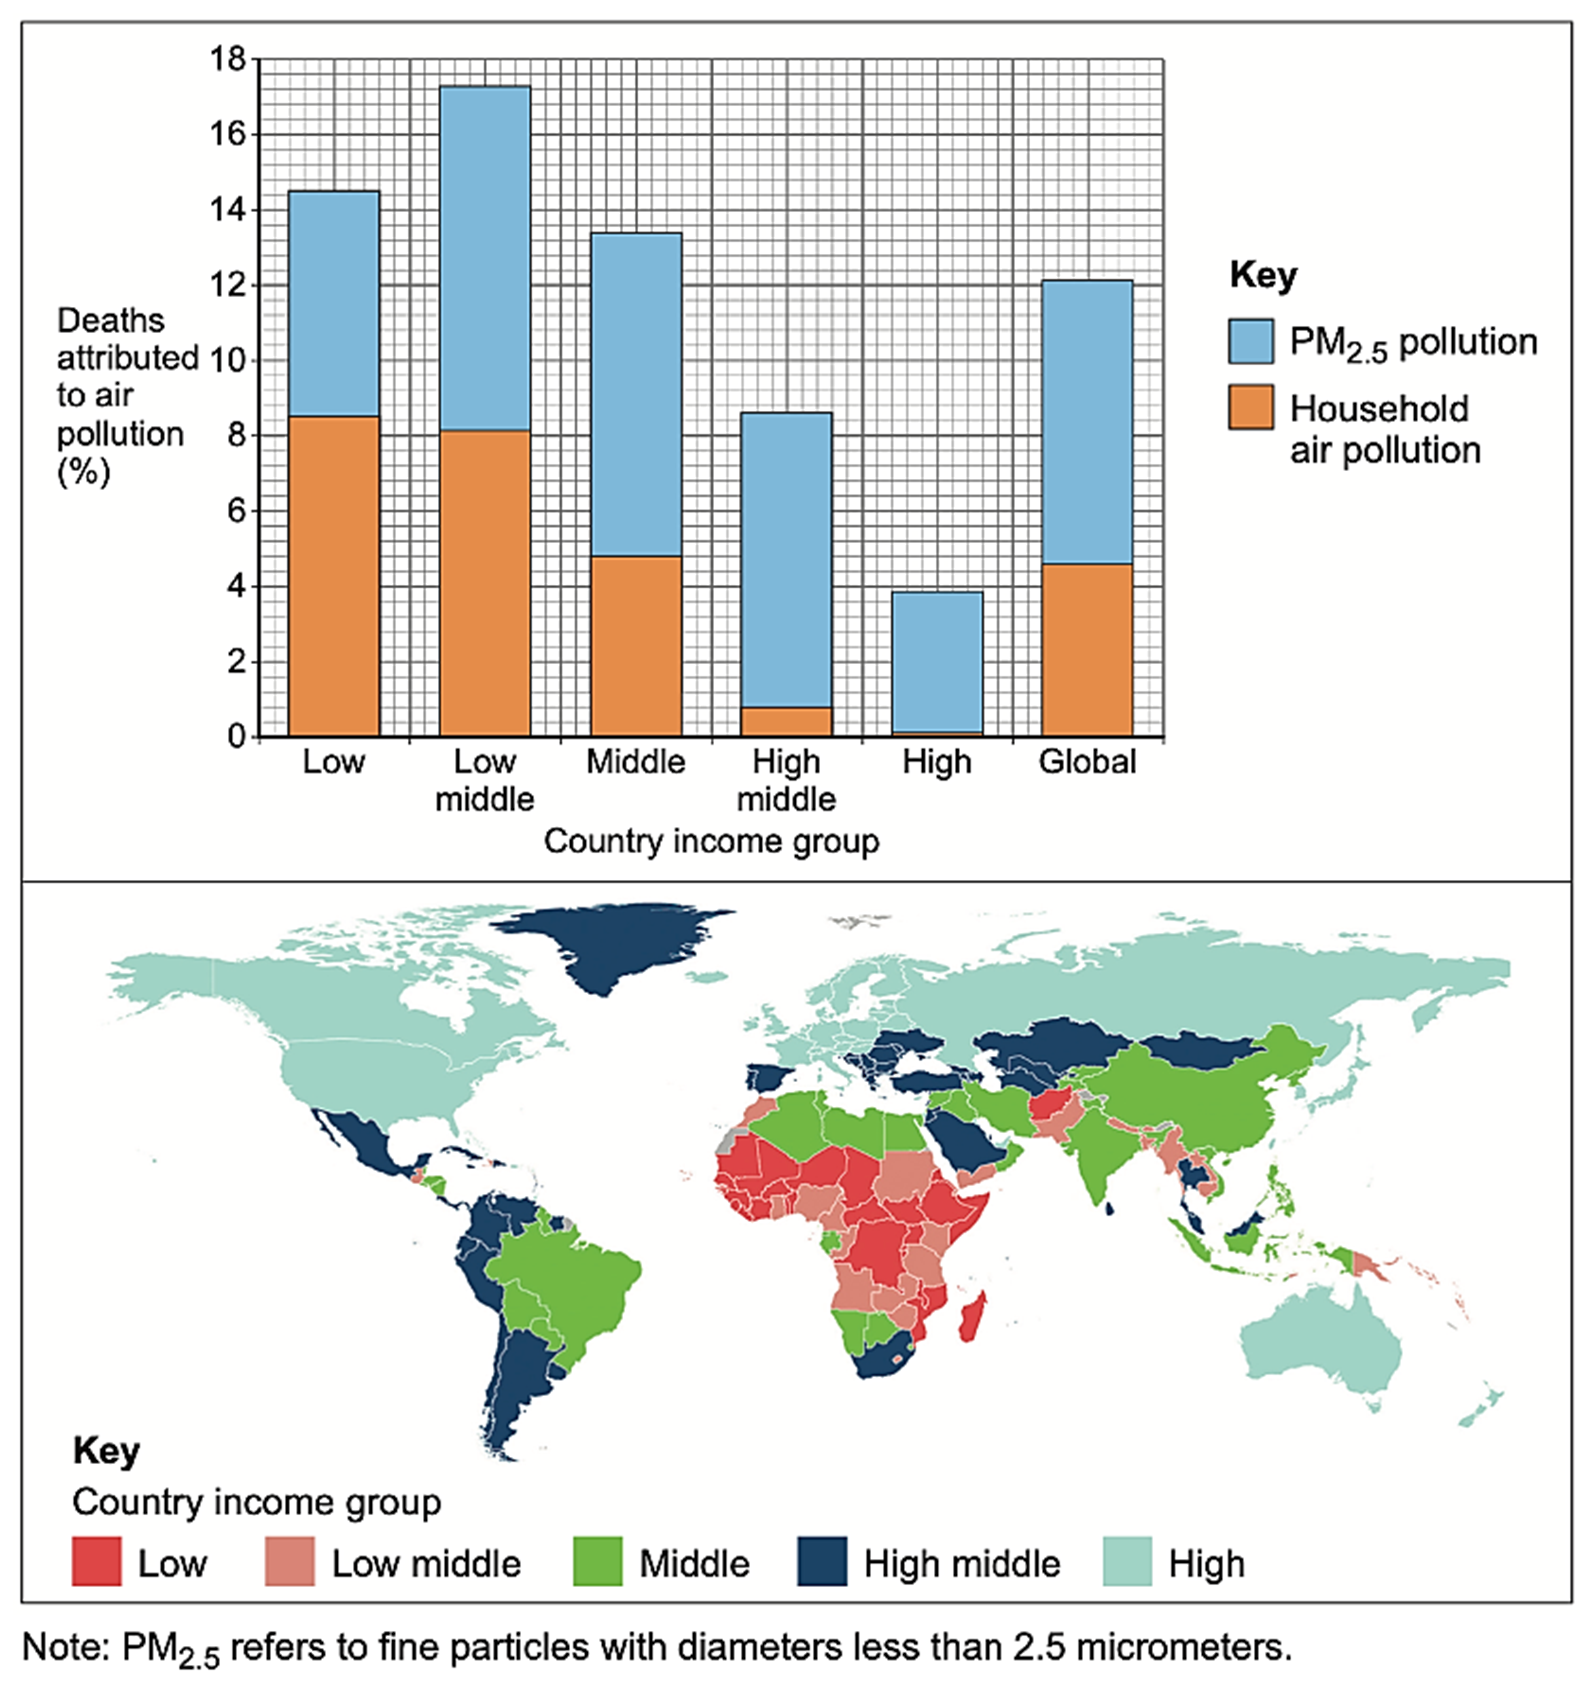
Figure 8b shows the global distribution of the concentration of PM2.5 atmospheric pollution in 2016.
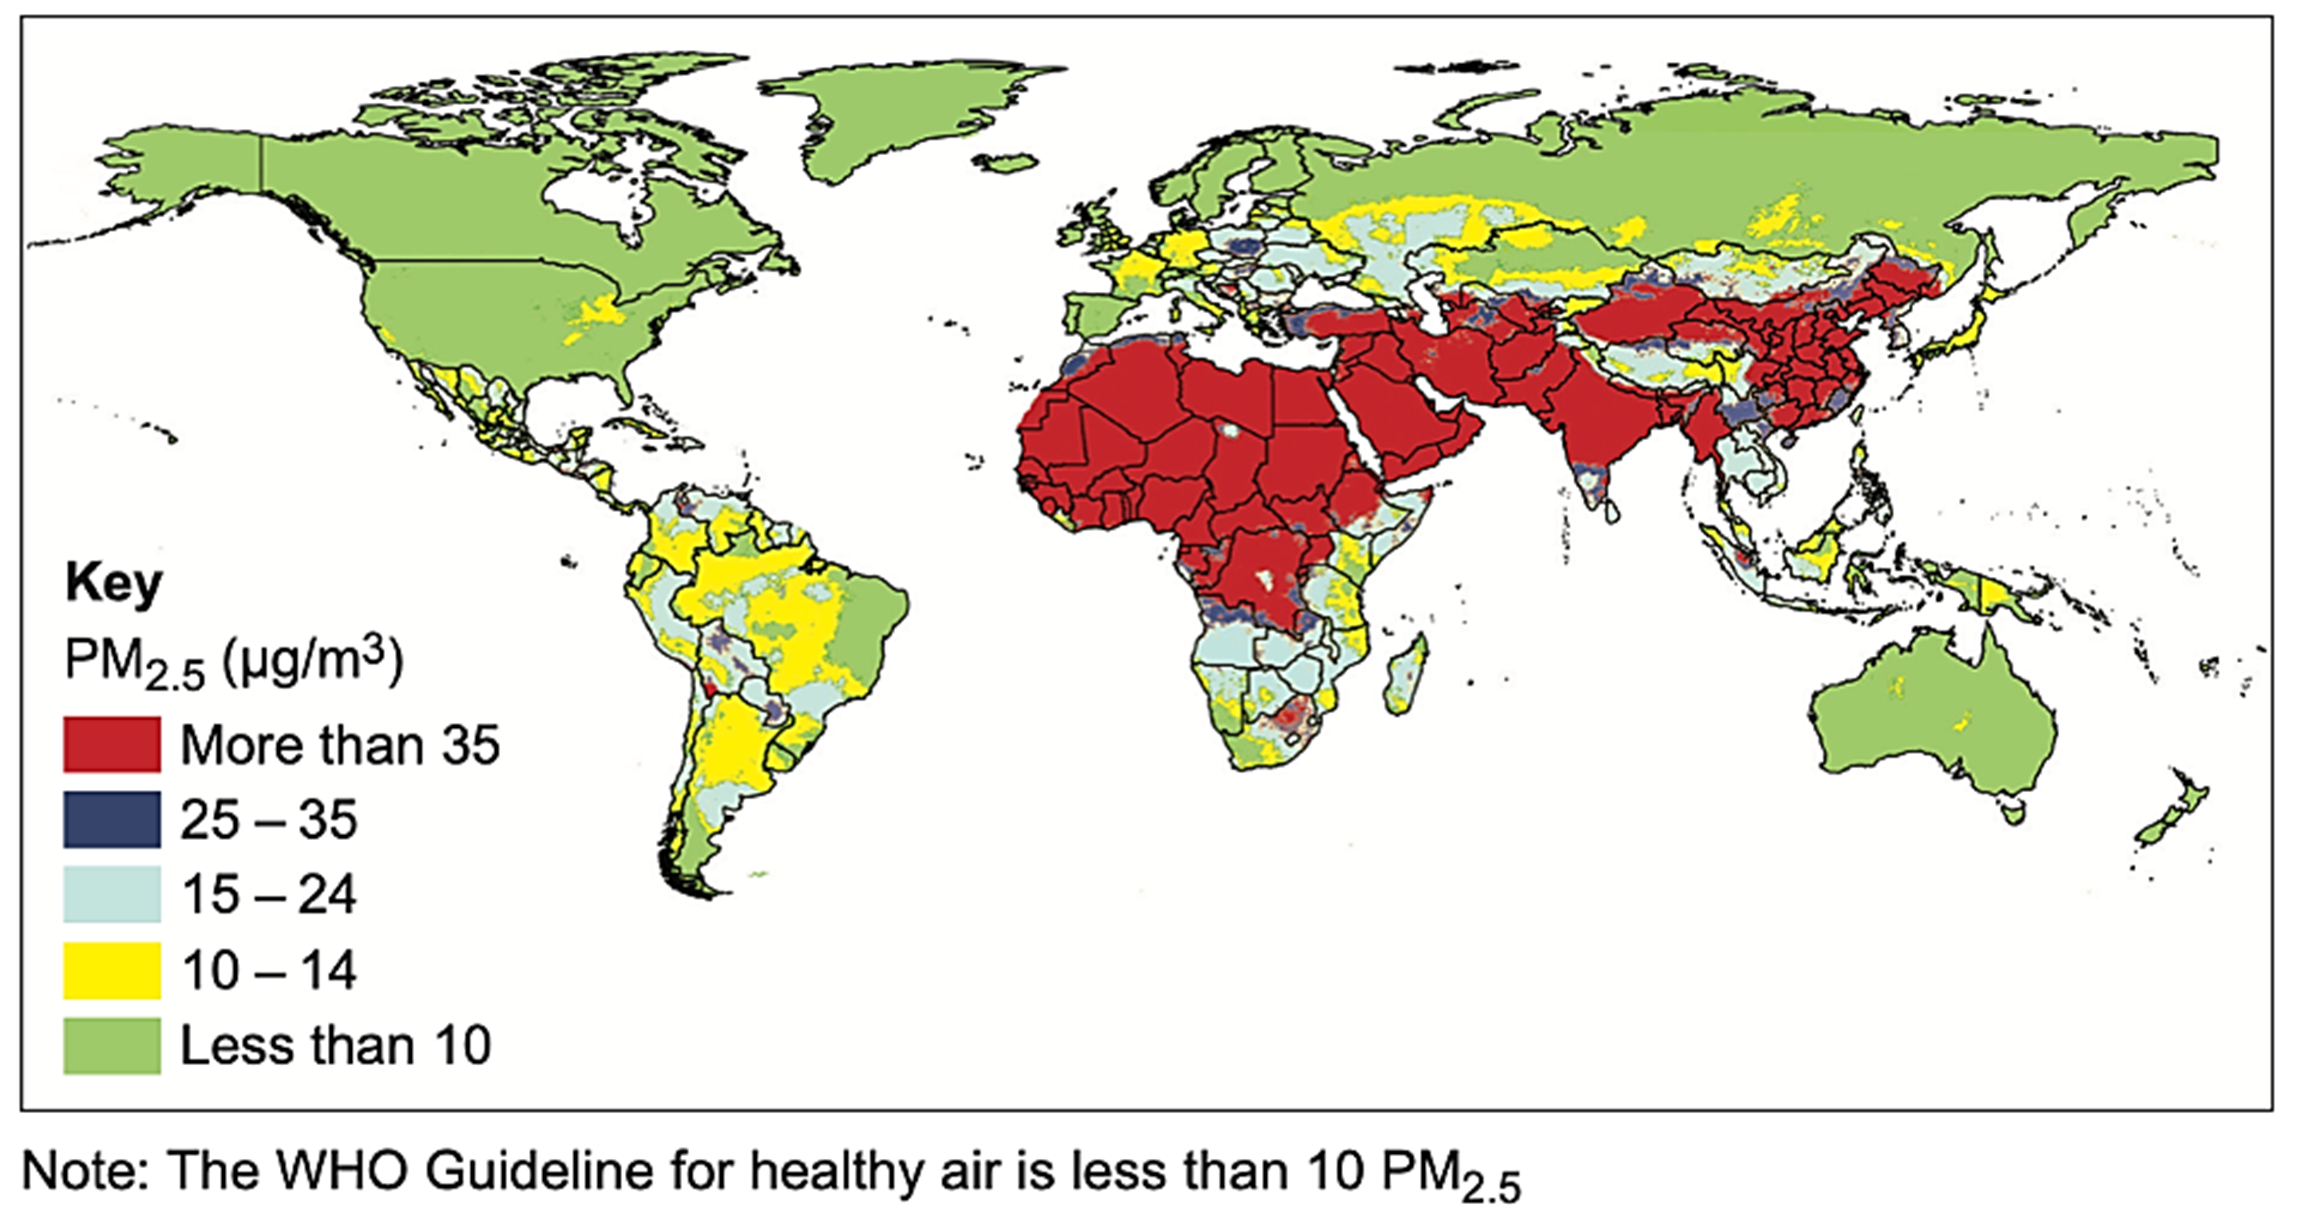
Using Figures 8a and 8b and your own knowledge, discuss the links between air quality and health at different levels of development.
Was this exam question helpful?
To what extent is epidemiological transition the most important influence on the global distribution of a non-communicable disease you have studied?
Was this exam question helpful?
‘Current strategies for controlling the spread of infectious disease are generally effective but will have to change in future as a consequence of environmental change.’ How far do you agree with this statement?
Was this exam question helpful?
‘Non-communicable diseases are harder to manage than biologically transmitted diseases.’ With reference to one or more places you have studied, assess the extent to which you agree with this statement.
Was this exam question helpful?
Assess the relative importance of the physical environment and socio-economic factors in determining the health characteristics of a local area you have studied.
Was this exam question helpful?