1
4 marks
Explain the concept of dynamic equilibrium in relation to the water cycle.
Was this exam question helpful?
Exam code: 7037
Explain the concept of dynamic equilibrium in relation to the water cycle.
Was this exam question helpful?
Outline flows within the water cycle operating on a hill slope.
Was this exam question helpful?
Explain the role of cryospheric change in the water cycle.
Was this exam question helpful?
Outline how the magnitude of water stores within the hydrological cycle can change.
Was this exam question helpful?
Outline the processes involved in generating overland flow in a drainage basin.
Was this exam question helpful?
Outline the role of vegetation in the water cycle
Was this exam question helpful?
Outline how human factors impact upon the water cycle.
Was this exam question helpful?
Outline the purpose of a flood hydrograph.
Was this exam question helpful?
Figure 1 represents data from a climate model for Africa. The map shows how rainfall totals are expected to change in Africa by 2099 compared with 1986−2005 averages. The graphs show predictions for rainfall change by month between 2080 and 2099, compared with average rainfall taken from 1986−2005.
Figure 1

Using Figure 1, analyse projected rainfall change in Africa.
Was this exam question helpful?
Using Figure 2 and your own knowledge, assess the natural and human-induced causes of the 2005 flood in Carlisle.
Figure 2 There were two separate aspects within this period of storm which affected the River Eden drainage basin around the city of Carlisle, England. Three rivers converge in the city, which has a population of approximately 72 000. There had been several weeks of above average rainfall for January. The January 2005 flood was a major event. Rainfall was very high for the period 6 to 8 January, during which two months’ worth of rainfall was released in 24 hours. Some areas within the catchment received rainfall of up to 150 mm. The upper parts of the catchment are dominated by the mountains of Skiddaw and the surrounding fells. The rocks here are hard and volcanic, soils are thin, and the gradients of many tributaries are steep. In the lower reaches rivers flow through wide, shallow valleys. The Eden channel itself has a steep gradient. The head of the catchment is around 690 m, falling rapidly to 160 m. The Eden's glaciated valley opens out and the channel gradient reflects this change: the River Eden steadily loses height at around 1.8 m per km on its journey to Carlisle. The valley floor is over 2.5 km wide in many places. This forms extensive areas of floodplain. In terms of land use, the drainage basin has a wide range of agricultural activity, both arable and pastoral farming. There are also golf courses and a small amount of managed forestry. As the River Eden reaches the coast, the area to the south is the heavily developed city of Carlisle. Much of the area is rural apart from this. 67% of the flooding resulted from rivers and watercourses. 25% of flooding was caused by surface water. 8% was due to flooding from sewerage and infrastructure In Carlisle, the River Eden peaked at an estimated 1520 cumecs at the Sheepmount Gauging Station at 2.30 pm on 8 January. This flow has a return period in the order of 175–200 years (0.5%). The previous highest recorded flow on the River Eden at Carlisle was 1075 cumecs in 1987. |
Was this exam question helpful?
Figure 1 shows annual and 5-year moving average rainfall data for two measuring stations in South Africa: Royal Observatory and Dwarsberg.
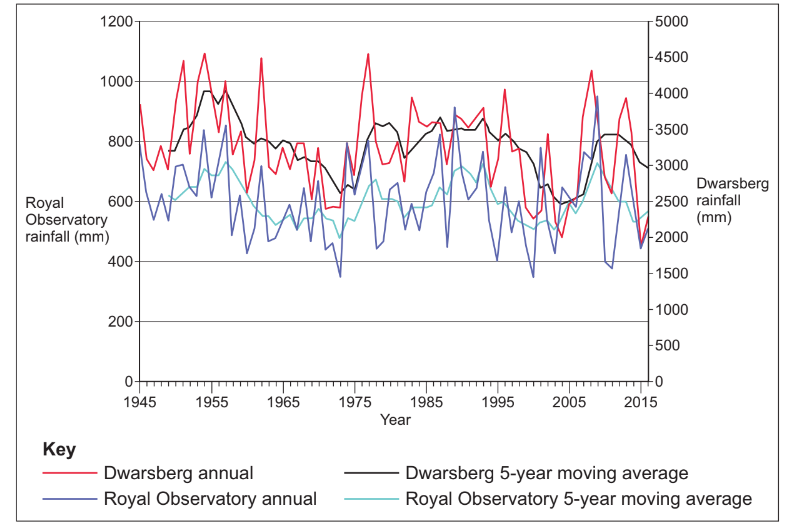
Note: The 5-year moving average plots the mean value of the previous 5 years.
Analyse the data shown in Figure 1.
Was this exam question helpful?
Figure 1 shows the number of days when precipitation is high enough for plant growth across southern Africa in 2000 and that projected for 2050.
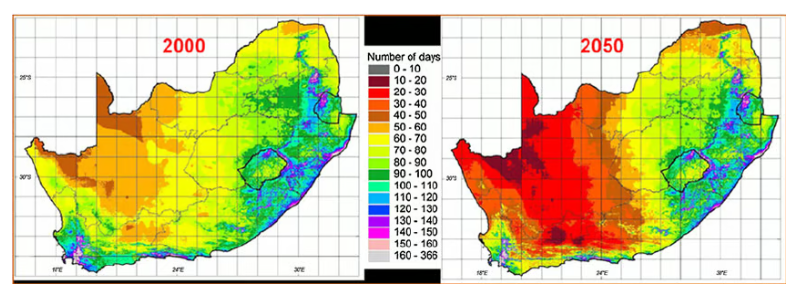
Using Figure 1 and your own knowledge, assess the predicted impact of climate change upon life in this region.
Was this exam question helpful?
Figure 2a shows two maps indicating the changing vegetation cover in the Taguibo Watershed in Agusan del Norte province, northeastern Mindanao Island, Philippines, from 1976 and 2001. The third map shows how the area could be rehabilitated with natural vegetation.
Figure 2b shows the possible impact of a storm in 2007 upon the runoff volume in the Taguibo Watershed for each of the situations shown in Figure 2a.
Figure 2a
Changing vegetation cover in the Taguibo Watershed, from 1976 to 2001 and how the area could be rehabilitated with natural vegetation

Figure 2b
Possible impact of a storm in 2007 on runoff volume in the Taguibo Watershed for each situation shown in Figure 2a

Using Figure 2a, Figure 2b and your own knowledge, assess the potential impact of changing vegetation cover upon runoff in this area.
Was this exam question helpful?
Figure X shows rainfall data, a measured hydrograph and a simulated hydrograph for Taguibo Watershed in Mindanao Island, southern Philippines. The data were collected from 13 to 17 April 2007. The simulated hydrograph is a computer-generated prediction of discharge.
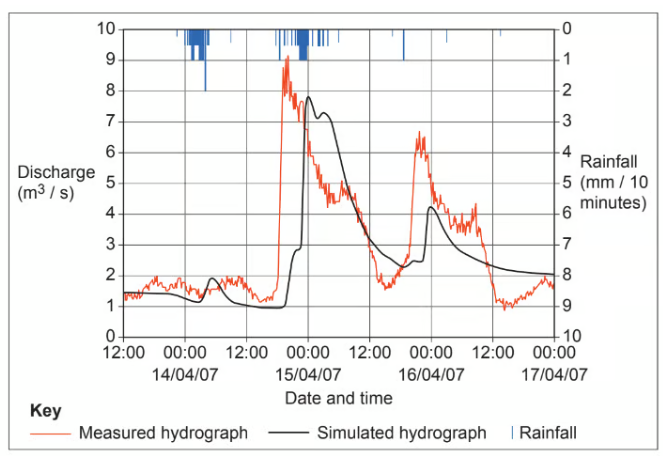
Analyse the data shown in Figure X.
[6]
Was this exam question helpful?
Analyse the data shown in Table 1 on water balance components for selected UK river catchments.
Table 1: Mean annual water balance components for selected UK river catchments (2020–2022 average)
Catchment | Annual precipitation (mm) | Potential evapotranspiration (mm) | Surface runoff (mm) | Groundwater recharge (mm) |
|---|---|---|---|---|
River Exe (SW England) | 1,650 | 520 | 890 | 240 |
River Thames (SE England) | 680 | 490 | 120 | 70 |
River Severn (Wales/W England) | 1,200 | 480 | 580 | 140 |
River Eden (NW England) | 1,980 | 440 | 1,350 | 190 |
River Lee (SE England) | 640 | 510 | 80 | 50 |
Source: Environment Agency / Centre for Ecology and Hydrology (2023)
Was this exam question helpful?
Analyse the data shown in Figure 1.
Figure 1: River discharge and hourly rainfall data for the River Eden at Carlisle during a storm event, December 2015.
Time (hours from storm onset) | Hourly rainfall (mm/hr) | River discharge (m³/s) |
|---|---|---|
0 | 5 | 280 |
3 | 12 | 295 |
6 | 25 | 380 |
9 | 35 | 590 |
12 | 40 | 860 |
15 | 38 | 1,150 |
18 | 20 | 1,480 |
21 | 8 | 1,510 |
24 | 3 | 1,390 |
30 | 0 | 1,020 |
36 | 0 | 720 |
48 | 0 | 450 |
Source: Adapted from Environment Agency discharge records, River Eden at Carlisle, December 2015.
Was this exam question helpful?
Using Figure 2 and your own knowledge, assess the factors affecting infiltration rates in a drainage basin.
Figure 2: A line graph showing infiltration rates over time for three contrasting land surface types in a temperate UK drainage basin.
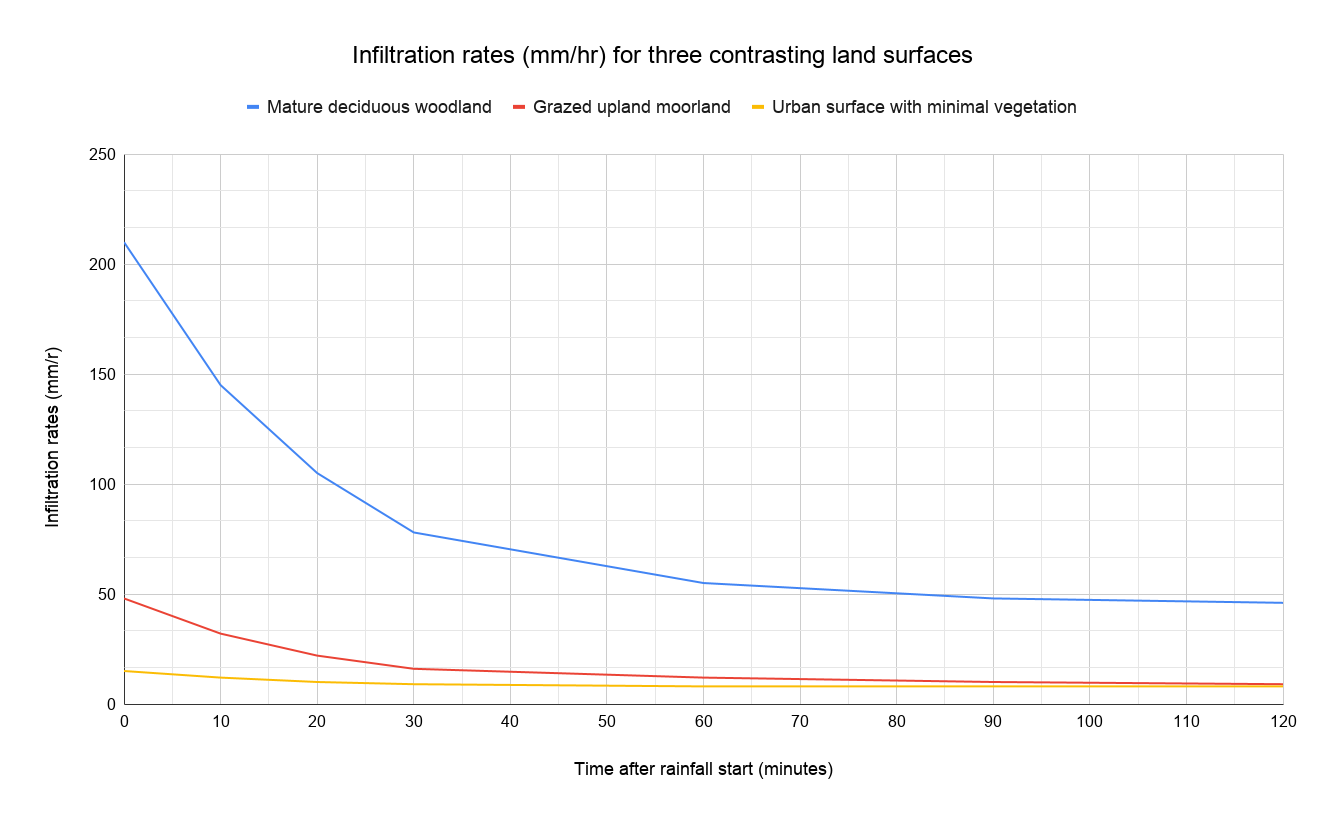
Source: Adapted from Environment Agency natural flood management research data, 2018.
Was this exam question helpful?
Figure 2 shows river flow data measured at various gauging stations across parts of the UK on 7 November 2019.
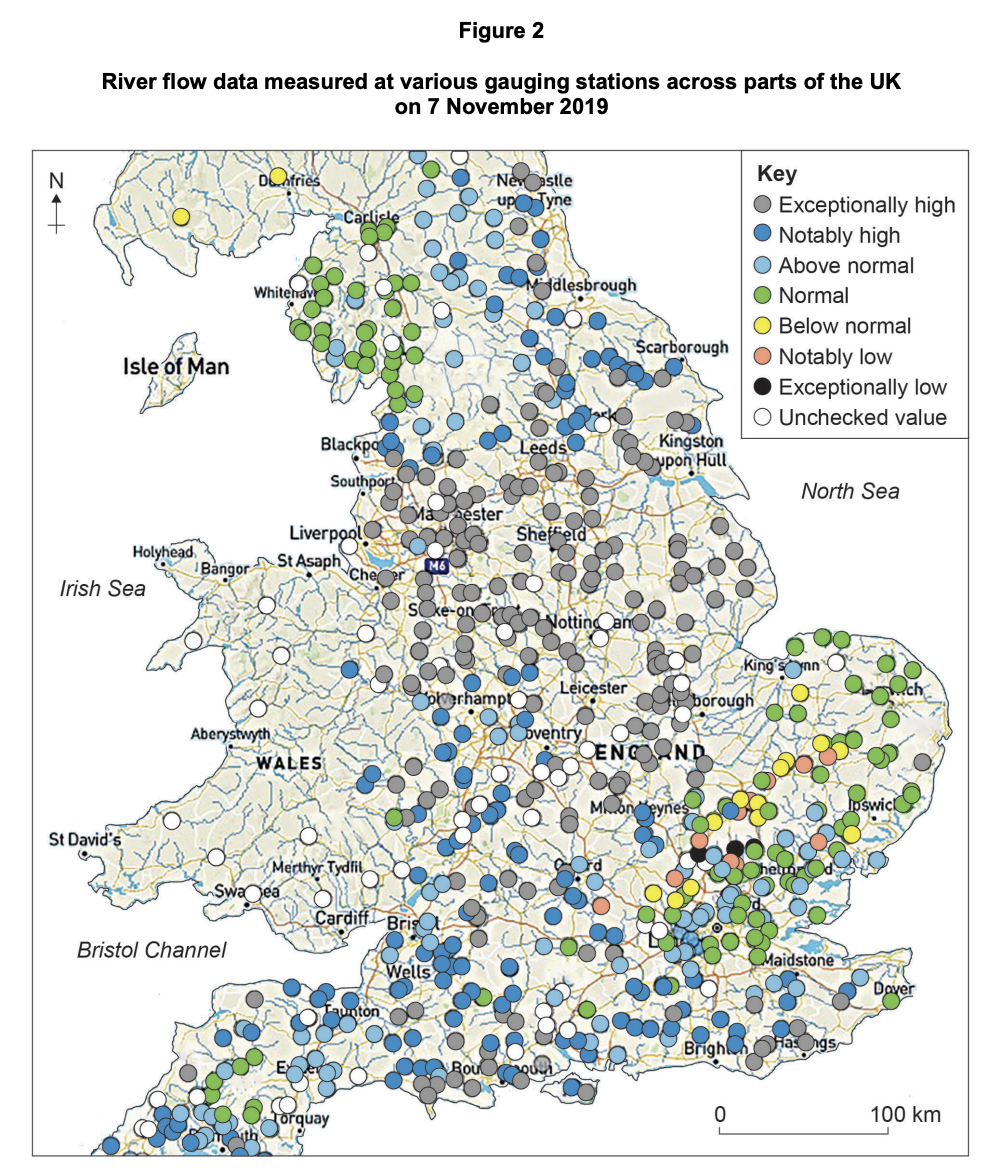
Using Figure 2 and your own knowledge, assess factors affecting the likelihood of flooding across the UK.
Was this exam question helpful?
With reference to a river catchment that you have studied, assess the potential factors that could impact the flood hydrograph.
Was this exam question helpful?
Assess the potential causes and impacts of changes to the water balance within a tropical rainforest that you have studied.
Was this exam question helpful?
Assess the extent to which human activity has changed the water cycle.
Was this exam question helpful?
Evaluate the factors that cause variations in drainage basin runoff.
Was this exam question helpful?
Evaluate the factors responsible for changes in the magnitude of water stores over time.
Was this exam question helpful?
Evaluate the extent to which human activities have disturbed the global water cycle.
Was this exam question helpful?