1
4 marks
Outline the causes of aridity in hot desert environments.
Was this exam question helpful?
Exam code: 7037
Outline the causes of aridity in hot desert environments.
Was this exam question helpful?
Outline the role of cold ocean currents as a cause of aridity.
Was this exam question helpful?
Describe the global distribution of arid and semi-arid regions.
Was this exam question helpful?
Outline the main climatic characteristics of hot desert environments.
Was this exam question helpful?
Explain the main causes of aridity in hot desert environments.
Was this exam question helpful?
Outline the water balance of a hot desert environment.
Was this exam question helpful?
Figure 3a and Figure 3b show temperature data for the Sahara Desert and the Sonoran Desert.
Figure 3a
Summer average temperatures in the Sahara Desert 1955–2010

Figure 3b
Summer average temperatures in the Sonoran Desert 1955–2010

Using Figure 3a and Figure 3b, compare the temperature variations for the Sahara Desert and the Sonoran Desert.
[6]
Was this exam question helpful?
Figure 4 shows a landscape near to Naein, central Iran.
Figure 4

Using Figure 4 and your own knowledge, assess the view that low precipitation is the most important factor leading to the development of this landscape.
[6]
Was this exam question helpful?
Study Figure 3, which shows aridity index (AI) values and precipitation data for five hot desert locations.
Location | Mean annual precipitation (mm) | Potential evapotranspiration (mm) | Aridity index (AI) |
|---|---|---|---|
Sahara, Algeria | 12 | 2,800 | 0.004 |
Namib Desert, Namibia | 28 | 3,100 | 0.009 |
Atacama Desert, Chile | 4 | 3,400 | 0.001 |
Thar Desert, India | 220 | 1,800 | 0.12 |
Sonoran Desert, USA | 250 | 1,600 | 0.16 |
Note: Aridity index (AI) = mean annual precipitation ÷ potential evapotranspiration. Aridity index values below 0.05 indicate hyper-aridity, while those between 0.05 and 0.20 indicate aridity.
Analyse the relationship between aridity index values and the distribution of hot deserts shown in Figure 3.
Was this exam question helpful?
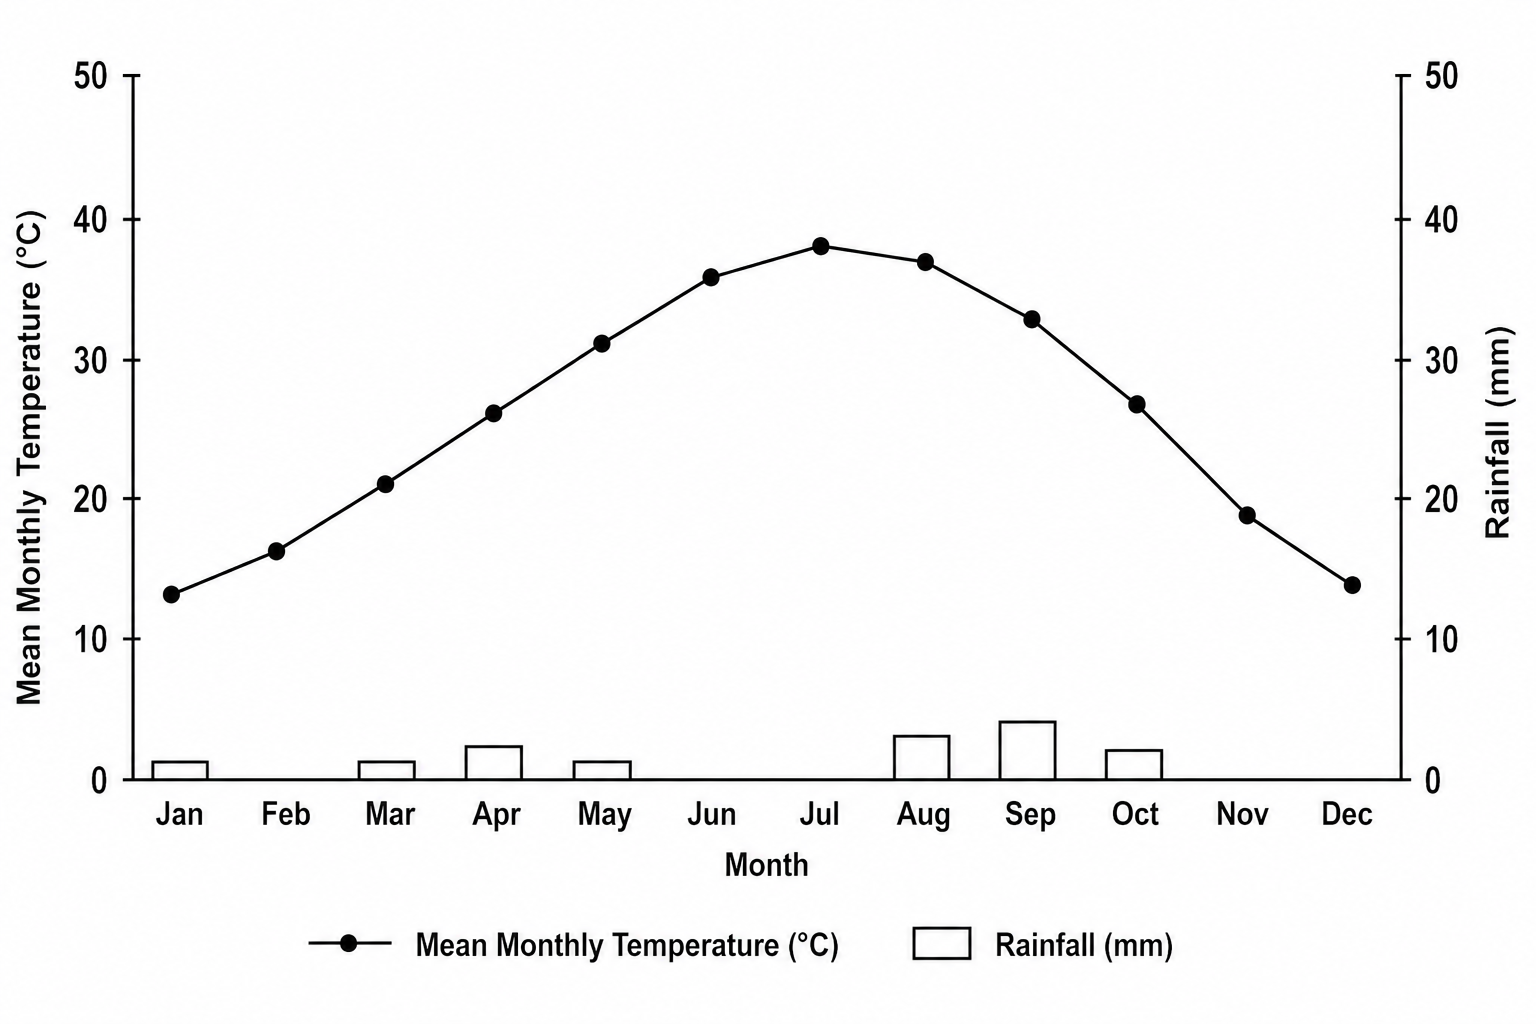
Study Figure 1, which shows monthly mean temperature and rainfall data for In Salah, Algeria (central Sahara) in 2022.
Analyse the data shown in Figure 1.
Was this exam question helpful?
Study Figure 2, which shows annual rainfall along three subtropical west coasts: the Atacama (Humboldt Current), the Namib (Benguela Current), and the Gulf of Guinea (warm-water Guinea Current).
Using Figure 2 and your own knowledge, assess the role of cold ocean currents in causing coastal aridity.
Figure 2: Annual rainfall along three subtropical west coasts
Location | Coastline | Adjacent ocean current | Mean annual rainfall (mm) |
|---|---|---|---|
Iquique, Chile | Atacama Desert (west coast S America) | Humboldt (cold) | 2 |
Walvis Bay, Namibia | Namib Desert (west coast S Africa) | Benguela (cold) | 19 |
Accra, Ghana | Gulf of Guinea coast (W Africa) | Guinea Current (warm) | 730 |
Source: Reconstructed from WMO and national meteorological agency data for comparable subtropical west-coast locations between 5-25° latitude.
Was this exam question helpful?
Figure 3a shows the average rainfall and current extent of the Sahara Desert and other vegetation types in central and north Africa. Figure 3b shows the average rainfall and vegetation types in central and north Africa around 6000-10 000 years ago.
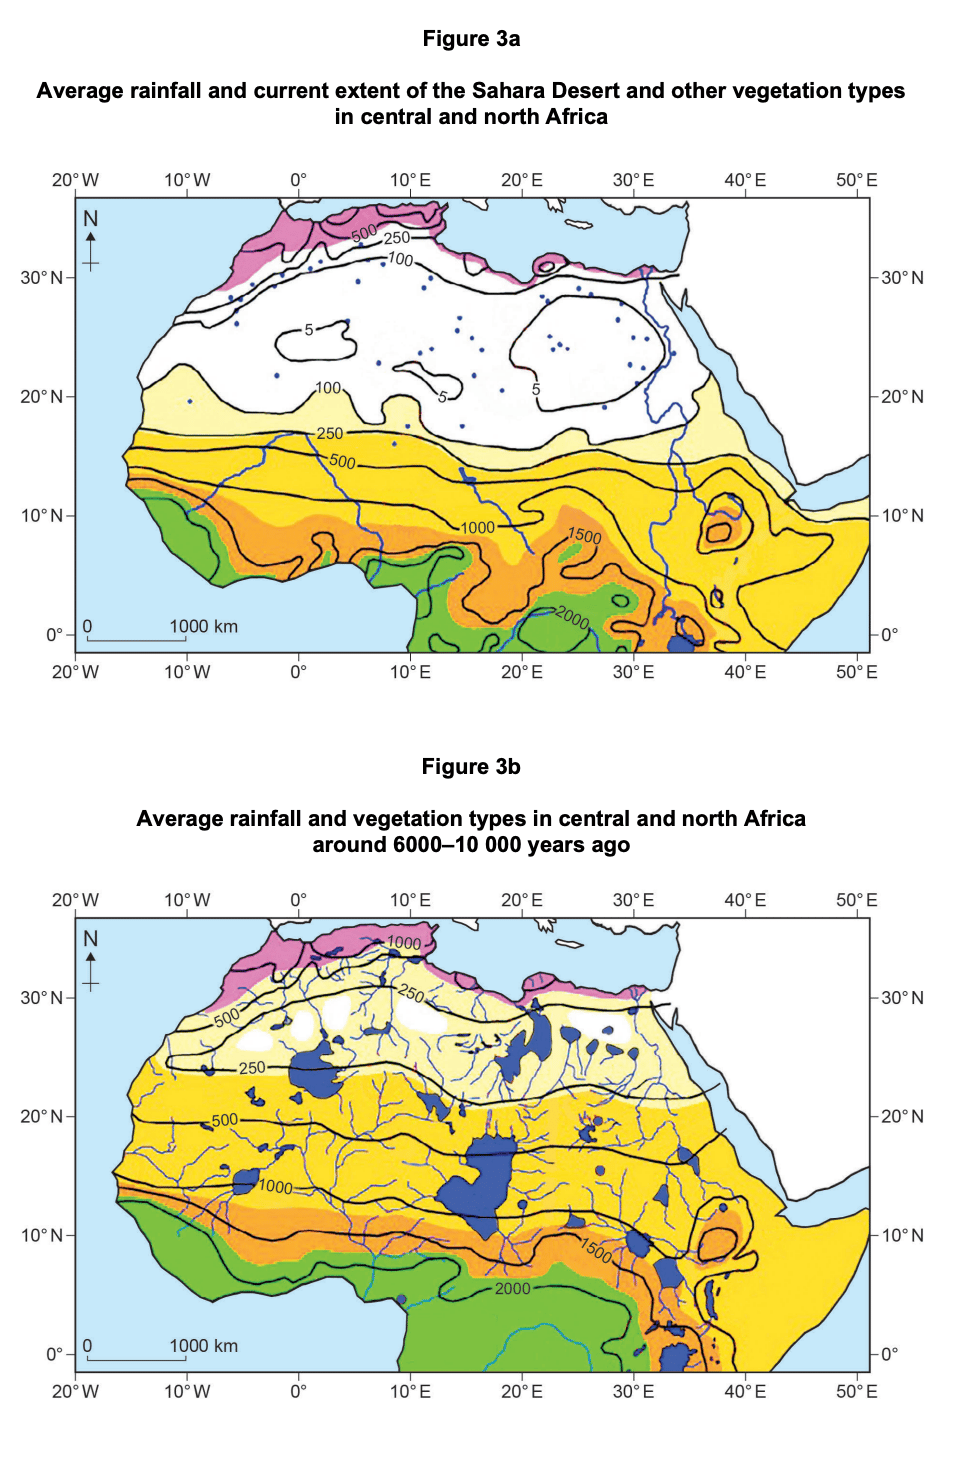
Using Figure 3a and Figure 3b, interpret the change in rainfall and vegetation patterns in central and north Africa.
Was this exam question helpful?
To what extent can an understanding of feedback systems help to reduce the problem of desertification?
Was this exam question helpful?
Assess the view that the global distribution of arid and semi-arid regions is determined primarily by atmospheric circulation.
Was this exam question helpful?
To what extent does the water balance of hot desert environments make them vulnerable to climate change?
Was this exam question helpful?
Discuss the relative importance of climatic, vegetational and soil characteristics in defining a hot desert environment.
Was this exam question helpful?
With reference to a hot desert that you have studied, evaluate the extent to which it functions as an open system.
Was this exam question helpful?