1
4 marks
Outline the global distribution of tropical storms.
Was this exam question helpful?
Exam code: 7037
Outline the global distribution of tropical storms.
Was this exam question helpful?
Outline the conditions needed for a tropical storm to form.
Was this exam question helpful?
Outline the hazards associated with tropical storms.
Was this exam question helpful?
Outline how the strength of a tropical storm is measured.
Was this exam question helpful?
Outline how tropical storms are predicted.
Was this exam question helpful?
Figure 10a shows the track of Hurricane Michael, and data related to the intensity and timescale of the event.
Figure 10b shows the track of Hurricane Michael between 9–12 October and the rainfall associated with the event.
Figure 10c shows the aftermath of the event at Mexico Beach in Florida, USA.
Figure 10a – the track of Hurricane Michael, and data related to the intensity and timescale of the event

Figure 10b – the track of Hurricane Michael between 9–12 October and the rainfall associated with the event

Figure 10c – the aftermath of the event at Mexico Beach in Florida, USA

Using Figures 10a, 10b, 10c and your own knowledge, assess the potential issues associated with managing this event.
Was this exam question helpful?
To what extent do you agree that the impact of volcanic activity can be mitigated against more effectively than tropical storms?
Was this exam question helpful?
With reference to one or more tropical storms that you have studied, assess the extent to which exogenous factors (relationships with other places) assisted with the response to the hazard created.
Was this exam question helpful?
Analyse the data in Figure 1, which shows trends in global tropical storm activity from 1990 to 2020.
Figure 1: Global tropical storm activity, 1990–2020
Decade | Total tropical storms (Categories 1–5) | Category 4–5 storms | Peak wind speed recorded (km/h) | Average sea surface temperature (°C) |
|---|---|---|---|---|
1990–1999 | 82 | 18 | 250 | 27.2 |
2000–2009 | 91 | 24 | 295 | 27.8 |
2010–2019 | 98 | 31 | 315 | 28.3 |
2020 | 12 | 5 | 330 | 28.7 |
Source: World Meteorological Organization (WMO), 2021
Was this exam question helpful?
To what extent do you agree that changes to the carbon cycle are responsible for increasingly frequent and severe tropical storms?
Was this exam question helpful?
Figure 9 shows data related to the changing frequency of tropical storms between 1980 and 2018.
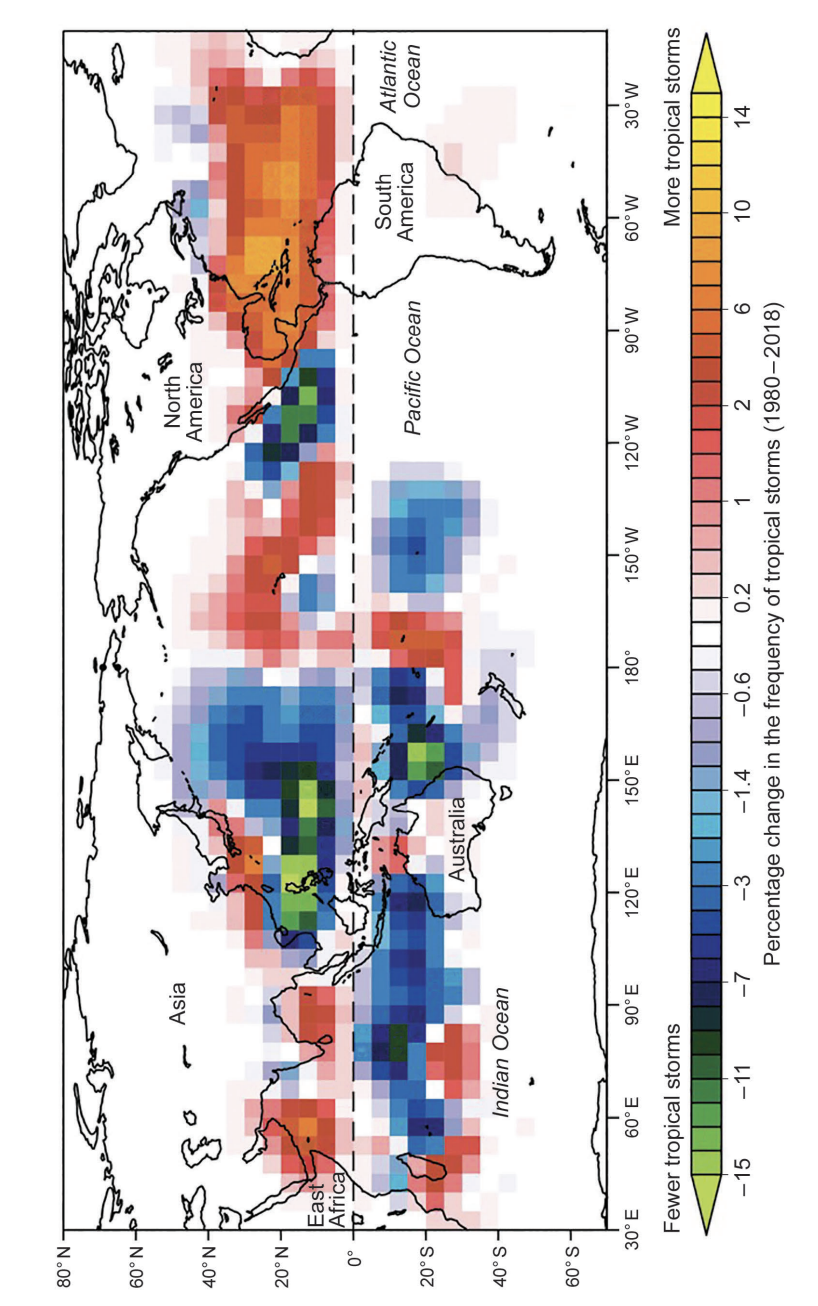
Interpret the data shown in Figure 9.
Was this exam question helpful?
'The impacts of tropical storms are determined more by human factors than by physical factors.'
To what extent do you agree?
Was this exam question helpful?
Assess the importance of prediction and preparation in reducing the impacts of tropical storms.
Was this exam question helpful?
'Climate change will be the most important factor affecting tropical storm hazards in the future.'
To what extent do you agree?
Was this exam question helpful?