Working with Data (AQA A Level Maths: Statistics): Exam Questions

Exam code: 7357

2 hours20 questions
1
1 mark

A student plots the scatter diagram below showing the mass in kilograms against the CO2 emissions in grams per kilogram for a sample of cars in the Large Data Set.
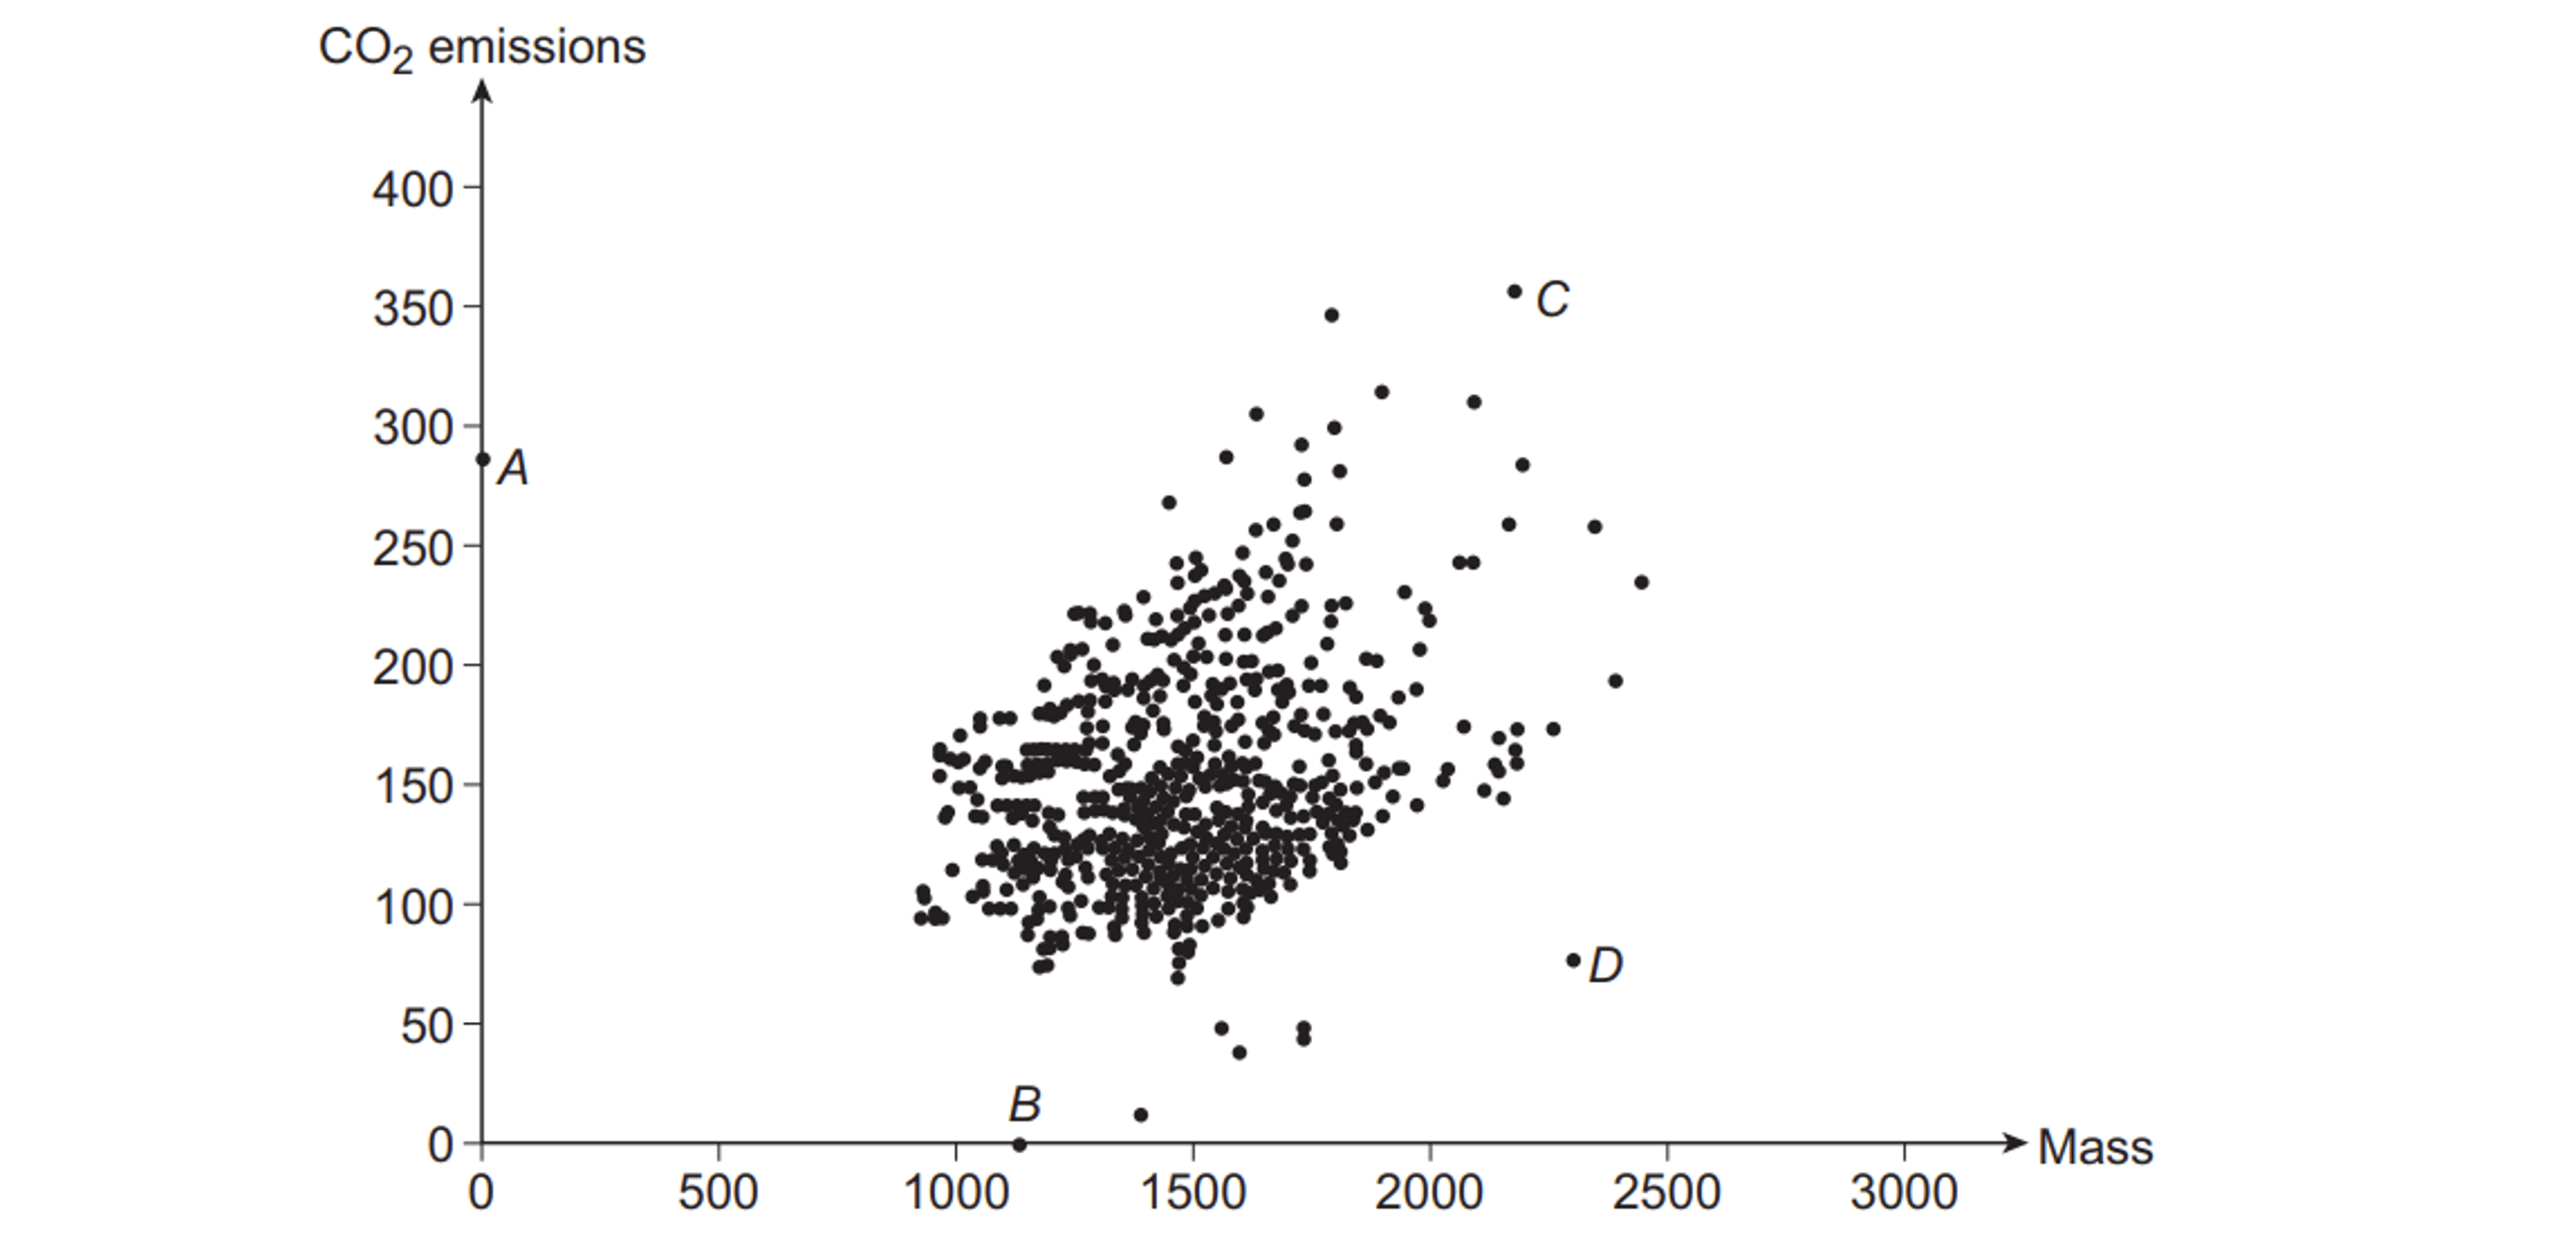
Scatter graph of car mass versus CO₂ emissions, showing a positive trend with clustered points and four labelled outliers A, B, C and D.

Their teacher tells them to remove an error to clean the data.

Identify the data point which should be removed.

2a
3 marks

In a conkers competition the number of strikes required to smash an opponent's conker (and thus win a match) is recorded for 15 matches. The results are:

6, 2, 9, 10, 9, 12, 5, 8, 7, 5, 11, 9, 17, 8, 9

(i) Find the median number of strikes.

(ii) Find the interquartile range.

2b
2 marks

An outlier is defined as any data value that falls either more than 1.5×IQR above the upper quartile or less than 1.5×IQR below the lower quartile.

Determine, giving a reason, whether there are any outliers.

3a
Sme Calculator
1 mark

Joe counts the number of different species of bird visiting his garden each day for a week. The results are given below.

7, 8, 5, 12, 9, 7, 3

Calculate the mean number of different species of bird visiting Joe's garden.

3b
Sme Calculator
2 marks

Joe continues to record the number of different species of bird visiting his garden each day for the rest of the month and calculates the mean number of different species is 9.25 for the remaining 24 days.

Joe claims that, using the data from the whole month, the mean number of species seen per day is exactly 9.

State, with clear working, whether Joe is correct.

3c
2 marks

Joe notices that one of the recorded values is 8.8.

Explain why this is an error and state what Joe must do with this data value.

4a
3 marks

The cumulative frequency diagram below shows the length of 100 phone calls, in minutes, made to a computer help centre for one morning.

Cumulative frequency diagram of morning call times, cumulative frequency from 0 to 100 against call time from 0 to 25 minutes

(i) Use the cumulative frequency graph to estimate the 10th and 90th percentiles.

(ii) Find the 10th to 90th interpercentile range.

4b
2 marks

In the afternoon, on the same day, the length of another 100 phone calls to the computer help centre were recorded. The median length of these calls was 15 minutes and the 10th to 90th interpercentile range was 18 minutes.

Compare the distributions of the call times in the morning and the afternoon.

5a
Sme Calculator
3 marks

Two geologists are measuring the size of rocks found on a beach in front of a cliff.

The geologists record the greatest length, in millimetres, of each rock they find at distances of 5 m and 25 m from the base of the cliff. They randomly choose 20 rocks at each distance.

The mean and standard deviation for the rocks at 25 m from the base of the cliff are x¯=111 mm and σ=120 mm (both to 3 s.f.).

For the rocks at 5 m from the base of the cliff, the summary statistics are

n=20,  Σx=3885,  Sxx=369513.75

Find the mean and standard deviation for the size of rocks at 5 m from the base of the cliff.

5b
2 marks

Compare the size of the rocks at 5 m and 25 m from the base of the cliff.

5c
Sme Calculator
2 marks

An outlier is defined as any data value that lies outside one standard deviation of the mean, that is outside x¯±σ.

Calculate the lower outlier boundary for the rocks at 25 m from the base of the cliff.

Hence, explain why there cannot be any outliers at 25 m which are smaller than the mean.

1
Sme Calculator
4 marks

A random sample of eight cars was selected from the Large Data Set.

The masses of these cars, in kilograms, were as follows.

950, 989, 1247, 1415, 1506, 1680, 1833, 2040

It is given that, for the population of cars in the Large Data Set, the lower quartile is 1167 kg, the median is 1393 kg and the upper quartile is 1570 kg.

(i) It was decided to remove any of the masses which fall outside the following interval.

median1.5×IQRmassmedian+1.5×IQR

Show that only one of the eight masses in the sample should be removed.

(ii) Write down the statistical name for the mass that should be removed in part (i).

2a
Sme Calculator
4 marks

The table below is an extract from the Large Data Set.

Propulsion Type

Region

Engine Size

Mass

CO2

Particulate Emissions

2

London

1896

1533

154

0.04

2

North West

1896

1423

146

0.029

2

North West

1896

1353

138

0.025

2

South West

1998

1547

159

0.026

2

London

1896

1388

138

0.025

2

South West

1896

1214

130

0.011

2

South West

1896

1480

146

0.029

2

South West

1896

1413

146

0.024

2

South West

2496

1695

192

0.034

2

South West

1422

1251

122

0.025

2

South West

1995

2075

175

0.034

2

London

1896

1285

140

0.036

2

North West

1896

0

146

(i) Calculate the mean and standard deviation of CO2 emissions in the table.

(ii) Any value more than 2 standard deviations from the mean can be identified as an outlier. Determine, using this definition of an outlier, if there are any outliers in this sample of CO2 emissions. Fully justify your answer.

2b
2 marks

Maria claims that the last line in the table must contain two errors.

Use your knowledge of the Large Data Set to comment on Maria's claim.

3a
2 marks

A hotel manager recorded the number of towels that went missing at the end of each day for 12 days. The results are below.

2, 4, 1, 0, 3, 4, 3.2, 9, 3, 2, 4, 5

Explain how the data will need to be cleaned before the manager can calculate summary statistics.

3b
Sme Calculator
3 marks

The manager cleans the data as required. For the remaining 11 days,

n=11,  Σx=37,  Σx2=181

Calculate the mean and the standard deviation for the number of towels missing per day.

3c
Sme Calculator
2 marks

An outlier is defined as any data value lying more than 2 standard deviations away from the mean.

Determine, giving a reason, whether there are any outliers in the cleaned data.

3d
1 mark

State, giving a reason, whether the manager should remove this outlier from the data set.

4a
4 marks

The cumulative frequency diagram below shows completion times for 100 competitors at the 2019 Rubik’s cube championships.  The quickest completion time was 9.8 seconds and the slowest time was 52.4 seconds.

Cumulative frequency graph of task completion time (seconds), S-shaped curve rising from 0 to about 100, steepest between 25 and 35 seconds.

The grid below shows a box plot of the 2020 championship data.  Draw a box plot on the grid to represent the 2019 championship data.

Box-and-whisker plot for 2020 completion times: minimum ~5s, lower quartile 20s, median 22s, upper quartile 30s, maximum 37s, on a 0–60s scale.
4b
3 marks

(i) Compare the distributions of the completion times for the 2019 and 2020 championships.

(ii) Given that the 2020 championships happened after the global pandemic, during which many competitors spent months at home, interpret your findings from part (b)(i).

5a
Sme Calculator
3 marks

Students at two karate schools, Miyagi Dojo and Cobra Kicks, measured the force, in newtons, with which they could perform a particular style of hit.

The mean and standard deviation for the students at Cobra Kicks are x¯=1740 N and σ=251 N (both to 4 significant figures).

For the students at Miyagi Dojo, the summary statistics are

n=12,  Σx=21873,  Σx2=41532545

Calculate the mean and standard deviation for the force with which the students at Miyagi Dojo can hit.

5b
2 marks

Compare the distributions of hitting force for the two karate schools.

6a
5 marks

The heights, in metres, of a flock of 20 flamingos are recorded and shown below:

0.4

0.9

1.0

1.0

1.2

1.2

1.2

1.2

1.2

1.2

1.3

1.3

1.3

1.4

1.4

1.4

1.4

1.5

1.5

1.6

An outlier is an observation that falls either more than 1.5×IQR above the upper quartile or less than 1.5×IQR below the lower quartile.

(i) Find the median.

(ii) Find the interquartile range.

(iii) Determine, giving a reason, whether there are any outliers in the data.

6b
3 marks

Using your answers to part (a), draw a box plot for the data.

Blank rectangular grid with small grey squares above a horizontal axis arrow pointing right, ready for plotting data or drawing a graph.
7a
Sme Calculator
3 marks

The number of packages processed daily at a sorting office over a 14-day period are given below:

237, 264, 308, 313, 319, 352, 378

378, 405, 421, 428, 450, 465, 583

Given that Σx=5301 and Σx2=2113195, calculate the mean and standard deviation for the number of daily packages processed.

7b
Sme Calculator
2 marks

An outlier is defined as any data value lying more than 2 standard deviations away from the mean.

Determine, giving a reason, whether there are any outliers in the data.

7c
Sme Calculator
3 marks

By removing the outlier identified in part (b), clean the data and recalculate the mean and standard deviation.

8a
3 marks

The cumulative frequency diagram below shows the distribution of income of 120 managers across a supermarket chain.

Cumulative frequency diagram of manager incomes from 0 to 220 thousand pounds, cumulative frequency from 0 to 120

The income of a sample of 120 other employees across the supermarket chain are recorded in the table below.

Income I (£1000)

Frequency

0I<20

34

20I<40

28

40I<60

27

60I<80

17

80I<100

10

100I<120

4

On the grid above, draw a cumulative frequency graph to show the data for the other employees.

8b
2 marks

Compare the income of the managers and the other employees.

1a
Sme Calculator
4 marks

Ms Chew is an accountant who is examining the length of time it takes her to complete jobs for her clients.  Ms Chew looks at her spreadsheet and lists the number of hours it took her to complete her last 12 jobs:

9

2

-

6

5

2

-

6

21

5

4

8

‘-’ represents a job for which the length of time taken was not recorded.

An outlier is an observation which lies more than  ±2  standard deviations away from the mean.

By first cleaning the data, show that 21 is the only outlier.

1b
3 marks

Ms Chew looks at her handwritten records and finds that the value 21 was typed into the spreadsheet incorrectly.  It should have been 12.

Without further calculations, explain the effect this would have on the:

(i) mean

(ii) standard deviation

(iii) median.

2a
Sme Calculator
4 marks

As part of an experiment, 15 maths teachers are asked to solve a puzzle and their times, in minutes, are recorded:

8

12

19

20

20

21

22

23

23

23

25

26

27

37

39

An outlier is an observation which lies more than ±2 standard deviations away from the mean.

Show that there is exactly one outlier.

2b
2 marks

State, with a reason, whether the mean or the median would be the most suitable measure of central tendency for these data.

2c
2 marks

15 history teachers also completed the riddle; their times are shown below in the box plot:

Box-and-whisker plot of time in minutes, with an outlier near 8, whiskers from about 12 to 50, and a box from about 30 to 42 showing the median

Explain what the cross (×) represents on the box plot above. Interpret this in context.

2d
2 marks

Compare the distributions of the times taken to complete the puzzle by the two sets of teachers.

3a
3 marks

Hugo, a newly appointed HR administrator for a company, has been asked to investigate the number of absences within the IT department.  The department contains 23 employees, and the box plot below summarises the data for the number of days that individual employees were absent during the previous quarter.

Box-and-whisker plot of number of absences in days, from 0 to 30, showing quartiles and spread of data along a horizontal axis.

An outlier is an observation that falls either more than 1.5 (interquartile range) above the upper quartile or less than 1.5 (interquartile range) below the lower quartile.

Show that these data have an outlier, and state its value.

3b
Sme Calculator
4 marks

For the 23 employees within the department, Hugo has the summary statistics:

 Σx=286 and  Σx2=4328x2

Hugo investigates the employee corresponding to the outlier value found in part (a) and discovers that this employee had a long-term illness.  Hugo decides not to include that value in the data for the department.

Assuming that there are no other outliers, calculate the mean and standard deviation of the number of days absent for the remaining employees.

4a
Sme Calculator
4 marks

Sam, a zoologist, is a member of a group researching the masses of gentoo penguins.  The research group takes a sample of 100 male and 100 female penguins and records their masses.

An outlier is an observation that falls either more than 1.5 ×(interquartile range) above the upper quartile or less than 1.5 ×  (interquartile range) below the lower quartile.

Given that values are outliers if they are less than 4.2kg or more than 8.5kg, calculate the upper and lower quartiles for the mass of the 200 gentoo penguins.

4b
2 marks

Casey is another member of Sam's research group. She believes that the masses of male and female gentoo penguins follow different distributions. The cumulative frequency graphs below show the masses of the male and female gentoo penguins in the sample.

Cumulative frequency graphs showing mass distributions for male and female gentoo penguins, mass from 4 to 10 kg, cumulative frequency from 0 to 100

Use the graphs to compare the distributions of the masses of male and female gentoo penguins.

1a
Sme Calculator
2 marks

Marya is consistently late for work. David, Marya’s boss, records the number of minutes that she is late during the next six days. David calculates the mean is 18 minutes and the variance is 210 minutes². On one of the six days, Marya was 50 minutes late.

Show that 50 is an outlier, using the definition that outliers are more than 2 standard deviations away from the mean.

1b
2 marks

(i) Give a reason why the value of 50 should be excluded from the data set.

(ii) Give a reason why the value of 50 should be included in the data set.

1c
Sme Calculator
5 marks

Marya tells David that she was 50 minutes late that day because her car broke down on the way to work, and she shows him the breakdown receipt as evidence.

David agrees to remove the 50 from the data set. Calculate the new mean and standard deviation for the remaining values.

2a
3 marks

The cumulative frequency graph below shows the information about the lengths of time taken for 80 students to run a lap of the sports hall.

Cumulative frequency graph of times in seconds, rising from 0 at 20s to about 80 at 100s, showing an S-shaped increasing curve over a grid.

Complete the table below:

Time (t seconds)

20<t40

40<t60

60<t80

80<t100

Frequency

8


2b
Sme Calculator
3 marks

Hence estimate the mean and the standard deviation of the times.

2c
Sme Calculator
3 marks

Given that the fastest time was 21 seconds and the slowest time was 100 seconds, show that these values are outliers using the definition that an outlier is more than 2 standard deviations away from the mean.

3a
Sme Calculator
3 marks

Tim has just moved to a new town and is trying to choose a doctor’s surgery to join, HealthHut or FitFirst. He wants to register with the one where patients get seen faster.
He takes of sample of 150 patients from HealthHut and calculates the range of waiting times as 45 minutes and the variance as 121 minutes².

An outlier is defined as a value which is more than 2 standard deviations away from the mean.

Prove that the sample contains an outlier.

3b
2 marks

Tim finds out that the outlier is a valid piece of data and decides to keep the value in his sample.

Which pair of statistical measures would be more appropriate to use when using the sample to compare the doctor’s surgeries: the mean and standard deviation or the median and interquartile range? Give a reason for your answer.

3c
Sme Calculator
1 mark

The box plots below show the waiting times for the two surgeries.

Box plots comparing HealthHut and FitFirst waiting times in minutes, with FitFirst showing a longer upper whisker and an outlier around 45 minutes

Given that there is only one outlier for HealthHut, label it on the box plot with a cross (×).

3d
2 marks

Compare the two distributions of waiting times.