Cells in Animals & Plants (AQA GCSE Combined Science: Synergy: Life & Environmental Sciences): Exam Questions

Exam code: 8465

2 hours17 questions
1a
2 marks

Students investigated the effect of different concentrations of salt solution on the mass of pieces of potato.

This is the method used.

  1. Cut three pieces of potato, each with a mass of 2.00 g.

  2. Place the pieces of potato into a salt solution with a concentration of 0.2 mol/dm³.

  3. After 30 minutes, measure the mass of each piece of potato.

  4. Calculate the change in mass.

  5. Repeat steps 1 to 4 for five other concentrations of salt solution.

Table 3 shows the results.

Table 3

Concentration of salt solution in mol/dm³

Change in mass in g

Mean change in mass in g

0.2

0.31

0.34

0.25

0.30

0.4

-0.07

-0.08

-0.13

-0.09

0.6

-0.18

-0.13

-0.11

-0.14

0.8

-0.24

-0.19

-0.17

-0.20

1.0

-0.22

-0.30

-0.32

-0.28

1.2

-0.26

-0.35

-0.32

X

Give two control variables the students should have used in the investigation.

Do not refer to mass or time in your answer.

1b
Sme Calculator
3 marks

Calculate value X in Table 3.

1c
6 marks

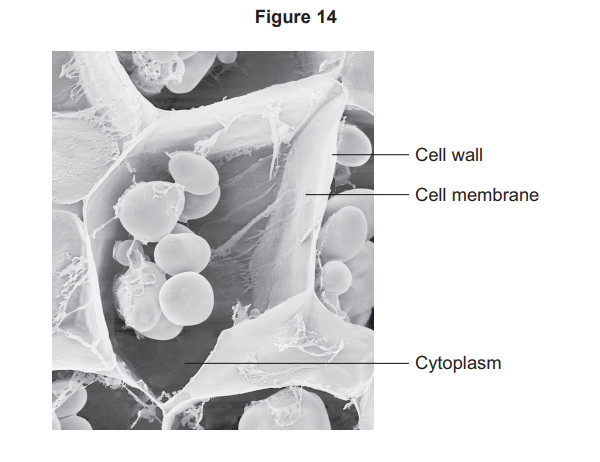
Figure 14 shows a potato cell.

Electron micrograph of plant cells, with labels indicating the thick cell wall, thin cell membrane just inside, and granular cytoplasm filling each cell

Explain why the mass of the pieces of potato increased in the 0.2 mol/dm³ salt solution.

You should refer to the cell parts labelled in Figure 14.

1d
1 mark

The image in Figure 14 was made using an electron microscope and not a light microscope.

Give one piece of evidence to support this.

1e
Sme Calculator
3 marks

The potato cell in Figure 14 contains starch grains.

A starch grain on a different image had a diameter of 1.2 cm.

The starch grain had a real diameter of 0.008 mm.

Calculate the magnification of the image.

2
1 mark

Bone cells divide to repair damage.

Give one other reason why bone cells divide.

3a
2 marks

Students investigated the effect of different concentrations of salt solution on the mass of pieces of potato.

This is the method used.

  1. Cut three pieces of potato, each with a mass of 2.00 g.

  2. Place the pieces of potato into a salt solution with a concentration of 0.2 mol/dm3.

  3. After 30 minutes, measure the mass of each piece of potato.

  4. Calculate the change in mass.

  5. Repeat steps 1 to 4 for five other concentrations of salt solution.

Table 1 shows the results.

Table 1

Concentration of salt solution in mol/dm3

Change in mass g

Mean change in mass (g)

0.2

0.31

0.34

0.25

0.30

0.4

−0.07

−0.08

−0.13

−0.09

0.6

−0.18

−0.13

−0.11

−0.14

0.8

−0.24

−0.19

−0.17

−0.20

1.0

−0.22

−0.30

−0.32

−0.28

1.2

−0.26

−0.35

−0.32

X

Give two control variables the students should have used in the investigation.

Do not refer to mass or time in your answer.

3b
Sme Calculator
3 marks

Calculate value X in Table 1.

3c
6 marks

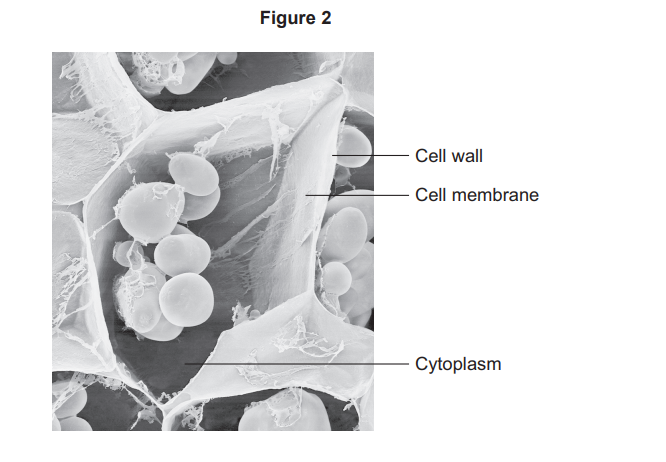
Figure 2 shows a potato cell.

Electron micrograph of plant cells showing thick cell walls, thin cell membranes and granular cytoplasm, with labels indicating each structure.

Explain why the mass of the pieces of potato increased in the 0.2 mol/dm3 salt solution.

You should refer to the cell parts labelled in Figure 2.

3d
1 mark

The image in Figure 2 was made using an electron microscope and not a light microscope.

Give one piece of evidence to support this.

3e
Sme Calculator
3 marks

The potato cell in Figure 2 contains starch grains.

A starch grain on a different image had a diameter of 1.2 cm.

The starch grain had a real diameter of 0.008 mm.

Calculate the magnification of the image.

3f
1 mark

Starch is digested in the gut.

Why is digestion of starch needed?

Select your answer.

  • Starch is a carbohydrate.

  • Starch molecules are insoluble.

  • Starch molecules are small.

3g
2 marks

Describe the process of starch digestion.

4
2 marks

Explain one advantage to the starfish of reproducing by cloning rather than reproducing by sexual reproduction.

5a
2 marks

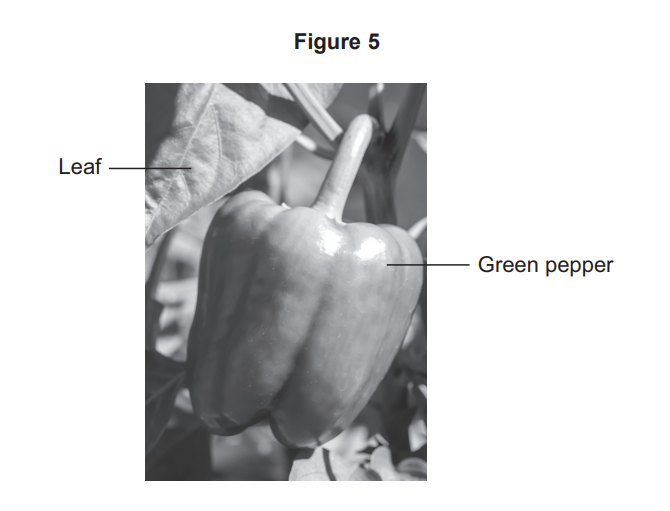
Figure 5 shows a green pepper growing on a pepper plant (a leaf and a green pepper are labelled).

Diagram of a green pepper growing on a plant, with labelled arrows pointing to a leaf and to the green pepper fruit.

Water is lost from the leaves.

Complete the sentences.

Choose answers from the box.

guard cells

starch

stomata

xylem

  1. Water is lost through tiny holes in the leaves called _______________.

  2. The size of each hole is controlled by_____________________ .

5b
3 marks

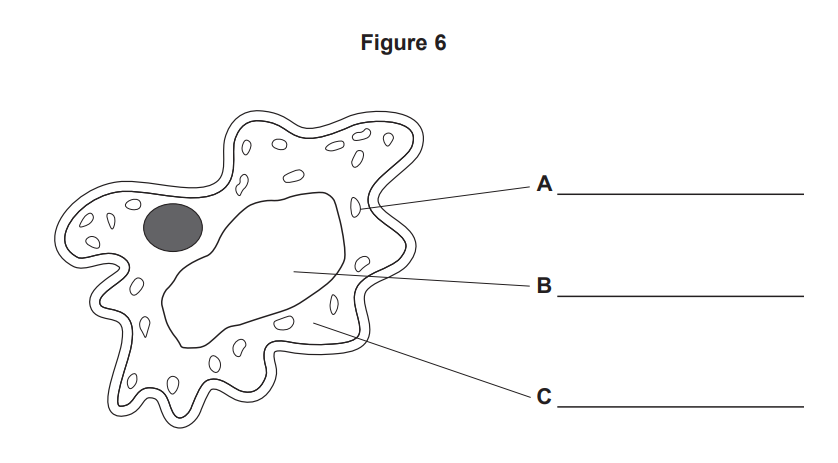
Figure 6 shows a drawing of a cell from a pepper.

Diagram of an amoeba cell with irregular outline, labelled lines A, B and C pointing to the outer membrane, cytoplasm and large central vacuole

Cell part A contains a green pigment.

Label parts A, B and C on Figure 6.

Choose answers from the box.

cell membrane

chloroplast

cytoplasm

nucleus

vacuole

5c
Sme Calculator
2 marks

An image of one cell from a pepper has a width of 32 mm.

The real cell has a width of 0.08 mm.

Calculate the magnification of the image of the cell.

Use the equation:

magnification=size of imagesize of real cell

Magnification = × ____________________

5d
2 marks

Water can move into cells and out of cells.

A student investigated how different concentrations of sugar solution affect the mass of pepper tissue.

Method:

  1. Cut three pieces of pepper 1 cm wide and 1 cm long.

  2. Dry each piece.

  3. Record the mass of each piece.

  4. Leave each piece in sugar solution for 1 hour.

  5. Remove the pieces from the sugar solution and dry each piece.

  6. Record the mass of each piece.

  7. Repeat steps 1 to 6 using different concentrations of sugar solution.

Before the investigation, the pepper was wrapped in plastic and kept at 5 °C.

Which are two reasons for keeping the pepper wrapped in plastic at 5 °C?

Tick (✓) two boxes.

  • To change the colour of the pepper

  • To decrease the size of the pepper

  • To increase growth of the pepper

  • To reduce water loss from the pepper

  • To slow down decay of the pepper

5e
1 mark

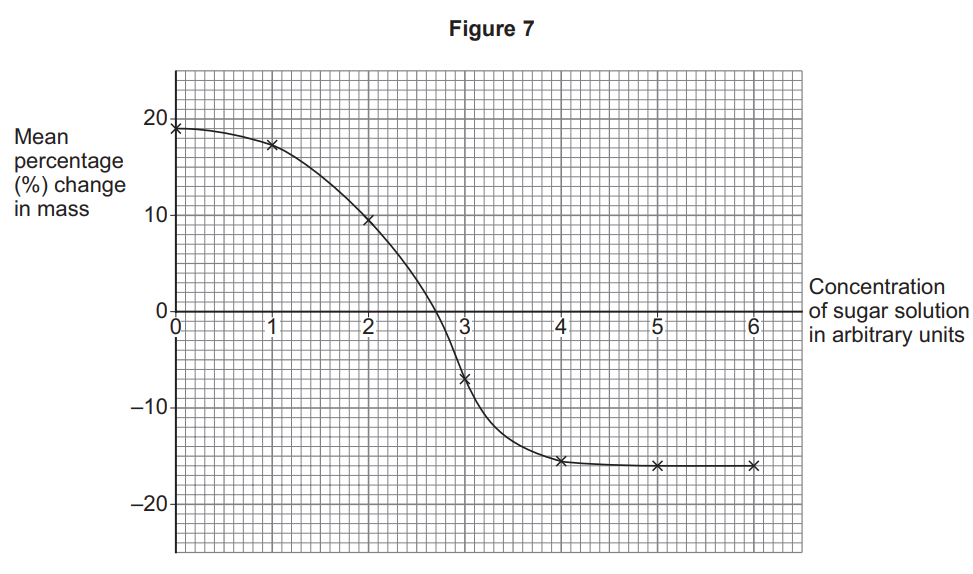
The student calculated the mean percentage change in mass at each concentration of sugar solution.

Figure 7 shows the results

Line graph (Figure 7) showing mean percentage change in mass decreasing from +20% to about −18% as sugar solution concentration increases from 0 to 6 units

In some concentrations of sugar solution, the mass of the pieces of pepper increased.

The mass increased because water moved into the cells.

What process moved water into the cells?

5f
1 mark

What concentration of sugar solution would cause a mean percentage change in mass of 0%?

Use Figure 7.

Concentration of sugar solution = __________arbitrary units

5g
1 mark

The cells of the pepper have wrinkled cell walls.

What is the advantage of wrinkled cell walls to the pepper plant?

Tick (✓) one box.

  • The cells can expand

  • The cells contain less cellulose

  • The surface area is smaller

6
1 mark

Why is an electron microscope and not a light microscope used to view the soot particle?

7
1 mark

Oak trees reproduce by sexual reproduction to produce seeds.

An acorn is a nut that contains a seed.

The seed may become a new oak tree.

Which process produces the cell that grows into the seed?

  • Evolution

  • Fertilisation

  • Translocation

8a
3 marks

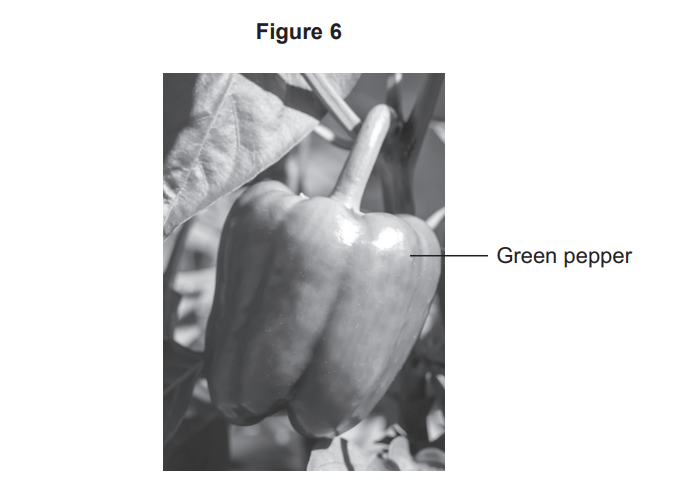
Figure 6 shows a green pepper growing on a pepper plant .

Black-and-white photo of a green pepper growing on the plant, with a label and arrow pointing to the pepper as the subject of Figure 6

The cells of the green pepper contain water.

Water cannot enter the cells through the waxy waterproof coating on the outside of the pepper fruit.

Describe how water reaches the green pepper cells.

8b
Sme Calculator
5 marks

A pepper cell was viewed using a microscope.

The image of a pepper cell had a width of 32 mm.

The magnification of the image was ×400.

Calculate the real width of the cell in micrometres.

Real width = ____________ micrometres

8c
1 mark

A student investigated how different concentrations of sugar solution affect the mass of pepper tissue.

Method used:

  1. Cut three pieces of pepper 1 cm wide and 1 cm long.

  2. Dry each piece.

  3. Record the mass of each piece.

  4. Leave each piece in sugar solution for 1 hour.

  5. Remove the pieces from the sugar solution and dry each piece.

  6. Record the mass of each piece.

  7. Repeat steps 1 to 6 using different concentrations of sugar solution.

  8. Calculate the mean percentage change in mass at each concentration of sugar solution.

Before the investigation, the pepper was kept at 5 °C.

Suggest why.

8d
1 mark

Describe why calculating the percentage change in mass is more valid than only calculating the change in mass.

8e
1 mark

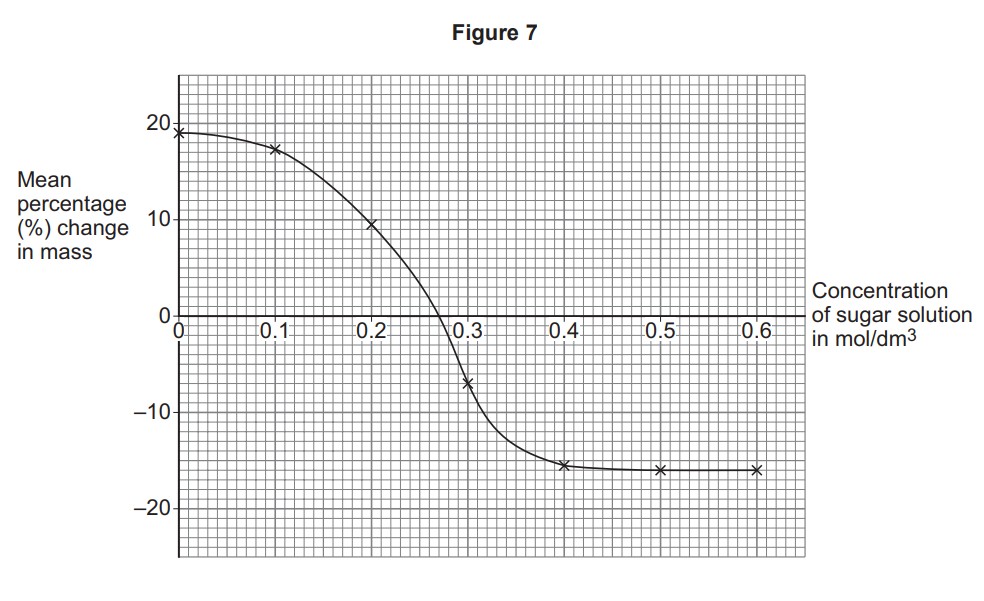
Figure 7 shows the results

Graph of mean percentage change in mass versus sugar solution concentration, showing mass gain at low concentration and loss increasing above about 0.25 mol/dm³

Determine the concentration of the solution inside the pepper cells before the investigation.

Concentration = ______________mol/dm³

8f
2 marks

Explain the mean percentage change in mass of pepper when the concentration of sugar solution was 0.5 mol/dm³.

8g
2 marks

As peppers develop, the vacuoles of the cells increase in volume.

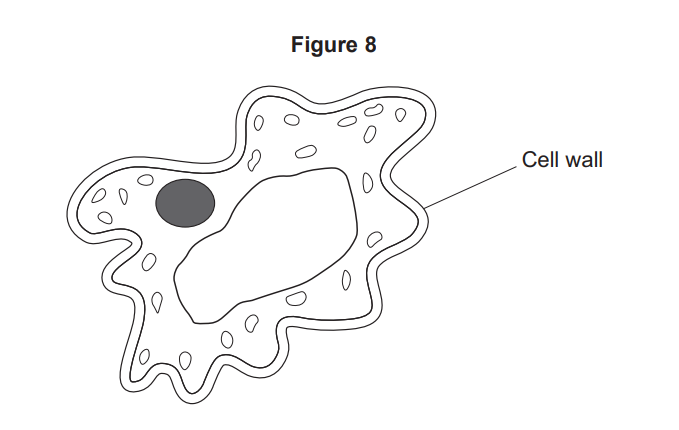
Figure 8 shows the shape of a pepper cell before it is fully developed

Diagram of an irregularly shaped cell showing a labelled cell wall, central cytoplasm, nucleus and several small oval organelles inside.

Suggest two reasons why the cell walls of pepper cells are wrinkled.

9a
1 mark

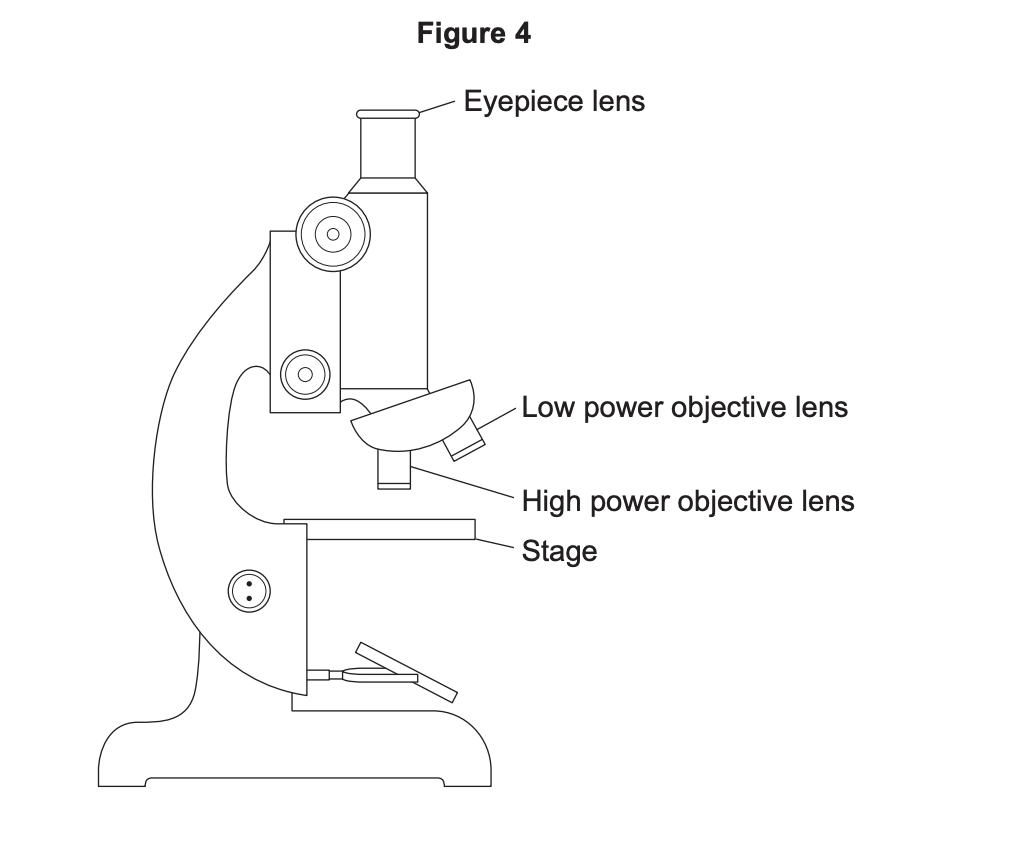
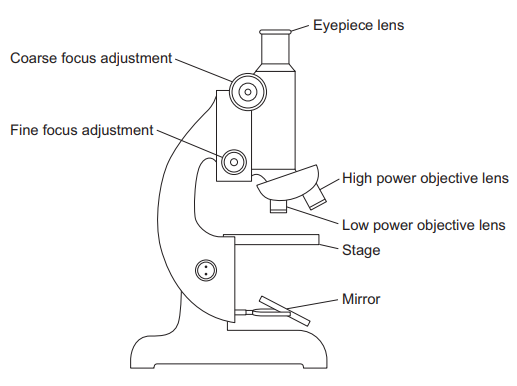
Figure 4 shows a light microscope.

Diagram of a light microscope in side view, with labels for eyepiece lens, low and high power objective lenses, and the flat stage.

The eyepiece lens has a magnification of ×10

The high power objective lens has a magnification of ×40

Which calculation shows the total magnification?

Tick (✓) one box.

  • 10×40

  • 4010

  • 10+40

9b
1 mark

Write down the equation which links magnification, size of image and size of real object.

9c
Sme Calculator
4 marks

A student used a different microscope to view a cell.

The cell was viewed with a magnification of ×250

The size of the image of the cell was 1.5 cm.

Calculate the real size of the cell.

Give your answer in mm.

Real size of cell = _______mm

9d
1 mark

The student focused the image for the low power objective lens and then changed to the high power objective lens.

The high power objective lens should not be moved towards the stage to focus the image.

Give one reason why.

9e
1 mark

Viruses are approximately 100 times smaller than animal cells.

What type of microscope is used to view viruses?

9f
Sme Calculator
2 marks

Chilli plants can be infected with tobacco mosaic virus (TMV).

Farmers grow chilli plants and sell chilli fruits.

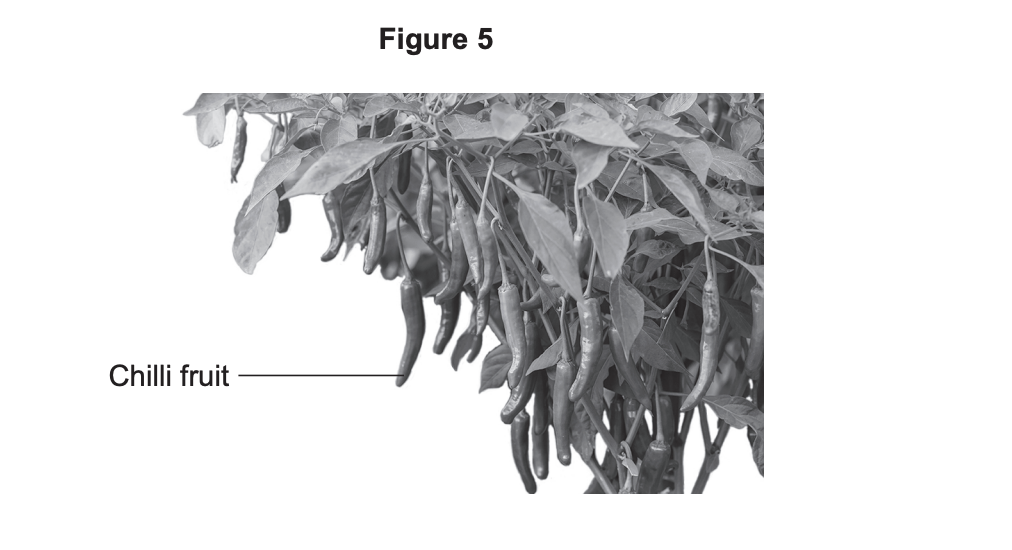
Figure 5 shows chilli fruits growing on a chilli plant.

Figure 5

Black-and-white diagram labelled “Figure 5” showing a chilli plant with many long, thin chilli fruits hanging beneath dense leaves, one tagged “Chilli fruit”.

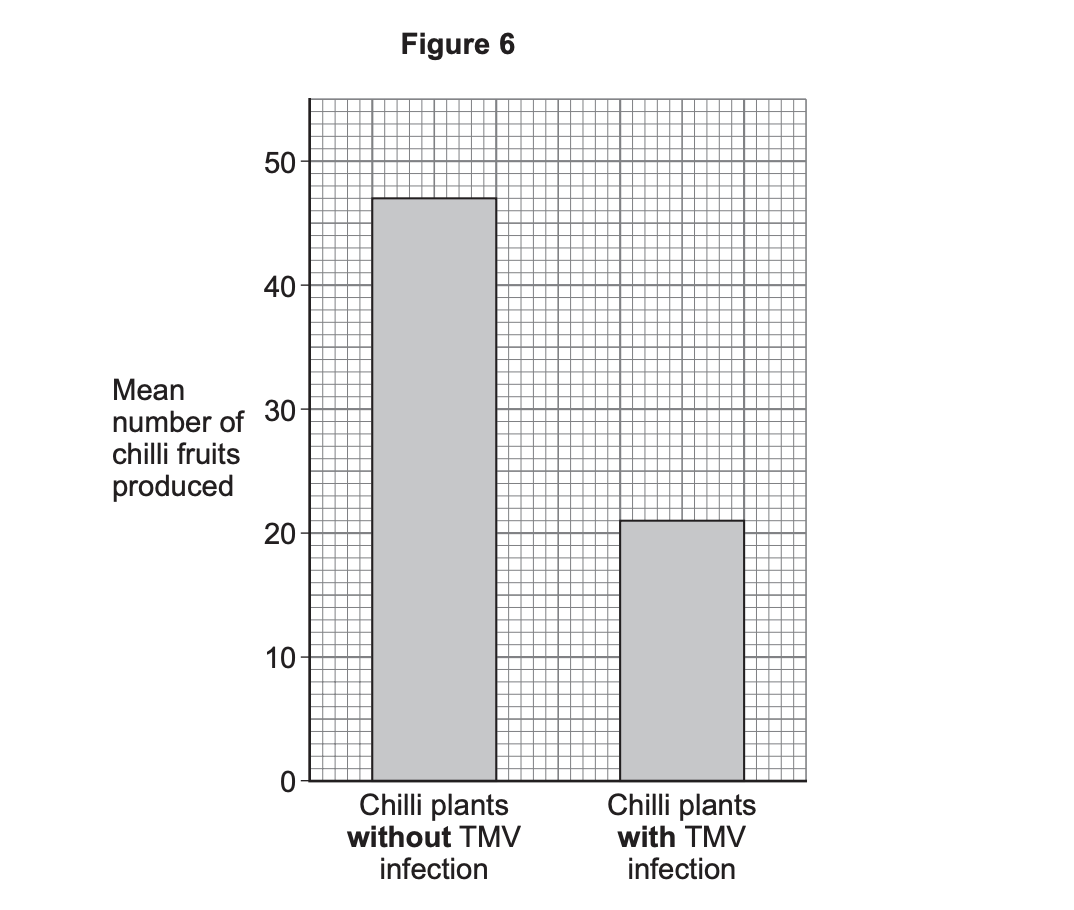
Figure 6 shows how infection with TMV affects the number of chilli fruits produced on chilli plants.

Figure 6

Bar chart comparing chilli yield: about 47 fruits on plants without TMV infection and about 21 fruits on plants with TMV infection.

Determine the decrease in the mean number of chilli fruits produced when plants are infected with TMV.

Decrease = ________ fruits

10
1 mark

Mineral ions are at:

  • a low concentration in sea water

  • a high concentration in algae.

Name the process algae use to absorb mineral ions from sea water.

11a
4 marks

Figure 5 shows a light microscope.

Figure 5

Figure 5: a light microscope with the eyepiece lens at the top, then a coarse focus adjustment and a fine focus adjustment knob, a rotating nosepiece holding the low power and high power objective lenses, the stage below, and a mirror at the base.

A student was given a prepared slide of cells.

Describe how the microscope in Figure 5 could be used to view the cells with the high power objective lens.

11b
2 marks

Light microscopes are not used to view viruses.

What are two reasons why electron microscopes are used to view viruses?

Tick (✓) two boxes.

  • Electron microscopes are expensive to maintain

  • Electron microscopes can have a magnification of ×1 000 000

  • Electron microscopes have a high resolving power

  • Viruses are not living organisms

  • Viruses are found and are replicated inside living cells

12
3 marks

The concentration of potassium ions in the soil is 3.9 μg/cm³.

The concentration of potassium ions in the root tissue is 2500 μg/cm³.

Explain why the concentration is so much higher in the roots than in the soil.

13a
1 mark

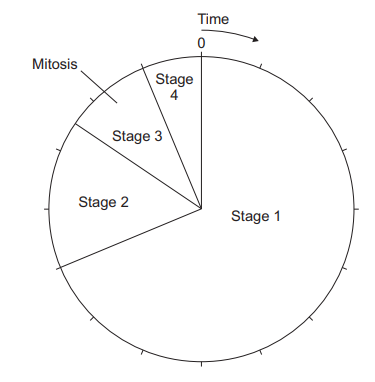
Cells divide in a series of stages called the cell cycle.

Figure 13 shows a cell cycle for a human cell.

Figure 13

Figure 13: circular cell cycle diagram with time progressing clockwise from 0. The cycle is divided into four sectors labelled Stage 1 (the largest), Stage 2, Stage 3, Mitosis, and Stage 4.

What happens during the mitosis stage of the cell cycle?

Tick (✓) one box.

  • Chromosomes move to opposite ends of the cell.

  • Copies of the organelles are made.

  • The cell increases in size.

13b
1 mark

Before a cell divides by mitosis, the mass of DNA in the cell is 6 picograms.

What mass of DNA will be in each of the new cells at the end of cell division?

Tick (✓) one box.

  • 3 picograms

  • 6 picograms

  • 12 picograms

13c
Sme Calculator
3 marks

One cell takes 16 hours to divide and form two new cells.

Estimate the total number of cells produced from one cell at the end of 48 hours.

Use the following steps.

Calculate the number of divisions in 48 hours

Calculate the number of cells after 48 hours

Number of cells = --------------

13d
1 mark

Give one factor that can cause a mutation in DNA.

Do not refer to ionising radiation in your answer.

13e
3 marks

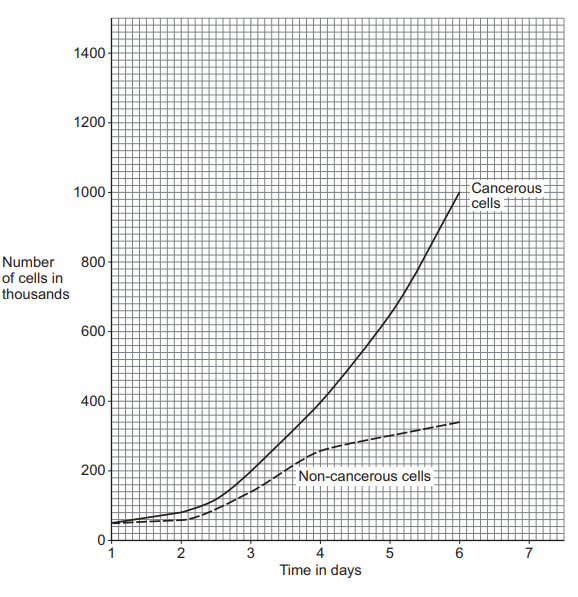
A mutation in DNA may cause cells to become cancerous.

Figure 14 shows the change in the number of cancerous cells and non-cancerous cells during 6 days.

Figure 14

Figure 14: line graph of Number of cells in thousands (y-axis 0–1400) against Time in days (x-axis 1–7). A solid line for cancerous cells starts near 50 at day 1, stays low to day 2, then rises rapidly, reaching about 1000 at day 6. A dashed line for non-cancerous cells starts near 50 at day 1, rises more slowly to about 200 at day 3, then about 340 at day 6.

Describe three patterns shown in Figure 14.

Use data from Figure 14.

1

2

3

13f
2 marks

Predict the number of non-cancerous cells on day 7 if the pattern from day 4 continued.

You should extend the line for non-cancerous cells on the graph in Figure 14.

Number of cells =------------------ thousand

14a
Sme Calculator
2 marks

All living organisms are made of cells.

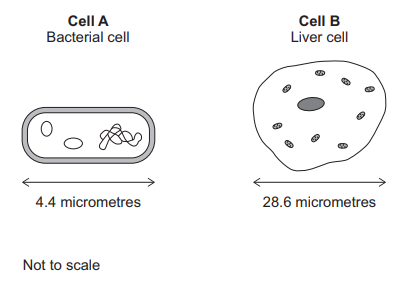
Figure 15 shows two types of cell.

Figure 15

Figure 15: two cells drawn not to scale. Cell A (Bacterial cell) is a small rod-shaped cell with a single loop of DNA and small rings (plasmids), labelled 4.4 micrometres long. Cell B (Liver cell) is a larger irregular cell with a nucleus and several oval mitochondria, labelled 28.6 micrometres across.

Calculate how many times longer the liver cell is than the bacterial cell.

Number of times longer = ---------------------

14b
4 marks

Compare the structure of cell A with the structure of cell B.

You should include similarities and differences in your answer.

Do not refer to cell size.

14c
1 mark

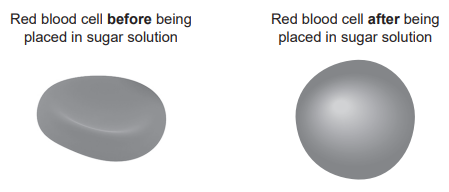
A scientist investigated the effect of different concentrations of sugar solution on red blood cells.

Figure 16 shows the effect of placing a red blood cell into a sugar solution.

Figure 16

Figure 16: two drawings of a red blood cell. Before being placed in sugar solution: a flattened biconcave disc. After being placed in sugar solution: a swollen, almost spherical shape.

What conclusion can be made from the result in Figure 16?

Tick (✓) one box.

  • The sugar solution was less concentrated than inside the cell.

  • The sugar solution was the same concentration as inside the cell.

  • The sugar solution was more concentrated than inside the cell.

14d
6 marks

A student investigated the effect of different concentrations of sugar solution on the change in mass of plant tissue.

The student used pieces of potato.

Describe a method the student could use to produce valid results.

14e
2 marks

The student used a valid method.

The student calculated the percentage change in mass of the pieces of potato.

Table 5 shows the results.

Table 5

Concentration of sugar solution in mol/dm3

Percentage (%) change in mass

0.0

28

0.1

15

0.2

3

0.3

−5

0.4

−10

0.5

−12

Complete Figure 17.

You should:

  • plot the data from Table 5

  • draw a line of best fit

Some of the results have been plotted for you (the points at 0.3 mol/dm3 = −5, 0.4 mol/dm3 = −10 and 0.5 mol/dm3 = −12 are already marked).

14f
1 mark

Determine the concentration of sugar solution that would cause no change in the mass of a piece of the potato.

Use Figure 17.

Concentration of sugar solution = ----------mol/dm3

15a
1 mark

Bacteria can cause disease.

Bacterial cells do not have a nucleus.

Which term describes bacterial cells?

Tick (✓) one box.

  • Eukaryotic

  • Fungal

  • Prokaryotic

15b
1 mark

Bacterial cells have no nucleus and are smaller than animal cells.

Give one other difference between bacterial cells and animal cells.

16a
2 marks

This question is about plant tissues.

Plant meristem tissue is found in the growing tips of shoots and roots.

Name two processes in plants that only occur in meristem tissue.

16b
3 marks

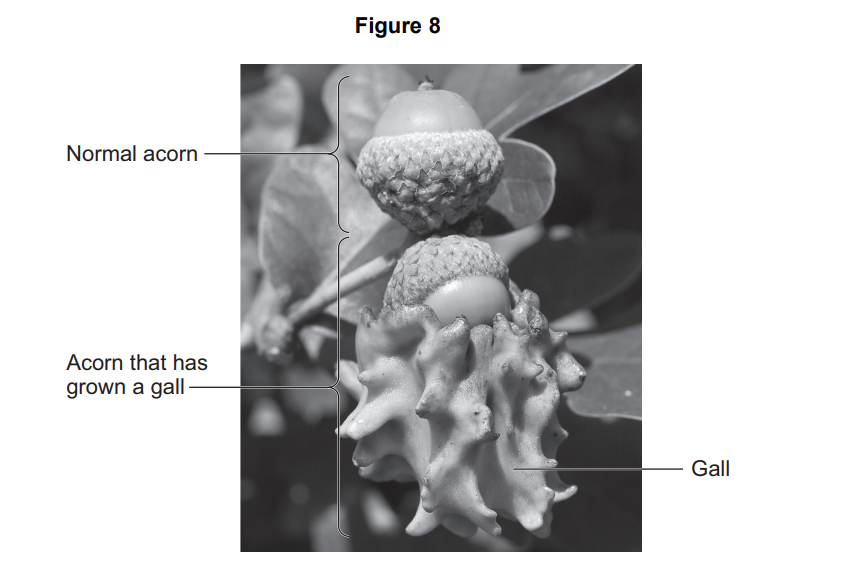
An acorn is a nut that contains the seed of an oak tree.

When one type of insect lays an egg in an acorn, the acorn grows abnormally. The abnormal growth is called a gall. An insect embryo grows inside the gall.

Figure 8 shows a normal acorn and an acorn that has grown a gall.

Black-and-white photo of a twig with a normal acorn above another acorn partly enclosed in a large, knobbly gall, with labels identifying each.

The seed in an acorn forms from one original cell with two sets of oak tree chromosomes.

The original cell in each seed was produced by sexual reproduction.

The gall has cells that contain two sets of oak tree chromosomes.

Compare the process that produced the original cell in each seed with the process that produced cells in the gall.

17
1 mark

Sexual reproduction in humans involves the joining together of an egg cell and a sperm cell.

The sex of an embryo is decided by the chromosomes they inherit from their mother and father.

Where in the cell are the chromosomes?

Tick one box.

  • Cell membrane

  • Cytoplasm

  • Nucleus

  • Ribosomes