The Earth’s Atmosphere (AQA GCSE Combined Science: Synergy: Life & Environmental Sciences): Exam Questions

Exam code: 8465

2 hours17 questions
1a
3 marks

Figure 1 shows part of the water cycle.
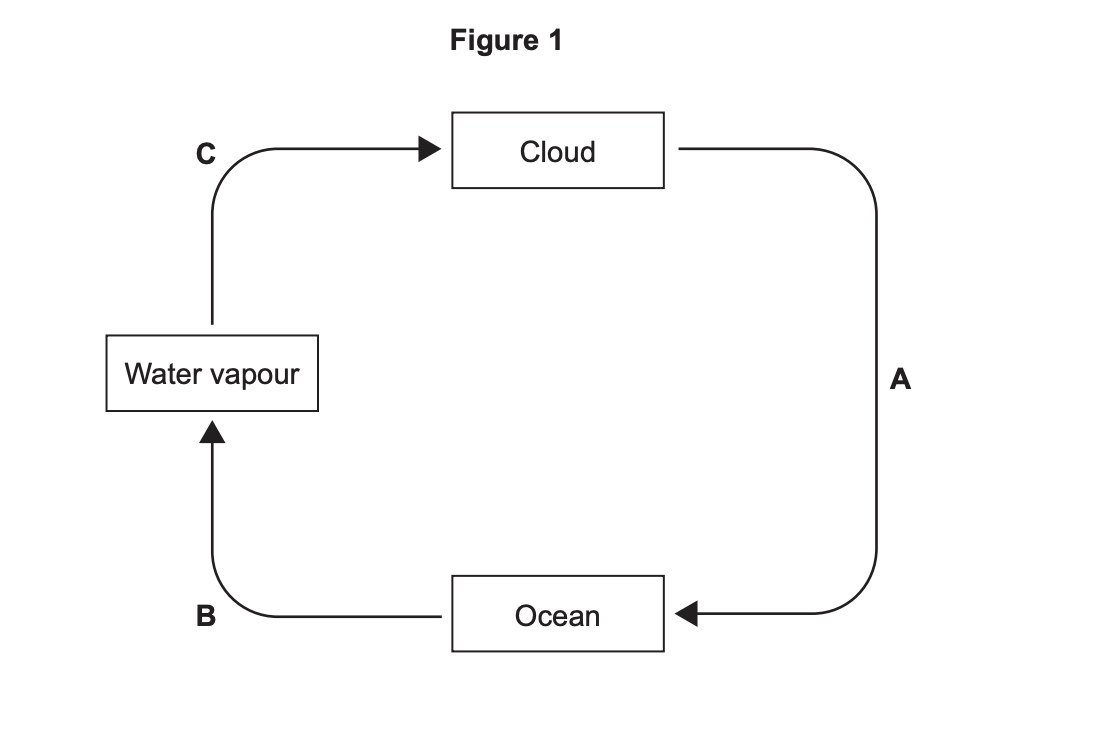
Diagram of the water cycle: arrows show sequence A cloud to ocean, B ocean to water vapour, C water vapour to cloud.

Name processes A, B and C.

Choose answers from the box.
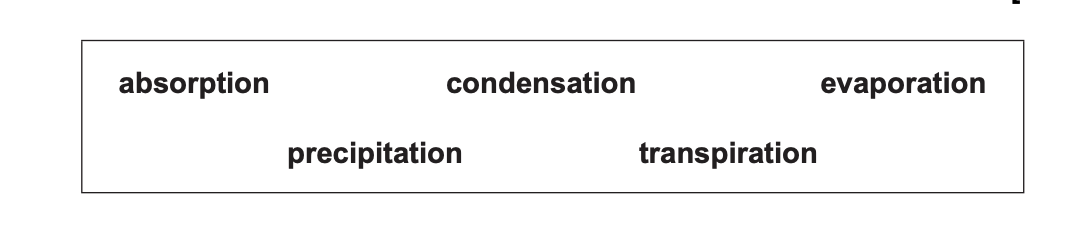
Box showing five water cycle terms in bold text: absorption, condensation, evaporation, precipitation and transpiration.

A _________________________

B_________________________

C_________________________

1b
1 mark

Drinking water can be produced from sea water.

Which process is used to produce drinking water from sea water?

Tick (✓) one box.

  • Desalination

  • Digestion

  • Screening

1c
1 mark

Why is producing drinking water from sea water expensive?

Tick (✓) one box.

  • The process requires energy.

  • The sea water must be filtered.

  • The sea water temperature is too high.

1d
2 marks

Which two processes are used to kill bacteria during the production of drinking water?

Tick (✓) two boxes.

  • Adding chlorine

  • Exposure to ultraviolet light

  • Freezing

  • Grit removal

  • Sedimentation

1e
1 mark

Why is it important to kill bacteria in water during the production of drinking water?

2a
1 mark

Pollutants in the atmosphere can be harmful to the environment and to human health.

Four pollutants in the atmosphere are:

  • carbon monoxide

  • oxides of nitrogen

  • particulates

  • sulfur dioxide

How is carbon monoxide produced?

Tick (✓) one box.

  • By carbon dioxide dissolving in water

  • From the incomplete combustion of hydrocarbon fuels

  • When carbonates form sedimentary rocks

2b
1 mark

What is formed when sulfur dioxide dissolves in moisture in the air?

Tick (✓) one box.

  • Acid rain

  • Methane

  • Ozone

2c
1 mark

Complete the sentence.

Oxides of nitrogen are produced when fuels are burnt in air at a high _____________ .

2d
1 mark

Give one way that oxides of nitrogen can be harmful to human health.

2e
1 mark

Particulates are classified into different groups depending on the diameter of the particulate.

Table 1 shows information about the different groups.

Table 1

Particulate group

Particulate diameter in micrometres

PM10

Less than 10 and more than 2.5

PM2.5

Less than 2.5 and more than 0.1

PM0.1

Less than 0.1

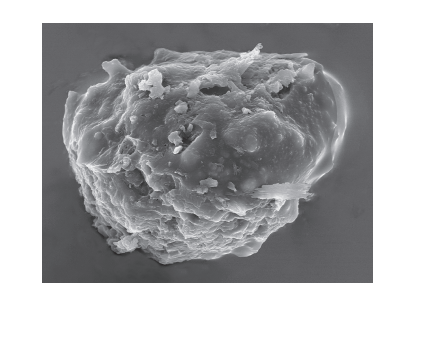
Figure 7 shows a soot particle viewed using an electron microscope.

Figure 7

Figure 7: electron-microscope image of an irregular, rough-surfaced soot particle.

The diameter of the soot particle in Figure 7 is 1.5 micrometres.

Which particulate group does the soot particle belong to?

Use Table 1.

Tick (✓) one box.

  • PM10

  • PM2.5

  • PM0.1

2f
Sme Calculator
3 marks

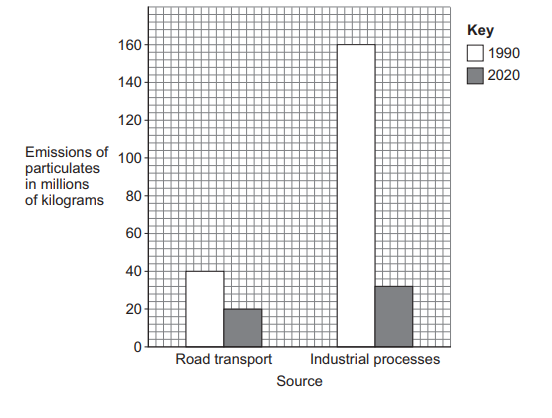
Figure 8 shows the emissions of particulates from two different sources in 1990 and in 2020.

Figure 8

Figure 8: bar chart of Emissions of particulates in millions of kilograms (y-axis 0–160) against Source (Road transport and Industrial processes), with a key showing 1990 (white bars) and 2020 (grey bars). Road transport bars: 1990 ≈ 40, 2020 ≈ 20. Industrial processes bars: 1990 ≈ 160, 2020 ≈ 32.

Determine the difference between the emission of particulates from industrial processes and the emission of particulates from road transport in 1990.

Use Figure 8.

Emission of particulates from industrial processes = __________ millions of kilograms

Emission of particulates from road transport = _____________millions of kilograms

Difference in emissions of particulates in 1990 = _______________ millions of kilograms

2g
3 marks

Give three conclusions from Figure 8.

1

2

3

3a
1 mark

Pollutants in the atmosphere can be harmful to the environment and to human health.

Four pollutants in the atmosphere are:

  • carbon monoxide

  • oxides of nitrogen

  • particulates

  • sulfur dioxide

Describe how carbon monoxide is produced from hydrocarbon fuels.

3b
1 mark

Describe one harmful effect of oxides of nitrogen.

3c
Sme Calculator
4 marks

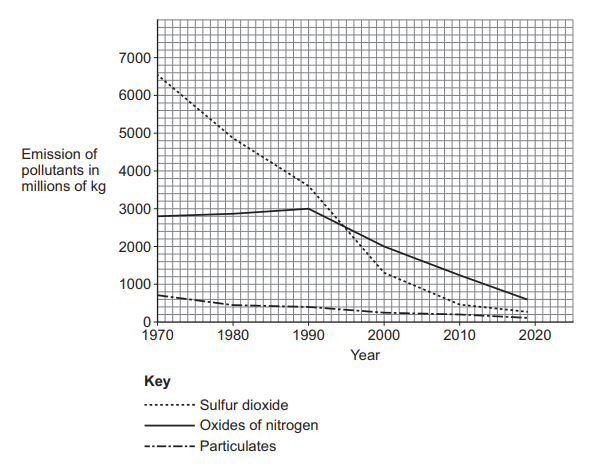
Figure 7 shows the emissions of three atmospheric pollutants from 1970 to 2019.

Figure 7

Figure 7: line graph of Emission of pollutants in millions of kg (y-axis 0–7000) against Year (x-axis 1970–2020). Three lines: Sulfur dioxide (dotted) falls steeply from about 6500 in 1970 to about 200 in 2019; Oxides of nitrogen (solid) rises slightly from about 2800 in 1970 to about 3000 in 1990, then falls to about 600 in 2019; Particulates (dash-dot) falls gently from about 700 in 1970 to about 200 in 2019.

Determine the percentage change in emission of oxides of nitrogen from 1970 to 2019.

Give your answer to 2 significant figures.

Percentage change (2 significant figures) = ___________ %

3d
3 marks

Compare the changes in the emission of atmospheric pollutants from 1970 to 2019.

You should refer to:

  • sulfur dioxide

  • oxides of nitrogen

  • particulates

Use Figure 7.

3e
1 mark

Suggest one reason for the change in the emission of atmospheric pollutants shown in Figure 7.

3f
Sme Calculator
5 marks

Particulates are classified into different groups depending on diameter of the particulate.

Table 4 shows information about the different groups.

Table 4

Particulate group

Particulate diameter in micrometres

PM10

>2.5 and <10

PM2.5

>0.1 and <2.5

PM0.1

<0.1

A soot particle was viewed using a microscope.

The magnification used was ×5000.

The diameter of the image of the soot particle was 7.5 mm.

Determine the particulate group of the soot particle.

1 mm = 1000 micrometres

Use Table 4.

Real diameter of soot particle = micrometres

Particulate group. Tick (✓) one box.

  • PM10

  • PM2.5

  • PM0.1

4a
2 marks

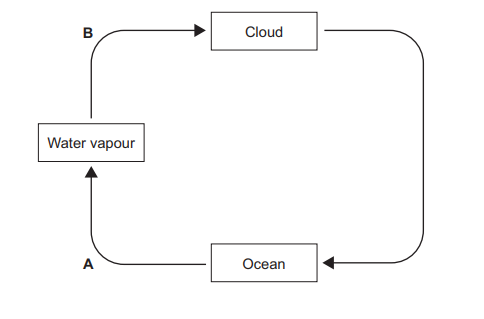
Figure 4 shows part of the water cycle.

Figure 4

Figure 4: water cycle diagram with three labelled boxes — Water vapour, Cloud and Ocean. Arrow A goes from Ocean to Water vapour. Arrow B goes from Water vapour to Cloud. A further arrow goes from Cloud to Ocean (precipitation).

Name processes A and B shown on Figure 4.

4b
2 marks

Water that is safe to drink is called potable water.

Give two methods used to sterilise potable water.

4c
2 marks

Explain why it is more expensive to produce potable water from sea water than from river water.

4d
2 marks

Waste water must be treated to produce potable water.

Waste water from fields where crops are growing may contain chemicals.

Suggest two types of chemical from fields where crops are growing that must be removed from waste water.

4e
2 marks

One step in sewage treatment is sedimentation to produce sewage sludge and effluent.

What further treatment is used on the sewage sludge and on the effluent?

Sewage sludge ____________________

Effluent __________________________

5a
5 marks

Carbon-14 is formed in the atmosphere.

Carbon-14 reacts with oxygen to produce carbon dioxide.

Explain why animal tissues contain carbon-14

5b
2 marks

In 1991 the frozen remains of a human body were found in a glacier.

The carbon-14 in the body was used to determine the age of the body.

The body was 5400 years old.

Explain why the body tissues had not decayed completely.

6a
1 mark

An isotope of carbon is carbon-14

Plants contain carbon-14

How does carbon-14 pass from plants to animals?

6b
1 mark

In 1991, the frozen remains of a human body were found in a glacier.

The body was 5400 years old.

The body tissues had not decayed completely.

What causes the decay of body tissues?

Tick (✓) one box.

  • Carbon dioxide

  • Microorganisms

  • Mineral ions

7a
3 marks

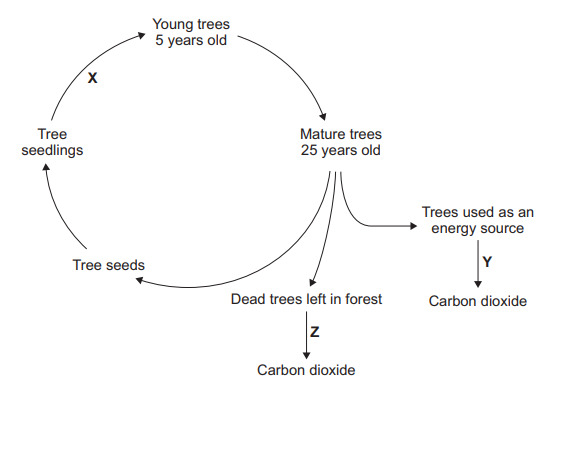
In a managed forest:

  • tree seedlings are regularly planted

  • some trees are regularly removed

Figure 12 shows information about the managed forest.

Figure 12

Figure 12: cycle diagram. Tree seeds → tree seedlings → (via process X) young trees 5 years old → mature trees 25 years old. From mature trees: branches lead to (a) tree seeds, (b) trees used as an energy source which release carbon dioxide via process Y, and (c) dead trees left in forest which release carbon dioxide via process Z.

Name the processes X, Y and Z in Figure 12.

Choose answers from the box.

combustion

decomposition

evaporation

fertilisation

growth

7b
1 mark

The dead trees are broken down during process Z.

What type of organism breaks down the dead trees?

7c
3 marks

Explain how growing trees reduces climate change.

You should refer to carbon dioxide in your answer.

7d
2 marks

A scientist investigated the number of tree species in two forests in 1970 and 2000.

Table 4 shows the results.

Table 4

Forest

Number of tree species (1970)

Number of tree species (2000)

A

26

24

B

28

22

Give two conclusions about the number of tree species in the forests in 1970 and 2000.

8a
1 mark

Carbon monoxide is an atmospheric pollutant.

How is carbon monoxide formed?

  • Incomplete combustion of hydrocarbons

  • Photosynthesis by plants

  • Purification of water

8b
1 mark

Breathing in carbon monoxide can cause carbon monoxide poisoning.

Which of the following is a symptom of carbon monoxide poisoning?

Tick (✓) one box.

  • Burns on the skin

  • Faster heart rate

  • High temperature

8c
1 mark

Carbon monoxide can build up in a room.

The risk of carbon monoxide poisoning can be reduced by opening windows in the room.

Suggest how opening windows reduces the risk of carbon monoxide poisoning.

9a
Sme Calculator
2 marks

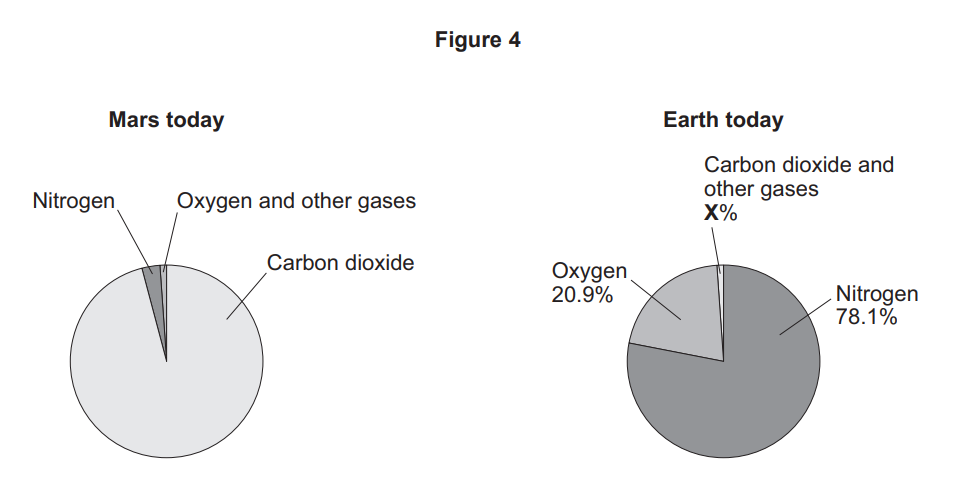
The atmosphere of the Earth has changed since the Earth formed.

The Earth's early atmosphere may have been similar to the atmosphere of Mars today.

Figure 4 shows the main gases in the atmosphere of Mars today and the atmosphere of the Earth today.

Two pie charts comparing Mars and Earth atmospheres today: Mars mostly carbon dioxide, tiny nitrogen and oxygen; Earth mostly nitrogen, some oxygen, small other gases.

Determine percentage X in Figure 4.

X = ______________ %

9b
3 marks

Give three differences between the atmosphere of the Earth today and the atmosphere of Mars today.

Use Figure 4.

9c
1 mark

What was the source of the nitrogen in the Earth's early atmosphere?

  • Decay of dead animals

  • Formation of sedimentary rocks

  • Volcanic activity

9d
1 mark

Why did the formation of oceans cause the carbon dioxide concentration in the Earth's early atmosphere to change?

  • Carbon dioxide condensed to form the oceans.

  • Carbon dioxide dissolved in the oceans.

  • Carbon dioxide evaporated from the oceans.

9e
1 mark

It was important that the water in the meteorite was analysed as soon as possible.

Suggest one reason why.

10a
1 mark

The atmosphere of the Earth has changed since the Earth formed.

What was the source of nitrogen in the Earth's early atmosphere?

10b
Sme Calculator
4 marks

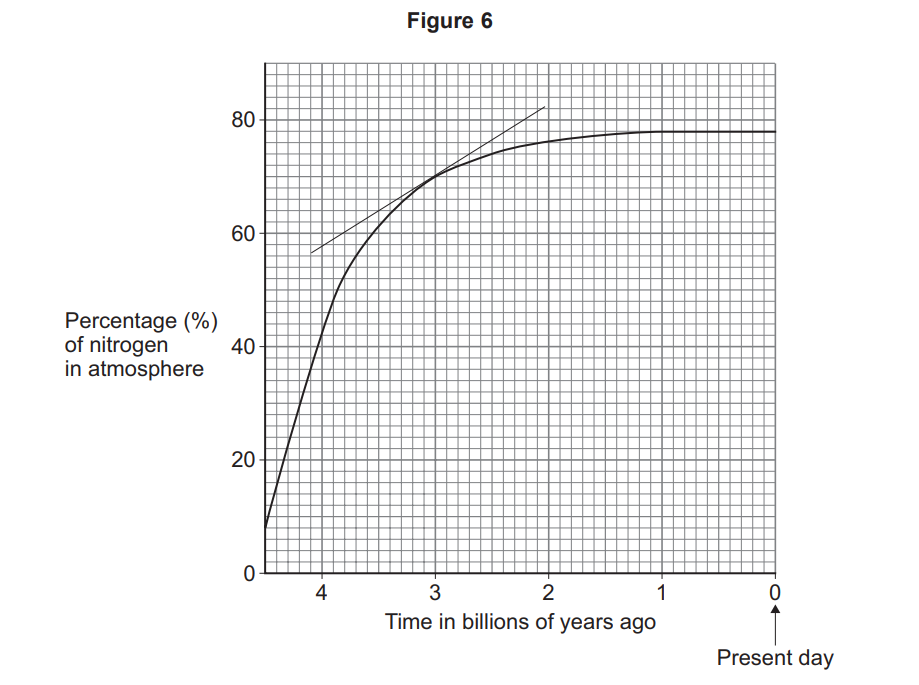
Figure 6 shows the change in the percentage of nitrogen in the Earth's atmosphere during the last 4.5 billion years.

Graph showing atmospheric nitrogen rising steeply from near 0% four billion years ago to about 78% today, then levelling off into a near-horizontal line

The graph shows a tangent drawn at 3.0 billion years ago.

Determine the rate of change in the percentage of nitrogen in the atmosphere 3.0 billion years ago.

Give your answer to 2 significant figures.

Rate of change (2 significant figures) = __________ % per billion years

10c
1 mark

Why did the percentage of carbon dioxide in the Earth's early atmosphere change when the oceans formed?

11a
2 marks

Two students analysed water from four rivers.

Each student measured the pH of the river water using a different method.

Table 5 shows the results.

Table 5

River

pH of river water

Method A

Method B

W

7

7.4

X

6

6.5

Y

8

8.1

Z

7

7.6

Suggest what was used to measure the pH in each method.

Method A: _____________________________________

Method B: _____________________________________

11b
1 mark

Why is it not valid to calculate a mean of the two pH values for each river?

Tick (✓) one box.

  • A mean cannot be calculated from only two values.

  • Each method gives values to a different resolution.

  • The mean should be calculated for each method using all four samples.

11c
1 mark

Complete the sentence. Choose the answer from the box.

accurate

repeatable

reproducible

Method A and method B gave similar results.

This shows that the results are .

11d
1 mark

Which river is most likely to be in an area with a high concentration of sulfur dioxide in the air?

Use Table 5.

Tick (✓) one box.

  • W

  • X

  • Y

  • Z

11e
3 marks

Explain your answer to Question 08.4.

11f
4 marks

Describe a method to determine the mass of dissolved solids in 50 cm³ of river water.

12a
1 mark

Escherichia coli (E. coli) is a type of bacterium.

E. coli causes symptoms of food poisoning.

Water companies sterilise rain water to produce drinking water. The drinking water is then transported to homes in underground pipes. Flooding can cause contamination of the drinking water by E. coli.

Suggest how people should treat drinking water at home if there is a risk of E. coli contamination.

12b
Sme Calculator
3 marks

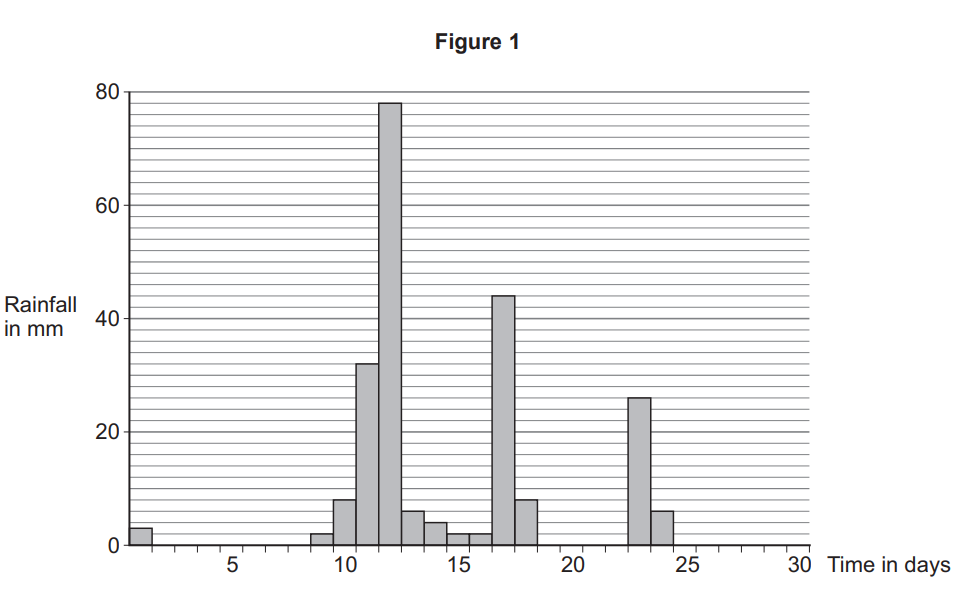
Figure 1 shows two graphs over the same one-month period:

  • Rainfall in mm (peak ≈78 mm at day 12)

  • Number of cases of E. coli (peak ≈40 cases at day 17, around 5 days after the rainfall peak)

Bar chart titled “Figure 1” showing daily rainfall in millimetres over 30 days, with heavy peaks around days 11–12, 17 and 23, and little rain otherwise
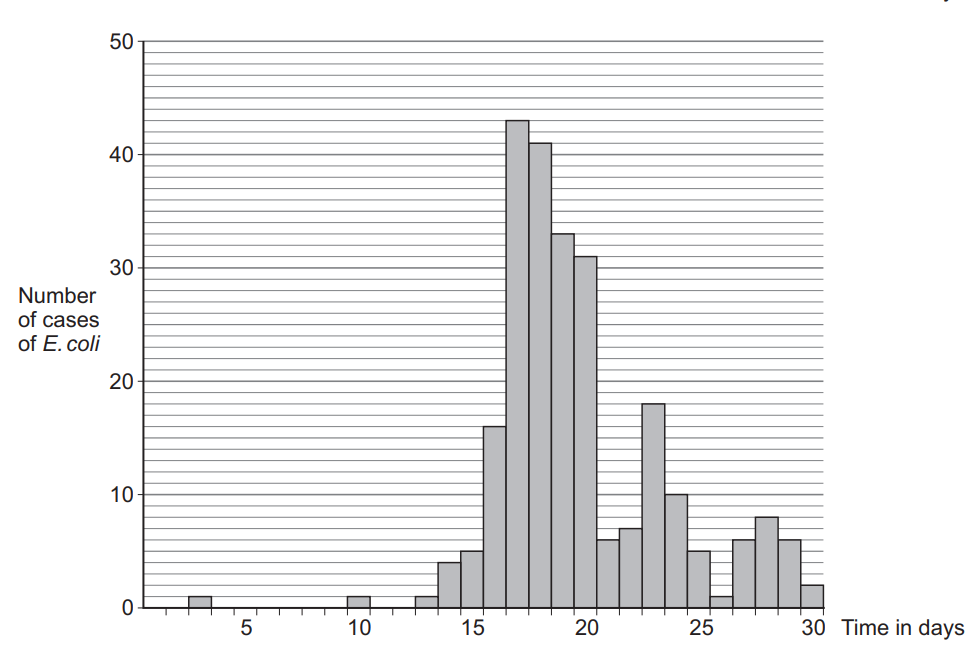
Histogram of daily E. coli cases over 30 days, showing a sharp peak around days 17–19 and lower, scattered case numbers before day 15 and after day 22

The rainfall on day 12 was greater than on day 10.

Calculate how many times greater.

Number of times greater = _____________

12c
1 mark

Symptoms of E. coli infection usually occur 5 days after infection.

A scientist stated:

'Increased rainfall causes an increase in the number of cases of E. coli.'

Describe one piece of evidence from Figure 1 that supports the scientist's statement.

12d
1 mark

Why might the number of cases of E. coli infection increase in the future?

Tick (✓) one box.

  • Climate change is causing loss of habitats for wildlife.

  • Climate change is causing more extreme rainfall.

  • Climate change is causing sea-levels to be lower.

  • Climate change is caused by an increase in the concentration of greenhouse gases in the atmosphere.

12e
2 marks

Climate change is caused by an increase in the concentration of greenhouse gases in the atmosphere.

Carbon dioxide is a greenhouse gas.

Name two other greenhouse gases.

Do not refer to carbon dioxide in your answer.

12f
1 mark

Describe one way the rate of increase in carbon dioxide concentration in the atmosphere could be reduced.

13a
2 marks

Carbon monoxide is an atmospheric pollutant.

Carbon monoxide can have dangerous effects on the human body.

Describe how carbon monoxide is formed from hydrocarbon fuels.

13b
1 mark

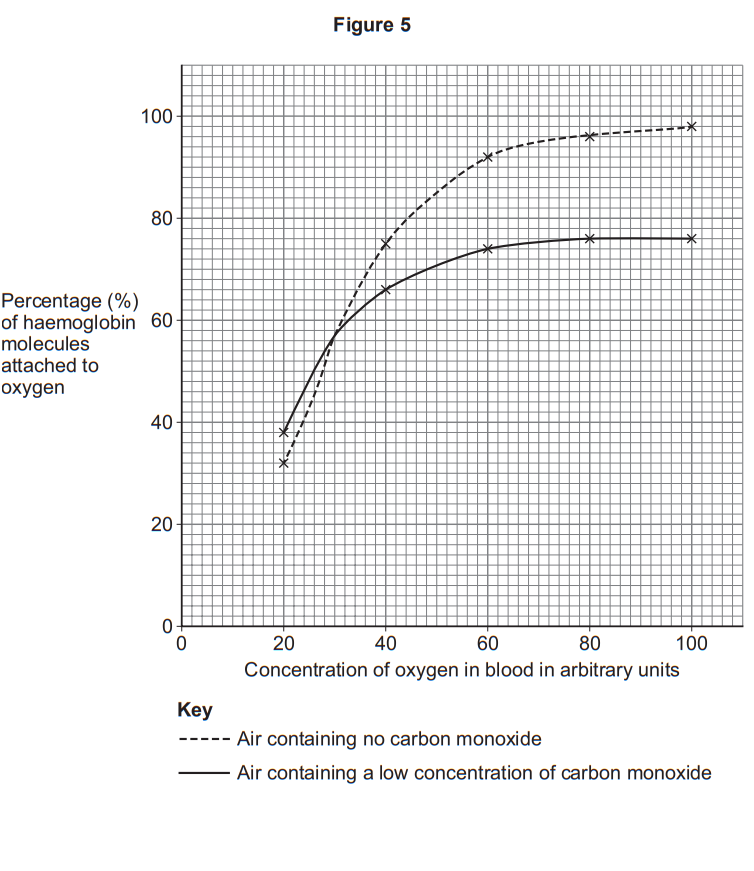
Scientists investigated the effect of breathing in air containing different concentrations of carbon monoxide. They measured the percentage of haemoglobin molecules attached to oxygen at different concentrations of oxygen in the blood.

The air breathed contained:

  • no carbon monoxide

  • a low concentration of carbon monoxide.

Figure 5 shows the results

Graph showing haemoglobin–oxygen saturation rising with blood oxygen; curve is higher without carbon monoxide than with low carbon monoxide in air.

A person:

  • breathes in air containing no carbon monoxide

  • has a concentration of oxygen in the blood of 90 arbitrary units.

What percentage of haemoglobin molecules are attached to oxygen?

Use Figure 5.

Percentage = __________%

13c
3 marks

The scientists repeated the investigation with air containing a higher concentration of carbon monoxide.

Table 3 shows the results.

Table 3

Concentration of oxygen in blood (arbitrary units)

Percentage (%) of haemoglobin molecules attached to oxygen

20

27

40

36

60

38

80

39

100

39

Complete Figure 5.

You should:

  • plot the data from Table 3

  • draw a line of best fit.

13d
2 marks

A person breathes in air containing a low concentration of carbon monoxide.

Suggest two symptoms the person might show.

14a
1 mark

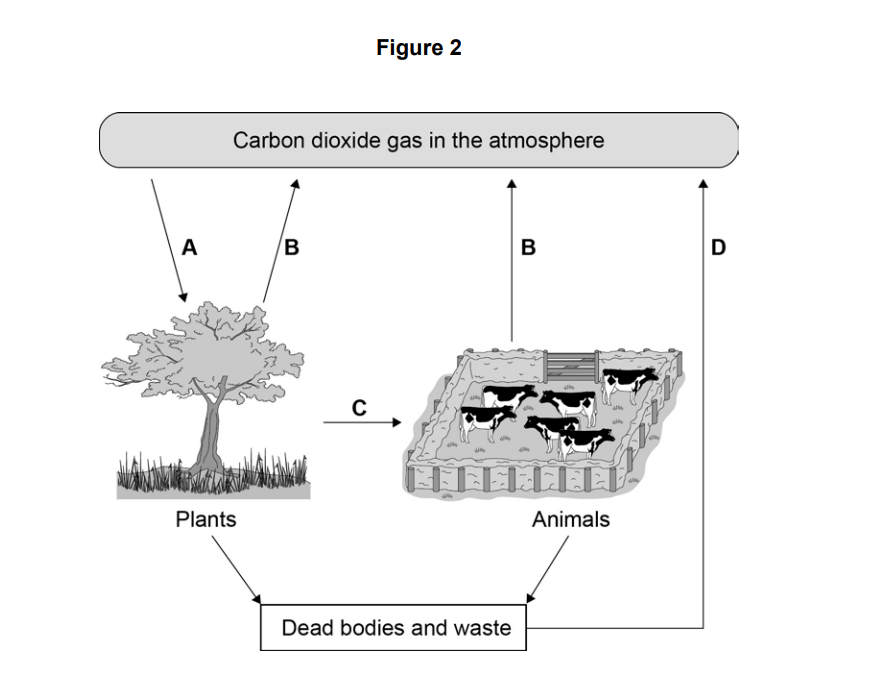
Figure 2 shows the carbon cycle.

Diagram of the carbon cycle showing arrows between atmospheric carbon dioxide, plants, animals, and dead bodies and waste labelled A, B, C and D

Use information from Figure 2 to answer the question.

In process A, carbon dioxide in the atmosphere is taken into plants.

What is process A?

Tick one box.

  • Evaporation

  • Fossilisation

  • Photosynthesis

  • Respiration

14b
1 mark

In process B, carbon dioxide is released from plants and animals into the atmosphere.

What is process B?

Tick one box.

  • Burning

  • Feeding

  • Photosynthesis

  • Respiration

14c
1 mark

In which process is carbon passed from one organism to another?

Tick one box.

  • A

  • B

  • C

  • D

14d
1 mark

What will happen to the concentration of carbon dioxide in the atmosphere if lots of trees are cut down?

14e
2 marks

Greenhouse gases cause global warming.

Carbon dioxide is a greenhouse gas.

Name two other greenhouse gases.

14f
1 mark

When living organisms die the dead material decays and is broken down.

The process of decay returns carbon dioxide to the atmosphere.

What type of organism causes decay?

15a
3 marks

Millions of years ago the Earth's atmosphere was probably like the atmosphere of Mars today.

Table 4 shows percentages of the main gases in the atmospheres of Earth and Mars today.

Table 4

Gas

Mars today (%)

Earth today (%)

Carbon dioxide

95.00

0.04

Nitrogen

3.50

78.00

Oxygen

0.50

21.00

For each gas in the table, suggest a reason for the change in the percentage of the gas in Earth's atmosphere.

Carbon dioxide: _____________________________________________

Nitrogen: __________________________________________________

Oxygen: ___________________________________________________

15b
2 marks

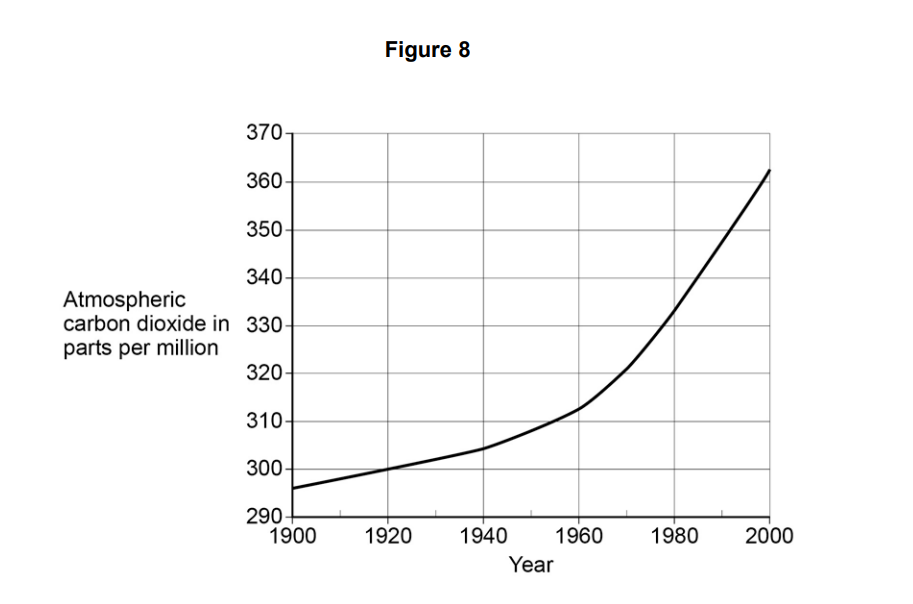
Figure 8 shows how the concentration of carbon dioxide in the Earth's atmosphere changed between 1900 and 2000.

Line graph titled “Figure 8” showing atmospheric CO₂ rising from about 295 ppm in 1900 to over 360 ppm in 2000, with steep acceleration after 1960

One of the causes of the increase in carbon dioxide between 1900 and 2000 is increased use of fossil fuels.

Suggest when use of fossil fuels began to increase.

Use data from Figure 8 to explain your answer.

15c
Sme Calculator
3 marks

What is the percentage increase in carbon dioxide levels between 1970 and 2000?

Increase = ____________%

15d
4 marks

Explain how the changes shown in Figure 8 can have harmful effects on the environment.

16a
2 marks

Oxides of nitrogen are produced when fuels are burnt.

Write a balanced symbol equation for the production of nitrogen dioxide (NO₂) from nitrogen and oxygen.

16b
Sme Calculator
3 marks

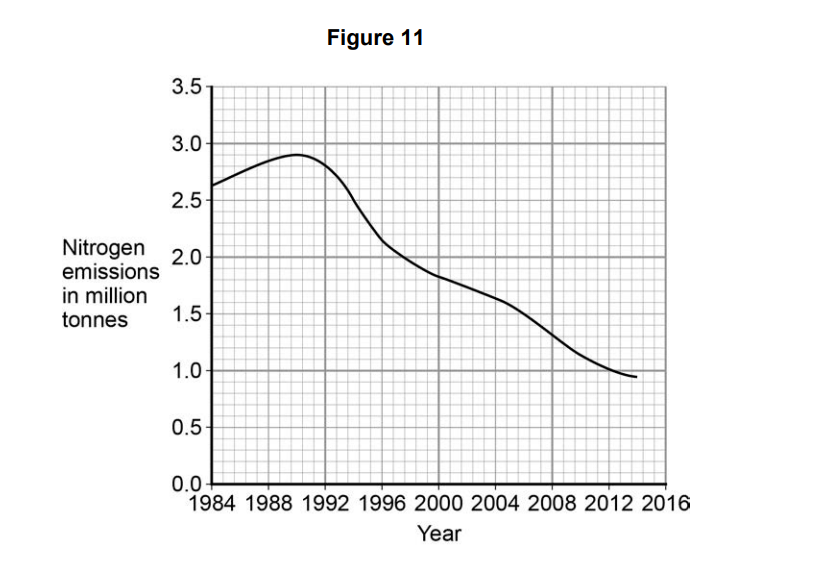
Figure 11 gives information about emissions of oxides of nitrogen in the UK

Line graph titled Figure 11 showing nitrogen emissions falling from about 2.7 to 1.0 million tonnes between 1984 and 2016 after a peak near 1990

Calculate the percentage decrease in emissions of oxides of nitrogen from 1990 to 2014.

Give your answer to three significant figures.

Percentage decrease =______________ %

16c
1 mark

Give one advantage of reducing the emissions of oxides of nitrogen.

17a
4 marks

All life on Earth depends on water.

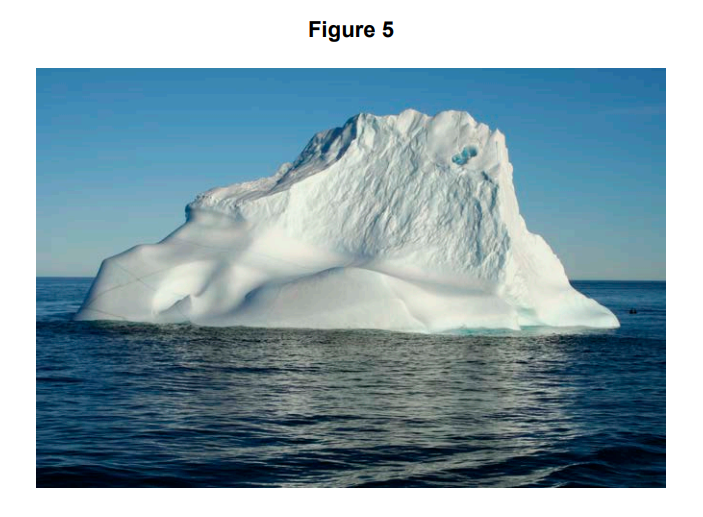
Figure 5 shows an iceberg floating on the sea.

Large white iceberg floating in calm, dark blue sea under a clear sky, showing smooth and jagged ice surfaces in bright sunlight

Explain how the water molecules in the iceberg could end up as water in a lake.

17b
4 marks

Rainwater collects in rivers and lakes.

Water in rivers and lakes contains materials that make the water unsafe to drink.

Describe how the water from rivers and lakes is treated to make it safe to drink.