Students investigated the effect of different concentrations of salt solution on the mass of pieces of potato.
This is the method used.
Cut three pieces of potato, each with a mass of 2.00 g.
Place the pieces of potato into a salt solution with a concentration of 0.2 mol/dm³.
After 30 minutes, measure the mass of each piece of potato.
Calculate the change in mass.
Repeat steps 1 to 4 for five other concentrations of salt solution.
Table 3 shows the results.
Table 3
Concentration of salt solution in mol/dm³ | Change in mass in g | Mean change in mass in g | ||
|---|---|---|---|---|
0.2 | 0.31 | 0.34 | 0.25 | 0.30 |
0.4 | -0.07 | -0.08 | -0.13 | -0.09 |
0.6 | -0.18 | -0.13 | -0.11 | -0.14 |
0.8 | -0.24 | -0.19 | -0.17 | -0.20 |
1.0 | -0.22 | -0.30 | -0.32 | -0.28 |
1.2 | -0.26 | -0.35 | -0.32 | X |
Give two control variables the students should have used in the investigation.
Do not refer to mass or time in your answer.
Calculate value X in Table 3.
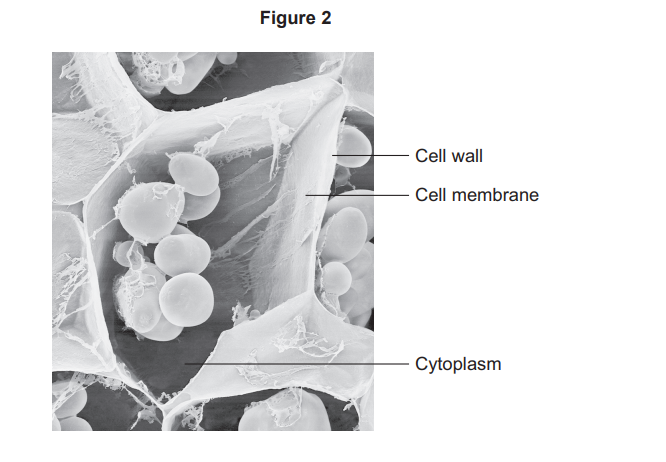
Figure 14 shows a potato cell.
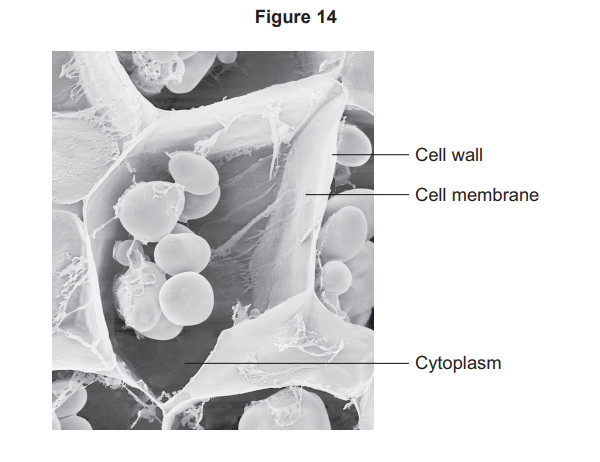
Explain why the mass of the pieces of potato increased in the 0.2 mol/dm³ salt solution.
You should refer to the cell parts labelled in Figure 14.
The image in Figure 14 was made using an electron microscope and not a light microscope.
Give one piece of evidence to support this.
The potato cell in Figure 14 contains starch grains.
A starch grain on a different image had a diameter of cm.
The starch grain had a real diameter of mm.
Calculate the magnification of the image.
Was this exam question helpful?