Lifestyle & Health (AQA GCSE Combined Science: Synergy: Life & Environmental Sciences): Exam Questions

Exam code: 8465

1 hour11 questions
1a
1 mark

Fatty material can build up in coronary arteries.

The flow of blood through coronary arteries may be reduced.

Which organ contains coronary arteries?

1b
3 marks

There are different treatments for coronary diseases.

Draw one line from each treatment to how the treatment works.
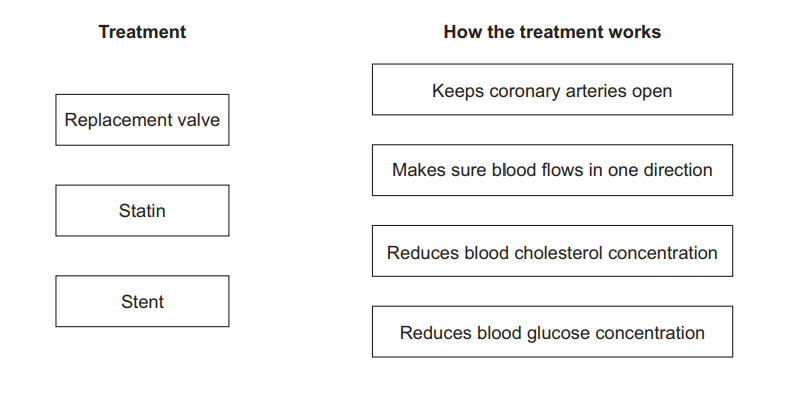
Worksheet showing three treatments (replacement valve, statin, stent) to be matched with four descriptions of how they work, including keeping coronary arteries open
2a
1 mark

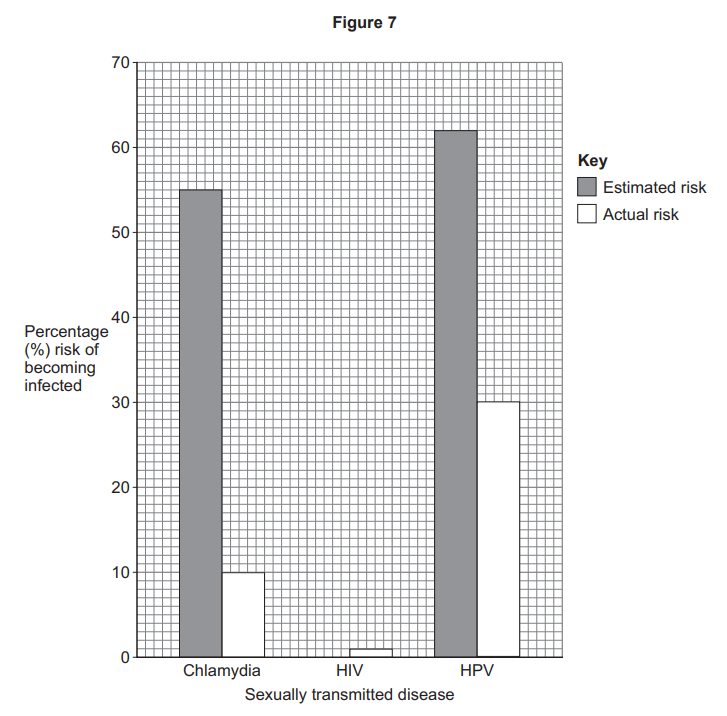
Students were asked to estimate the percentage risk of a person becoming infected with different STDs.

The estimate was compared to the actual percentage risk of infection.

Figure 7 shows the results.

Bar chart comparing estimated vs actual infection risk: Chlamydia 55% vs 10%, HIV 0% estimated and actual, HPV 62% vs 30% among sexually transmitted diseases.

The students estimated that the risk of HIV infection was 60%.

Plot the students' estimated risk of HIV infection on Figure 7.

2b
1 mark

Which STD in Figure 7 shows the greatest actual risk?

2c
Sme Calculator
2 marks

Calculate the difference between the estimated risk and the actual risk of becoming infected with chlamydia.

2d
1 mark

What conclusion can be made about the estimated risk of infection compared to the actual risk of infection with STDs?

2e
1 mark

Name one type of contraception that can control the spread of chlamydia.

3a
1 mark

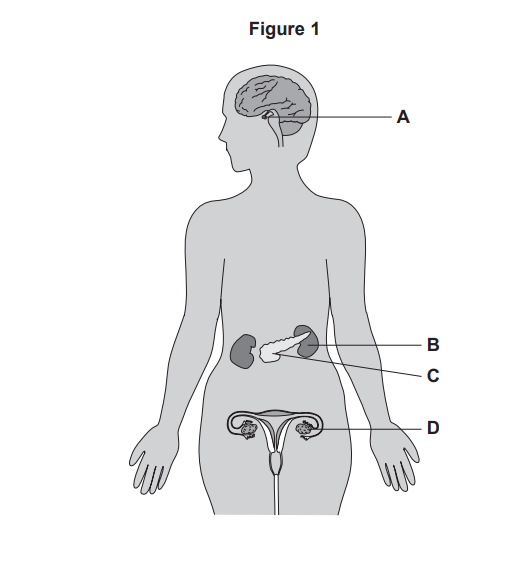
Figure 1 shows some of the organs in the human body.

Diagram of a female body showing side view brain and labelled internal organs: brain (A), pancreas (B), kidneys (C) and uterus with ovaries (D).

Which organ is the pituitary gland?

  • A

  • B

  • C

  • D

3b
1 mark

Which organ produces oestrogen?

  • A

  • B

  • C

  • D

3c
1 mark

Homeostasis is the control of the body's internal conditions.

Which internal body condition is controlled by homeostasis?

  • Body temperature

  • Muscle contraction

  • Nerve impulses

3d
1 mark

Homeostasis also controls blood glucose concentration.

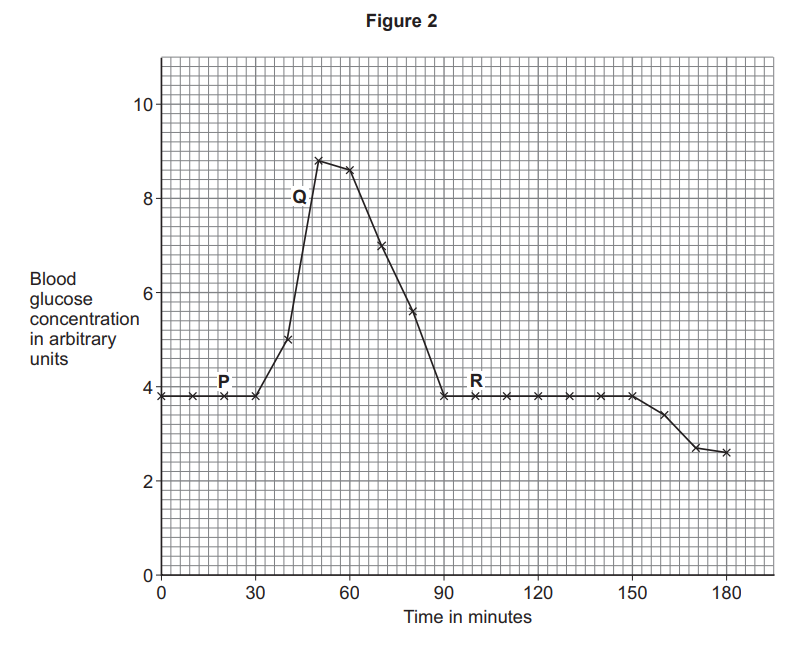
Figure 2 shows the change in blood glucose concentration in a person during 180 minutes.

Line graph of blood glucose concentration over 180 minutes, rising from 4 to peak near 9 at 60 minutes, then falling back to 4 and slowly declining further.

When did the person start eating a meal?

Use Figure 2.

  • P

  • Q

  • R

3e
1 mark

When blood glucose concentration is high the hormone insulin is released into the blood.

Complete the sentence.

Choose the answer from the box.

kidney

pancreas

stomach

Insulin is produced by the _______________.

3f
1 mark

When will the concentration of insulin in the blood be the greatest?

Use Figure 2.

  • P

  • Q

  • R

3g
1 mark

What might have caused the fall in blood glucose concentration at 150 minutes?

4
6 marks

Explain how diet and lifestyle can increase the risk of poor health and non-communicable diseases.

5a
2 marks

One symptom of chlamydia infection is damage of the uterus lining.

Which two hormones are involved in maintaining the uterus lining?

5b
2 marks

Explain how only some types of contraception reduce the spread of STDs.

6
1 mark

The protein from the spider could be used in a new drug to treat patients having a heart attack.

When a person has a heart attack:

  • cells in the heart muscle do not receive enough oxygen

  • cells in the heart muscle stop working.

Why are heart attacks non-communicable?

7a
2 marks

The protein from the poison may be used in a new drug.

The protein allows heart muscle tissue to function in low concentrations of oxygen.

Explain how coronary heart disease can decrease the concentration of oxygen in heart muscle tissue.

7b
1 mark

The new drug may be useful when transporting a donor heart to a patient for a heart transplant.

Suggest why.

7c
4 marks

The species of funnel-web spider that produces the poison comes from a small, remote area.

Evaluate the use of the poison from the funnel-web spider as a drug.

8a
2 marks

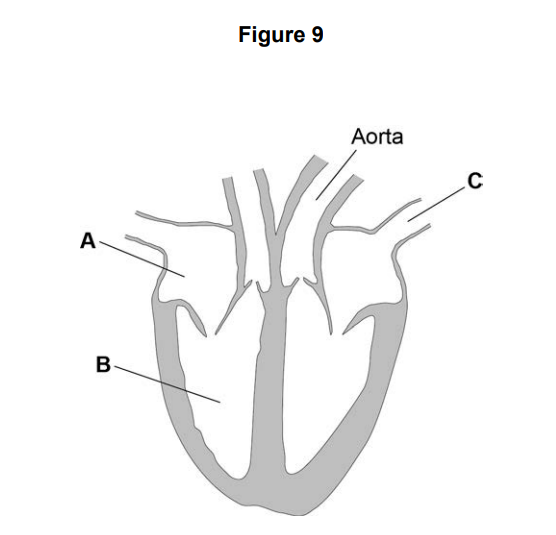
Figure 9 shows a diagram of the human heart.

Diagram of a vertical cross-section of the human heart, showing chambers and major blood vessels, with labels A, B and C plus the aorta at the top

Name parts A and B.

A = _________________________________________________

B = _________________________________________________

8b
4 marks

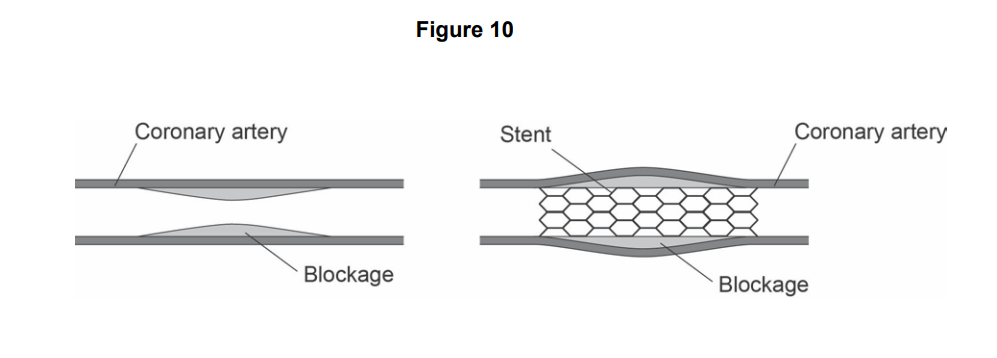
Coronary heart disease (CHD) develops when layers of fatty material build up in the coronary artery.

One treatment for CHD is to insert a stent into the coronary artery.

Figure 10 shows a stent in a coronary artery.

Diagram of a coronary artery with a narrowed blockage, and after insertion of a mesh stent holding the artery open around the blockage.

Explain why the stent helps to prevent a heart attack.

8c
2 marks

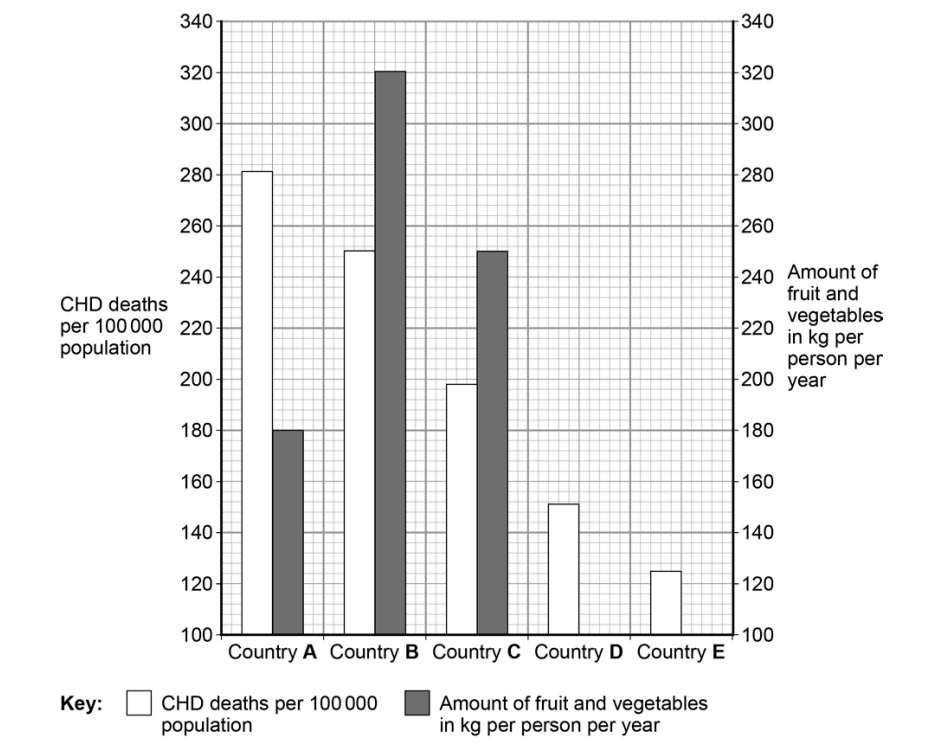
Look at Table 2.

Table 2

Country

Deaths from CHD per 100 000 per year

Fruit & vegetables eaten (kg per person per year)

A

285

180

B

250

320

C

198

250

D

151

220

E

125

244

Plot the missing bars for countries D and E on Figure 11 .

Use data from Table 2.

Figure 11

Bar chart comparing five countries, showing coronary heart disease deaths per 100,000 and annual fruit and vegetable intake in kg per person.
8d
Sme Calculator
1 mark

People in country B are more likely to die from CHD than people in country E.

How many more times as likely are people to die from CHD in country B than in country E?

8e
6 marks

A student concluded:

'The factor that causes CHD is not eating enough fruit and vegetables.'

Evaluate the student's conclusion.

Use data from Figure 11 , and your own knowledge, in your answer.

9a
1 mark

Blood sugar levels in the body are controlled by insulin.

How does insulin travel around the body?

9b
3 marks

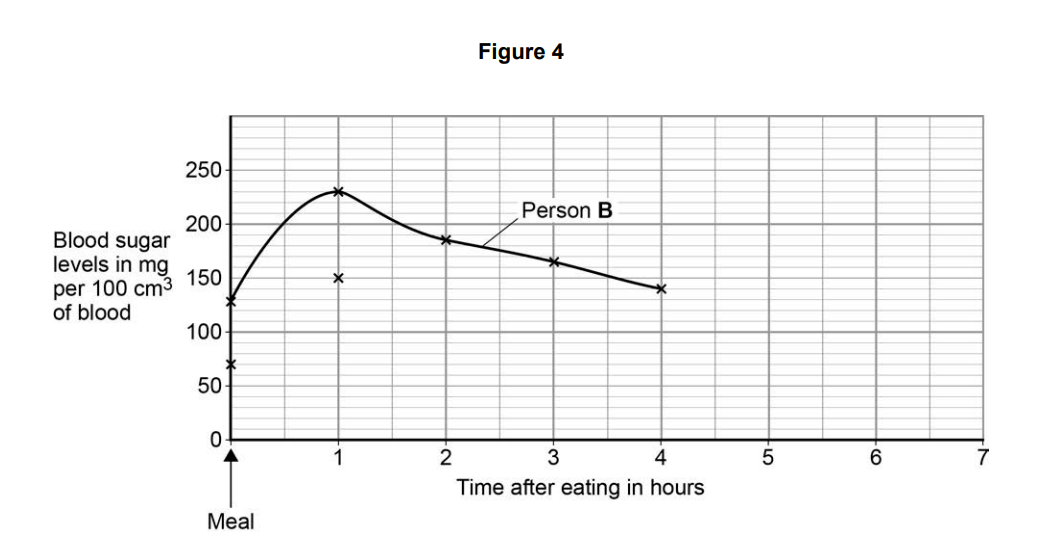
Table 3 shows the blood sugar levels for two people after eating a meal.

Time after eating (hours)

Blood sugar levels in mg per 100 cm3 of blood

Person A

Person B

0

70

130

1

150

230

2

90

185

3

80

165

4

75

140

Use data from Table 3 to complete the graph in Figure 4.

Plot the points for person A.

The first two points (0,70) and (1,150) have been plotted for you.

Draw a line through all the points.

Line graph for Person B showing blood sugar rising after a meal to about 230 mg/100 cm³ at 1 hour, then steadily falling over the next 3 hours
9c
1 mark

How long after the meal is person B's insulin production at its peak?

(Person B's blood sugar rises from 130 to 230 between 0 and 1 hour, then falls.)

9d
Sme Calculator
2 marks

What is the greatest decrease in the blood sugar level of person B in an hour?

Decrease = _______________mg per 100 cm³

9e
2 marks

Estimate how long after eating the meal it will take for person B's blood sugar level to return to the level before the meal .

Show your working on Figure 4 (extrapolate Person B's line).

10a
1 mark

Coronary heart disease (CHD) can be caused by many factors.

Table 3 shows data related to CHD for five countries.

Table 3

Country

CHD deaths per 100 000 per year

% smoke tobacco

% drink alcohol heavily

Fruit & veg (kg/person/year)

A

285

36

19

180

B

251

63

34

404

C

186

47

36

251

D

149

23

34

218

E

128

27

12

222

Name one risk factor for CHD that is not shown in Table 3.

10b
3 marks

A student concludes that the main cause of CHD is not eating enough fruit and vegetables.

Give three reasons why the student's conclusion is not correct.

Use information from Table 3.

10c
4 marks

Explain how the build-up of fatty material can damage the heart.

10d
2 marks

Describe how statins can help to reduce deaths from CHD.

11a
2 marks

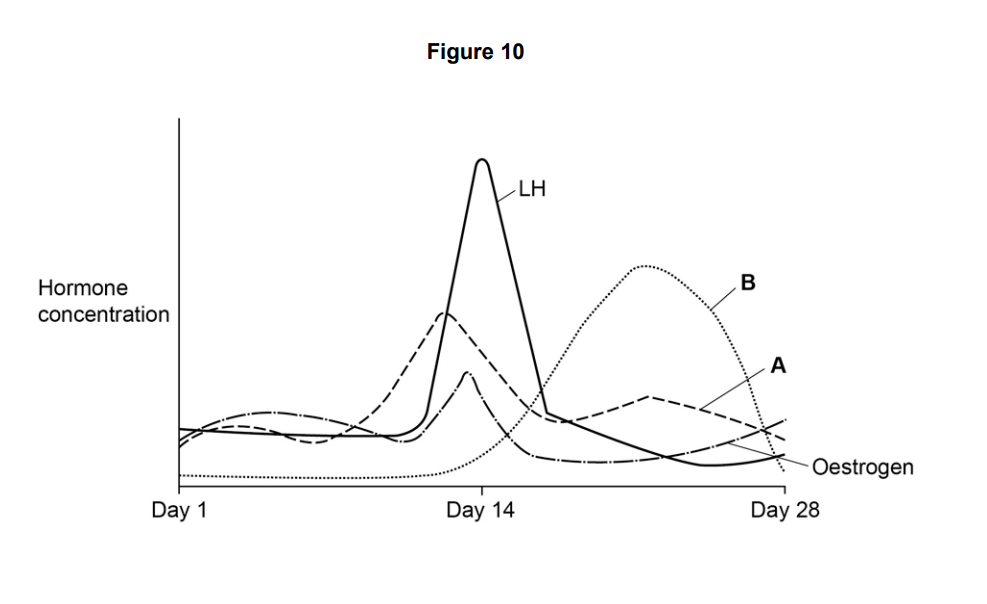
Figure 10 shows how the concentrations of the reproductive hormones in the blood of a woman change over 28 days.

Graph of menstrual cycle hormones from day 1–28, showing LH surge at day 14 and changing levels of progesterone, oestrogen and two other labelled hormones A and B

Name hormones A and B.

A = __________________________________________________

B = __________________________________________________

11b
2 marks

Use information from Figure 10 to explain what happens on Day 14.

11c
6 marks

In Vitro Fertilisation (IVF) treatment can be used to help women become pregnant.

IVF uses some of the hormones shown in Figure 10.

Explain why IVF increases the chance of some women becoming pregnant.