Generating Electricity (WJEC GCSE Science (Double Award): Physics): Exam Questions

Exam code: 3430

2 hours14 questions
1a
Sme Calculator
2 marks

The UK government wants to reduce the CO₂ emissions from power stations.

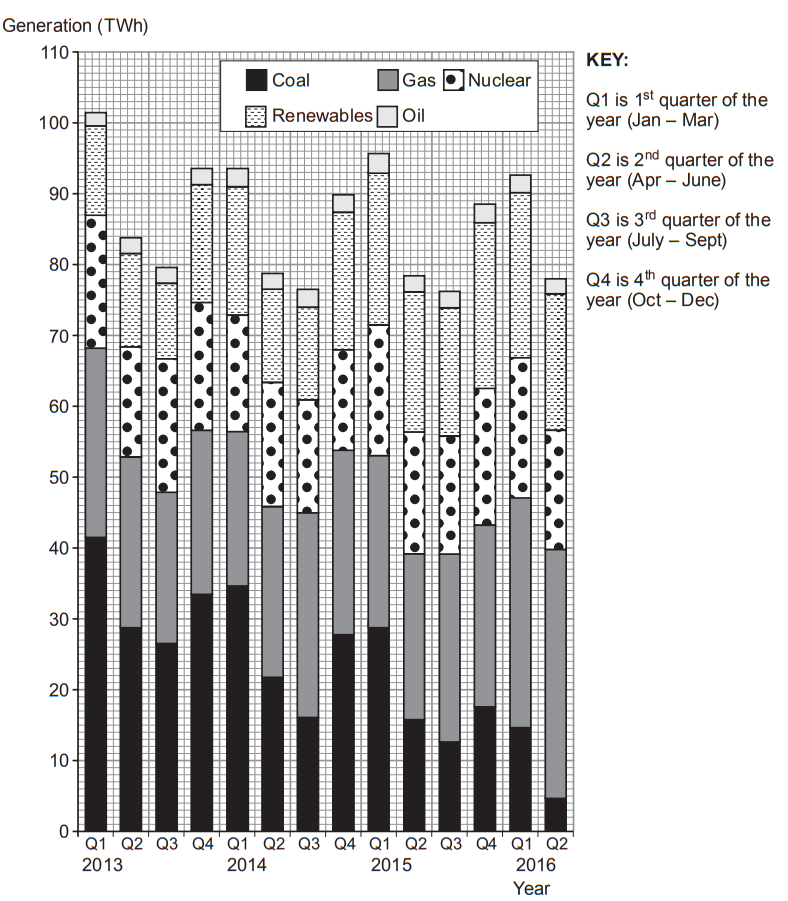
The graphs below show the CO₂ emissions from coal and natural gas power stations between the years 2007 and 2017.

Line graph of UK CO₂ emissions 2007–2017 showing coal falling steeply after 2013 and natural gas fluctuating but generally declining from 2010.

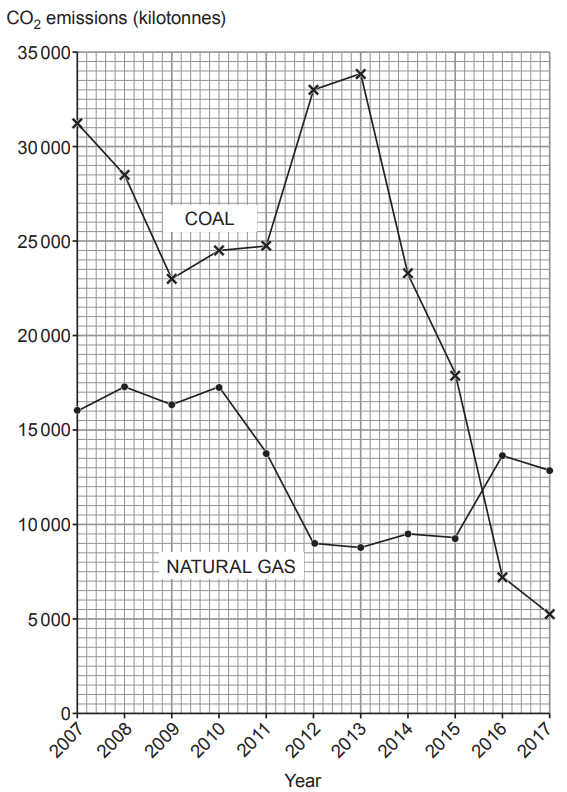
Look at the data for 2012. Calculate the difference in the emissions of CO₂ from coal and natural gas.

difference = .......... kilotonnes of CO₂

1b
Sme Calculator
1 mark

Between the years 2014 and 2015, the emission of CO₂ from coal fell by 5 500 kilotonnes.

State between which other years the emission of CO₂ from coal fell at the same rate.

Years .......... and ..........

1c
Sme Calculator
2 marks

State two benefits of reducing CO₂ in the atmosphere.

1d
Sme Calculator
4 marks

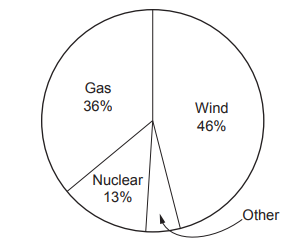
(i) Nuclear power stations provide up to 20% of the present UK demand for electricity.

Gas provides up to 50%.

One student, Seren, says that a graph for the CO₂ emissions from nuclear power stations would be the same shape as for gas but always lower.

Explain whether you agree with Seren.

[2]

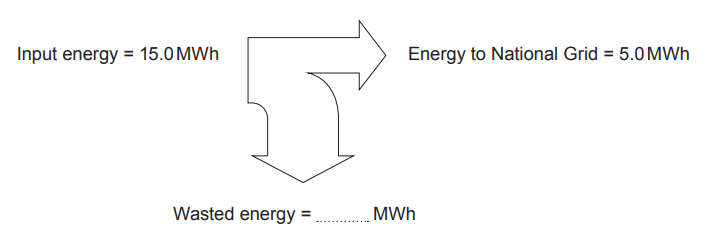
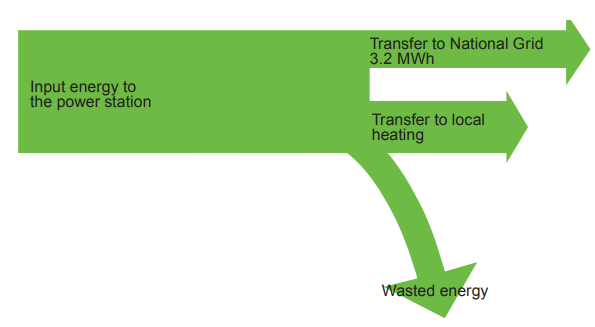
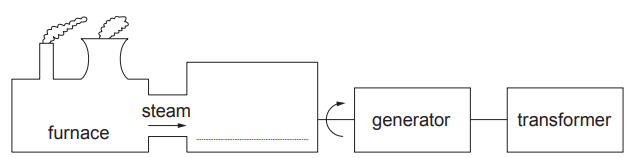
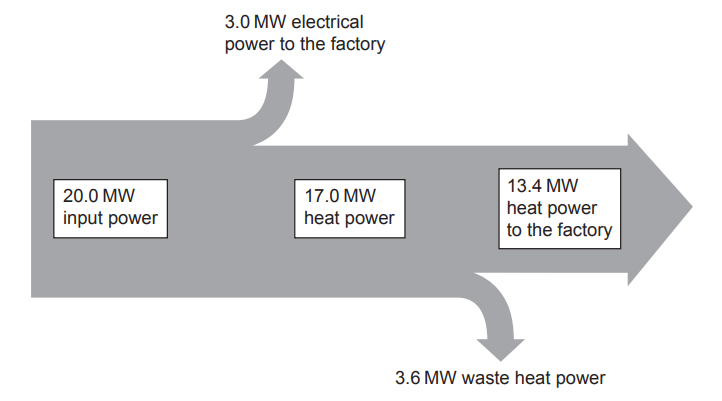
(ii) The Sankey diagram shows the energy input and output for a power station.

Flow diagram showing 500 units of energy splitting into useful electrical energy and 315 units of wasted energy, represented by separate arrows

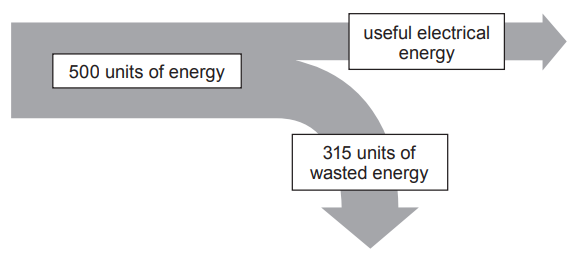
Seren looks at the diagram and calculates that the power station is 63% efficient.

Explain whether you agree with Seren.

2
Sme Calculator
6 marks

Describe the processes involved in generating electricity in a gas fired power station and explain how this electricity is supplied to consumers efficiently and safely through the National Grid.

3a
Sme Calculator
4 marks

The UK relies on a continuous supply of electricity which is provided by a variety of different power stations. Electricity can be generated in power stations and transmitted to users through the National Grid.

One concern with electricity production is the amount of greenhouse gases produced. Increased levels of these gases in our atmosphere is leading to climate change. Renewable energy resources produce less greenhouse gases but are not able to provide a constant supply of electricity.

(i) Draw a line from each method of electricity generation on the left to the most likely disadvantage on the right.

[2]

Matching exercise showing three power sources and three disadvantages: nuclear, wind and coal compared with high CO₂ emissions, high decommissioning cost and unreliability

(ii) The energy input to a nuclear power station is 20 MJ and its efficiency is 40%. The energy input to a coal-fired power station is 20 MJ and its useful output energy is 8 MJ.

A student suggests that the nuclear power station is more efficient than the coal-fired power station as it wastes less energy. Explain whether or not you agree with this conclusion.

[2]

3b
4 marks

The diagram shows a part of the National Grid.

Diagram of the National Grid showing transformers stepping voltage from a power station to pylons, heavy and light industry, town, village and farm.

(i) State one advantage of the National Grid.

[1]

(ii) Which of the transformers A, B, C, D, E or F is a step-up transformer?

[1]

(iii) Explain why step-up transformers are used in the National Grid.

[2]

4a
Sme Calculator
6 marks

Describe the advantages and disadvantages of generating electricity from:

coal

nuclear fuel

wind

4b
Sme Calculator
3 marks

The Sankey diagram below shows the energy transfer for a coal-fired power station.

Energy flow diagram showing 15.0 MWh input, 5.0 MWh arrow to National Grid, and a downward arrow labelled for calculating wasted energy in MWh.

(i) Complete the diagram opposite to show the wasted energy.

[1]

(ii) Use an equation % efficiency = \frac{\text{energy usefully transferred}}{\text{total energy supplied}} \times 100 to calculate the % efficiency of the power station.

[2]

% efficiency = ....................................... .

5a
Sme Calculator
3 marks

A combined heat and power station uses the wasted heat energy from a power station to provide heating for local homes and businesses. This increases the efficiency of the energy transfers.

Describe how electricity is produced in a fossil fuel power station.

5b
Sme Calculator
3 marks

The Sankey diagram shows the energy transfers for a combined heat and power station in a housing development. 75% of the input energy to the power station is transferred as useful energy, some to the National Grid and some to local heating. 40% of the useful energy produced by the power station is transferred to the National Grid. Helen estimates the input energy to the power station to be 20 MWh. Determine if this estimate is correct.

Sankey diagram of power station input energy splitting into National Grid output, local heating transfer, and a downward arrow showing wasted energy
6a
Sme Calculator
2 marks

The farmer wants the biogas generator to produce at least 3 000 kWh of electricity each week.

He collects 60 kg of dung from each cow per week.

1 kg of dung produces 0.095 kWh of electricity.

(i) Calculate how much electricity can be produced from each cow per week.

[1]

Electricity produced = .......... kWh

(ii) Calculate how many cows the farmer will need to produce the 3 000 kWh required.

[1]

Number of cows = ....................................... .

6b
Sme Calculator
2 marks

The table below shows the heating effect different greenhouse gases have on the atmosphere by comparing the global warming potential (GWP) values. If the GWP is twice as big the gas will cause twice the heating effect.

Greenhouse gas

GWP

carbon dioxide

1

methane

25

nitrous oxide

298

If it is left outside, cow dung releases methane into the atmosphere. In a biogas generator the methane is captured and burned releasing a similar amount of carbon dioxide (CO₂) into the atmosphere instead.

Alun suggests that biogas generators are bad for the environment because they release CO₂ into the atmosphere.

Explain whether you agree.

7a
Sme Calculator
7 marks

The biogas generator needs to produce 144 000 kWh of electricity per year.

The farmer owns 150 cows.

Each cow produces 200 kg of dung per week, but the farmer is only able to collect 60 kg of this.

Each 1 kg of dung produces 0.05 m³ of methane gas.

Each 1 m³ of methane gas input to the generator has an energy value of 5.3 kWh.

Each 1 m³ of methane gas when burned produces an output of 1.9 kWh of electricity.

(i) Use the information above and an equation efficiency = (useful output ÷ total input) × 100 to calculate the % efficiency of using methane gas to produce electricity.

[2]

% efficiency = ..........

(ii) The farmer thinks that there will be enough cow dung to produce the required amount of electricity (144 000 kWh).

Use the information opposite to explain whether the farmer is correct.

(1 year = 52 weeks)

[5]

7b
Sme Calculator
2 marks

When cow dung decomposes it produces methane gas.

When methane gas burns, it produces the greenhouse gases carbon dioxide and water vapour.

An online article contains this information about methane:

"While carbon dioxide is said to be the major contributor to the greenhouse effect, methane is roughly 30 times more effective as a heat-trapping gas."

Explain whether collecting cow dung to use in a biogas generator benefits efforts to reduce human impact on the greenhouse effect.

8a
Sme Calculator
3 marks

The diagram below shows the main parts of a thermal power station that uses coal to produce electricity.

Diagram of a power station showing furnace producing steam to drive a turbine, linked to a generator, then to a transformer for electricity output

(i) Complete the labelling on the diagram.

[1]

(ii) Draw one line from each part of the power station to the energy change it produces.

[2]

Diagram with boxes labelled furnace and generator, and boxes showing energy changes: kinetic to electrical, chemical to electrical, and chemical to thermal (heat).
8b
Sme Calculator
2 marks

Some energy values for this power station are listed below.

Input energy = 15 000 kJ

Heat energy = 10 500 kJ

Electrical energy = 4 500 kJ

Use this information and the equation below to calculate the % efficiency of the power station.

\% \text{ efficiency} = \frac{\text{energy [or power] usefully transferred}}{\text{total energy [or power] supplied}} \times 100

% efficiency = .......................................

9a
Sme Calculator
5 marks

Dinorwig is a pumped storage hydroelectric power station in North Wales.

Water is stored in an upper reservoir to be released when electricity is required.

Water is then pumped back to the upper reservoir.

Diagram of a pumped‑storage hydro plant showing water flowing between upper and lower reservoirs via a reversible pump‑turbine at a power house

At full capacity Dinorwig produces 1800 MW of power for 6 hours.

This is transferred to the National Grid via a step-up transformer.

(i) Explain why a step-up transformer is used.

[2]

(ii) Use an equation from the equations sheet to calculate the output current from the transformer at full capacity if the output voltage is 400 kV.

[3]

output current =...........................A

9b
Sme Calculator
2 marks

The graph shows how power demand for electricity varied throughout the day for one day in March.

Line graph of UK power demand in GW over 24 hours, rising from about 24 GW pre-dawn to peaks near 37 GW at midday and early evening, then falling.

Use the graph to state between which times water will be pumped back to the upper reservoir.

Explain your answer.

10a
Sme Calculator
2 marks

On one October day in the UK, most of our electricity was generated from wind, nuclear and gas as shown in the pie chart.

Pie chart of energy sources: Wind 46%, Gas 36%, Nuclear 13%, and a small remaining slice labelled Other.

(i) Calculate the total % of the electricity generation that came from wind, nuclear and gas.

[1]

total = .......... %

(ii) Calculate how much electricity was generated by other sources such as biomass, hydroelectric and solar.

[1]

electricity from other sources = .......... %

10b
Sme Calculator
3 marks

Match the name of the source on the left with a correct statement on the right.

Sources: Wind, Biomass, Nuclear, Gas
Statements: Produces radioactive waste, Depends on the weather, Uses the energy stored in plants, Is a fossil fuel
11a
6 marks

Consumers rely on a continuous supply of electricity from the National Grid system.

Describe how the National Grid provides a reliable supply of electricity as efficiently as possible.

11b
Sme Calculator
8 marks

Information about the National Grid is shown below.

[Graph: 'Typical summer and winter demands' — y-axis shows National Grid demand (MW) from 20 000 to 60 000, x-axis shows time of day (0000 to 2400). The Winter curve peaks at approximately 55 000–60 000 MW during evening hours; the Summer curve peaks at approximately 40 000–45 000 MW.]

Network size:

  • Maximum demand: 63 GW

  • Output capacity: 79.9 GW

  • Annual mean electrical energy used in the UK: 360 TWh

  • Length of 400 kV grid: 11 500 km

  • Length of 275 kV grid: 9 800 km

  • Length of 132 kV (or lower) grid: 5 250 km

Energy losses at maximum demand:

  • Heating in cables: 860 MW

  • Fixed losses: 260 MW

  • Sub-station transformer heating losses: 145 MW

  • Generator transformer heating losses: 155 MW

  • Total losses: 1 420 MW

(i) Use the information above and an equation from the formula sheet to calculate the % efficiency of the National Grid system at maximum demand.

[3]

% efficiency = ..........

(ii) Use the equation:

power = \frac{\text{energy transferred}}{\text{time}}

to calculate the annual mean power used in GW.

[3]

(1 year = 8 766 hours)

Mean power = .......... GW

(iii) Tick (✓) the boxes next to the two correct statements about the data above.

[2]

At maximum demand there is spare capacity of 16.9 GW box enclose space space space space space space end enclose

Maximum demand is equivalent to 85% of total capacity box enclose space space space space space space end enclose

The difference in minimum demand between summer and winter is approximately 10 000 MW box enclose space space space space space space end enclose

The times of peak demand in summer and winter are exactly the same box enclose space space space space space space end enclose

The difference in maximum demand between summer and winter is 15 000 MW box enclose space space space space space space end enclose

12a
Sme Calculator
7 marks

The Climate Change Act established a target for the UK to reduce its 1990 CO₂ emissions by at least 80% by 2050.

To ensure that regular progress is made, the Act also established a system of five-yearly carbon budgets.

The diagram below shows the sources of fuel used in the production of electrical energy between the first quarter of 2013 and the middle of 2016.

Stacked bar chart of UK electricity generation by quarter 2013–2016, showing coal falling sharply as gas, nuclear, renewables and oil vary in contribution

(i) Use the information in the diagram to describe trends in the use of individual fossil fuels and the total use of fossil fuels over the time shown.

[3]

(ii) The use of nuclear fuel for the production of electricity between Q1 2013 and Q1 2016 remained roughly constant. Suggest possible reasons for this.

[2]

(iii) Production of electricity from renewable sources remained roughly constant for Q2 2015 and Q2 2016. However, there was a reduction in the contribution by wind and a change in the contribution from solar power. Describe how the weather conditions were different in Q2 2016 compared to Q2 2015.

[2]

12b
Sme Calculator
4 marks

The first four carbon budgets, leading to 2027, have been set in law. The UK is currently in the third carbon budget period (2018–22). Meeting the fourth carbon budget (2023–27) will require that emissions be reduced by 50% on 1990 levels by 2027.

The 1990 levels of CO₂ emissions were 3 900 million tonnes.

Budget

CO₂ emission targets from all sources

% reduction below 1990 levels for all sources

1st 5 yr period achievement (2008–12)

Down to 3 018 million tonnes of CO₂ by the end of 2012

2nd 5 yr period target (2013–17)

Down to 2 782 million tonnes of CO₂ by the end of 2017

3rd carbon target (2018–22)

Down to 2 544 million tonnes of CO₂ by the end of 2022

4th carbon target (2023–27)

Down to 1 950 million tonnes of CO₂ by the end of 2027

50% by the end of 2027

(i) Calculate the targeted percentage drop in CO₂ emissions from all sources between 1990 and the end of 2022.

[2]

Percentage drop = ..........

(ii) Between 1990 and the end of 2022, the mean percentage drop in the use of fossil fuels in the production of electricity is expected to be 40%. Comment on the progress being made in achieving the government’s overall target for CO₂ emissions by 2027.

[2]

13a
Sme Calculator
3 marks

Volac is a dairy food manufacturing company based in Felinfach in West Wales.

Volac use a combined heat and power biomass power station.

It produces some of the electricity and heat for the factory.

The biomass power station burns wood produced locally.

Data about the biomass power station is given below.

Cost to build the biomass power station = £38 million (£38 000 000)

Estimated annual savings on energy bills = £3.75 million (£3 750 000)

(i) Calculate the expected payback time for the biomass power station.

[2]

payback time = .......... years

(ii) State one reason why this payback time may change.

[1]

13b
Sme Calculator
2 marks

Seren states that burning wood produces CO2 so it is harmful to the environment.

Explain whether you agree with Seren.

13c
Sme Calculator
3 marks

A Sankey diagram for the biomass power station is shown below.

Sankey diagram. Input arrow from the left: 20.0 MW. The arrow splits into two: an upper arrow of 17.0 MW heat power, which itself splits into 13.4 MW heat power to the factory and 3.6 MW waste heat power; and a lower arrow of 3.0 MW electrical power to the factory.

(i) Calculate the total useful output power from the biomass power station.

[1]

useful output power = .......... MW

(ii) Evan states that the biomass power station is only 15% efficient.

Explain whether you agree. Include a calculation.

[2]

14a
Sme Calculator
1 mark

Germany is building the world's first system in which wind turbines are combined with a hydroelectric pumped storage system.

State the main disadvantage of relying on energy from wind turbines.

14b
Sme Calculator
4 marks

When the output from the wind farm is not required by the German National Grid, the energy from the wind is used to pump water from a low level to a higher level.

The water at the higher level can then be used to generate electricity when required, just as in a conventional hydroelectric pumped storage system.

Two tall wind turbines rise above a dense green forest under a clear blue sky, highlighting renewable energy infrastructure within natural woodland

When generating, the power output from the hydroelectric pumped storage system is 16 MW.

The mean power used by homes in Germany was 0.43 kW in 2017 (which was the lowest on record up to that time).

(i) Suggest a possible reason why the 0.43 kW figure is lower than for any previous year.

[1]

(ii) Calculate the number of homes in Germany in 2017, that could be supplied using the power from the hydroelectric pumped storage system.

[3]

number of homes = ..........