Distance, Speed & Acceleration (WJEC GCSE Science (Double Award): Physics): Exam Questions

Exam code: 3430

2 hours13 questions
1a
Sme Calculator
3 marks

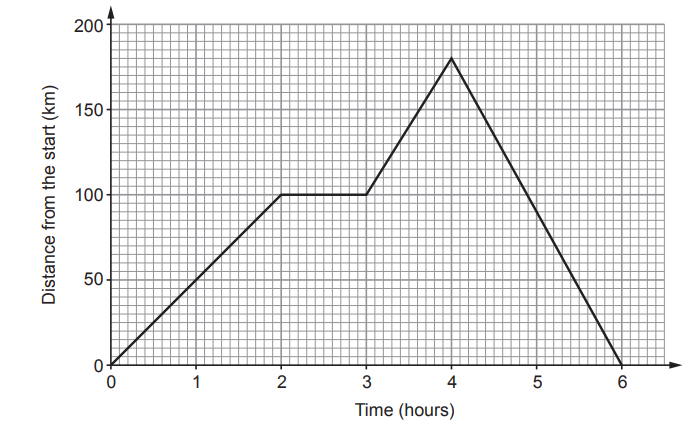
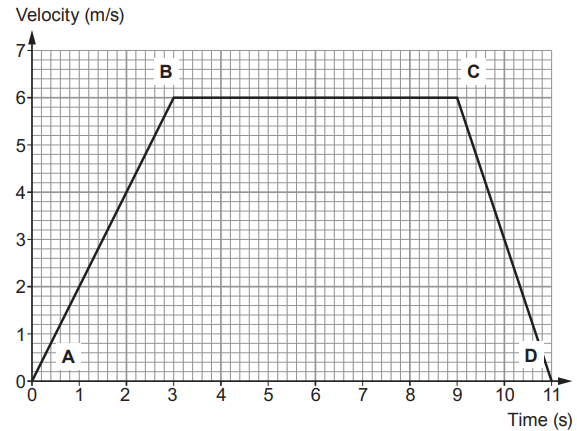
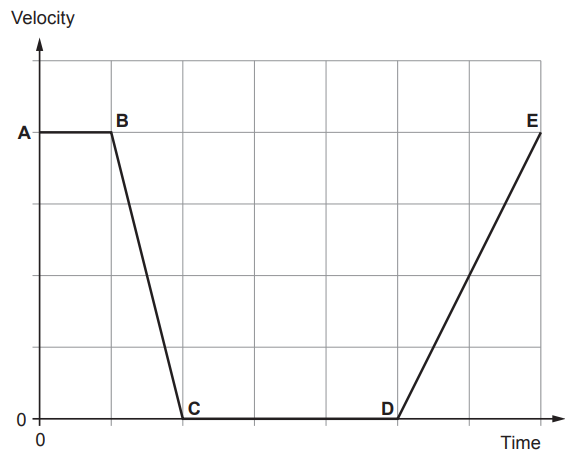
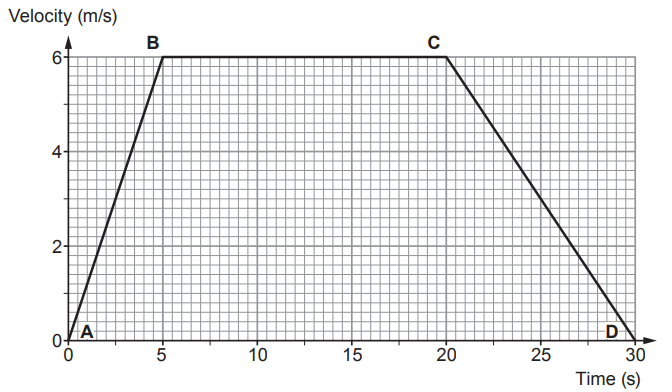
The graph below shows a journey by car.

Line graph of distance versus time: 0–2 hours rising to 100 km, flat from 2–3 hours, then rising from 100 to 300 km between 3 and 5 hours.

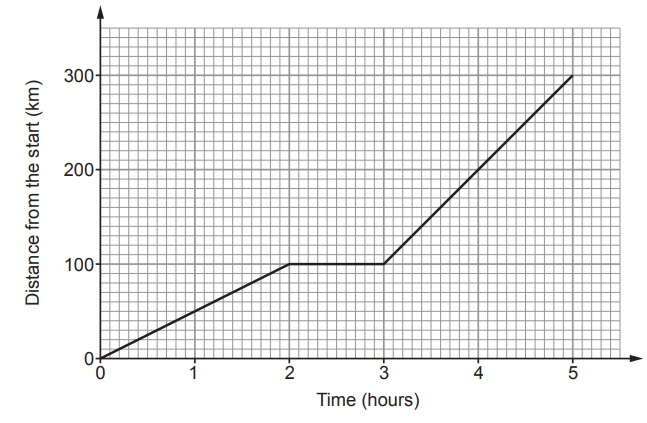
Use the graph to answer the following questions.

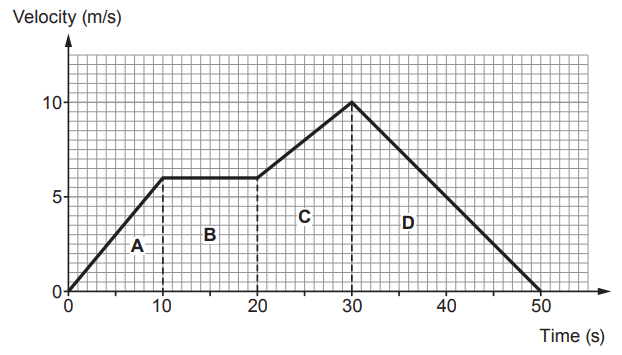
Use words from the box to complete the sentences below.

has a constant speed is not moving is speeding up is slowing down

Each phrase may be used once, more than once or not at all.

(i) In the first 2 hours, the car..............................................

(ii) Between 2 and 3 hours, the car.................................................

(iii) Between 3 and 5 hours, the car...................................................

1b
Sme Calculator
4 marks

(i) State the total distance travelled by the car.

[1]

distance =.................. km

(ii) Use your answer in (b)(i) and the equation:

\text{speed} = \frac{\text{distance}}{\text{time}}

to calculate the mean speed for the journey shown.

[3]

mean speed =........................ km/h

1c
Sme Calculator
2 marks

Ian says the car's speed was greater in the first 2 hours than between 3 and 5 hours.

Robert disagrees and says the car was moving faster between 3 and 5 hours.

Complete the following sentences.

During the first 2 hours, the car travelled............................ km.

Between 3 and 5 hours, the car travelled........................ km so I agree with ........................................

2a
Sme Calculator
3 marks

The velocity-time graph is for part of a bus journey.

Velocity–time graph showing piecewise linear motion from 0–50 s, rising to 6 m/s, constant, increasing to 11 m/s, then decreasing back to rest.

Use the information in the graph to answer the following questions.

Complete the table by placing one tick (✓) in each row to describe the motion in each region of the graph. Region A has been completed as an example.

Region of graph

Not moving

Constant velocity

Accelerating

Decelerating

A

B

C

D

2b
Sme Calculator
3 marks

Complete the following sentences using numbers from the box.

2

4

6

8

10

20

50

(i) The maximum velocity of the bus is .................................... m/s.

[1]

(ii) The change in velocity of the bus in region C is .................................... m/s.

[1]

(iii) The bus accelerates for a total time of .................................... s.

[1]

2c
Sme Calculator
3 marks

Use the equation:

\text{acceleration} = \frac{\text{change in velocity}}{\text{time}}

to calculate the acceleration in region A.

acceleration = .......... m/s²

2d
Sme Calculator
2 marks

The bus travelled 270 m in the 50 s shown.

Use the equation:

\text{mean speed} = \frac{\text{distance}}{\text{time}}

to calculate the mean speed of the bus.

mean speed = .......... m/s

3a
Sme Calculator
6 marks

The distance-time graph below shows a journey by car.

Line graph of distance from start against time: 0–2 hours rise to 100 km, flat 2–3 hours, rise to 180 km at 4 hours, then fall back to 0 km at 6 hours.

Describe the motion shown by using data from the graph.

Include a comparison of the speeds in each part of the journey.

3b
Sme Calculator
4 marks

Use the information in the distance-time graph from part (a) to answer the following questions.

(i) Calculate the total distance travelled during the journey.

[1]

distance =....................km

(ii) Use an equation from the formula sheet to calculate the mean speed of the journey.

[3]

mean speed =.............................. km/h

4a
Sme Calculator
2 marks

When a car stops the overall stopping distance is made up of two distances: the thinking distance and the braking distance.

Increasing speed increases both the thinking distance and the braking distance.

(i) State one factor, other than speed, which increases the thinking distance.

[1]

(ii) State one factor, other than speed, which increases the braking distance.

[1]

4b
Sme Calculator
3 marks

The diagram gives information about stopping distances at different speeds.

Diagram of stopping distances: at 20–60 mph showing thinking and braking distances in metres, with both distances increasing steeply as speed rises.

On a dangerous road, it is proposed to reduce the speed limit from 40 mph to 20 mph.

Bethan makes the following 3 suggestions.

  1. The thinking distance will halve.

  2. The braking distance will halve.

  3. The overall stopping distance will halve.

Explain whether you agree with each suggestion.

Include data from the diagram to support your answer.

5a
Sme Calculator
1 mark

A Segway vehicle can be used as a method of transport for a person.

The person leans forwards to make the Segway accelerate and leans backwards to slow it down. It is recommended that short training sessions are carried out before using the Segway on a busy pavement.

Diagram of a rider on a Segway: leaning backwards to slow down, standing upright to stay still, and leaning forwards to accelerate.

The velocity-time graph below relates to a short Segway training session that is carried out on a dry pavement. The person riding the Segway is instructed to carry out an emergency stop during the training.

Velocity–time graph: object accelerates from 0 to 6 m/s in 3 s, moves at 6 m/s until 9 s, then decelerates back to rest at 11 s, points A–D marked.

Use information on the graph opposite to answer the following questions.

Between which points, A to B, B to C or C to D, is the person leaning forward on the Segway?

5b
Sme Calculator
3 marks

Use the equation:

\text{acceleration} = \frac{\text{change in velocity}}{\text{time}}

to calculate the acceleration during the first 3 seconds and state its unit.

Acceleration = ..........

Unit = ..........

5c
Sme Calculator
2 marks

The combined mass of the person and the Segway is 110 kg.

Use the equation:

resultant force = mass × acceleration

to calculate the resultant force during the first 3 seconds.

[2]

Resultant force = .......... N

5d
Sme Calculator
2 marks

The reaction time of the person riding the Segway is 0.6 seconds.

Use the graph to determine the time, during the training session, at which the rider is asked to carry out the emergency stop.

Time = .......... s

5e
Sme Calculator
2 marks

Newton’s first law of motion states “An object will remain at rest, or move at constant velocity, if the forces acting on it are balanced”.

A student states that during the Segway training session balanced forces act on it for 11.0 s. Explain whether you agree with the student.

5f
Sme Calculator
2 marks

The graphs below show 3 possible training sessions carried out by the same Segway rider. Lucy says that Graph C would represent the emergency stop carried out on an icy pavement. Explain whether you agree with Lucy.

Velocity–time graph: object accelerates uniformly from 0 to 6 m/s in 3 s, moves at 6 m/s until 9 s, then decelerates uniformly to rest by 10 s
Velocity–time graph: object accelerates from 0 to 6 m/s in 3 s, moves at 6 m/s until 9 s, then decelerates uniformly to rest at 11 s.
Velocity–time graph: object accelerates from 0 to 6 m/s in 3 s, moves at constant 6 m/s until 9 s, then decelerates uniformly to rest at 13 s
6
Sme Calculator
6 marks

Since 2017, new bi-modal electric / diesel trains have been introduced to run between Swansea and London.

A velocity-time graph for one of these trains is shown below.

Velocity–time graph with constant velocity A–B, uniform deceleration B–C to rest, zero velocity C–D, then uniform acceleration D–E back to initial speed

Use information to compare the distances travelled and accelerations for the parts of the journey labelled AB, BC, CD and DE.

7a
Sme Calculator
1 mark

Two students carry out an experiment with a toy car and a 2.50 m long piece of track.

Diagram of a toy car at the top of a ramp labelled height, beside a digital stopwatch for timing the car’s motion down the slope

They investigate how changing the height at one end of the track affects the time taken for the toy car to travel down 2.50 m of the track. One student releases the car and the other uses a stopwatch to measure the time. They do this 3 times for each height.

Their results are shown in the table.

Height (cm)

Distance travelled (m)

Time (s)

Time (s) Result 1

Result 2

Result 3

Mean

10

2.50

4.0

4.1

4.0

4.0

20

2.50

2.9

3.3

3.1

3.1

30

2.50

2.5

2.7

2.4

2.5

40

2.50

2.1

2.0

2.3

2.1

50

2.50

2.0

1.8

1.9

1.9

Identify a controlled variable in the table.

7b
Sme Calculator
5 marks

(i) Use the equation:

\text{mean speed} = \frac{\text{distance travelled}}{\text{mean time}}

to calculate the mean speed of the toy car when the slope is set at a height of 10 cm.

[2]

Mean speed = .......... m/s

(ii)

I. Describe how the mean time changes as the height increases by 10 cm steps.

[2]

II. Describe how the mean speed changes as the height increases.

[1]

7c
Sme Calculator
4 marks

(i) One student says, “The most repeatable data is for a height of 50 cm”.

Explain why this statement is incorrect and write a similar correct statement.

[2]

(ii) Explain why using a timer connected to light gates positioned at the start and end of the 2.50 m track will improve the results.

[2]

8a
2 marks

Road traffic accidents occur when a vehicle is unable to stop safely. The overall stopping distance can be worked out using the following equation:

overall stopping distance = thinking distance + braking distance

The table shows stopping distances from the Highway Code.

Speed (mph)

20

30

40

50

60

70

Thinking distance (m)

6

9

12

15

..........

21

Braking distance (m)

6

14

24

38

56

75

Overall stopping distance (m)

12

23

36

53

..........

96

Complete the table.

8b
4 marks

(i) Describe how worn tyres affect the following distances.

[2]

Thinking distance . ................................................................................

Braking distance ..................................................................................

(ii) Describe how a driver using a mobile phone affects the following distances.

[2]

Thinking distance . ................................................................................

Braking distance ..................................................................................

9a
Sme Calculator
3 marks

The total stopping distance for a moving car is given by the equation below:

total stopping distance = thinking distance + braking distance

These distances may be affected by a number of factors.

Three of these factors are given in the table below.

Put a tick (✓) or a cross (X) in each box below to show whether the distance is affected by each factor.

The first row has been done for you.

Factor

Thinking distance

Braking distance

Total stopping distance

Worn tyres

X

Drunk driver

Wet road

9b
Sme Calculator
2 marks

At a speed of 13 m/s, the thinking distance of an alert driver is 9.1 m.

Use the equation:

time = \frac{\text{distance}}{\text{speed}}

to calculate the thinking time.

Thinking time = .......... s

9c
Sme Calculator
2 marks

A driver of a car travelling at 13 m/s sees traffic lights 30 m ahead when the lights turn to red.

Diagram of a car moving at 13 m/s towards traffic lights and a pedestrian crossing 30 m ahead on a straight road

The thinking distance = 9.1 m and the braking distance = 13.9 m at this speed.

Use the equation:

total stopping distance = thinking distance + braking distance

to explain whether the car would be able to stop before reaching the crossing.

10
Sme Calculator
5 marks

One type of efficient car is a hybrid electric vehicle, which has both a conventional fuel engine and an electric motor.

Data about a hybrid electric / petrol car is given below.

Minimum time to accelerate from 0 to 30 m/s

12 s

Mass of car

1 100 kg

Mean CO₂ emissions

90 g/km

Mean fuel economy

32 km/litre

The car travels 160 km per week.

(i) Use data from the table and an equation a equals fraction numerator capital delta v over denominator t end fraction to calculate the maximum acceleration of the car.

[3]

Acceleration = .......... m/s²

(ii) Use an equation F = ma to calculate the size of the resultant force required to produce this acceleration.

[2]

Resultant force = .......... N

11a
Sme Calculator
2 marks

Manufacturers test new cars on a level track. In order to find out how long it takes them to accelerate to 27 m/s (60 mph), the cars are driven in a straight line at maximum power and the speed recorded. Data for one car is shown on the velocity-time graph below.

Velocity–time graph showing velocity rising steeply from 0 to 10 m/s, then levelling off towards 27 m/s between 0 and 12 seconds, indicating decreasing acceleration

Describe how the acceleration changes during the 12 s shown.

11b
Sme Calculator
3 marks

By drawing a suitable tangent on the graph above, and using:

acceleration = gradient of a velocity-time graph

calculate the acceleration of the car at 5 s. Give a unit with your answer.

11c
Sme Calculator
2 marks

Use an equation to estimate the distance travelled by the car in the first 3 s.

Distance = ................................................ m

11d
2 marks

Another car of the same power and mass but with a more streamlined shape is tested.

Sketch on the grid below the velocity-time graph for this car.

Blank velocity–time graph with gridlines, y‑axis from 0 to 35 m/s and x‑axis from 0 to 12 seconds, ready for plotting motion data
12
Sme Calculator
6 marks

The velocity-time graph shows the motion of a car for a time of 30 s.

Velocity–time graph: object accelerates from 0 to 6 m/s in 5 s, moves at 6 m/s until 20 s, then decelerates uniformly back to rest at 30 s

Use data from the graph to describe the motion of the car.

13
Sme Calculator
8 marks

Students investigate the terminal speed of falling paper cake cases.

Diagram of a cake case drop experiment showing a pointer, falling cake case(s), a vertical ruler measuring distance, and the floor beneath.

The table shows results from the investigation.

Number of cake cases

Distance (m)

Mean time taken to fall 1.50 m (s)

Terminal speed (m/s)

0

0

0

1

1.50

0.90

1.7

2

1.50

0.68

2.2

3

1.50

0.60

..........

4

1.50

0.56

2.7

(i) Complete the table using an equation to find the value of the missing terminal speed.

[2]

(ii) Plot the data in the table on the grid below and draw a suitable line.

[3]

Blank grid graph with x-axis labelled ‘Number of cake cases’ from 0–4 and y-axis labelled ‘Terminal speed (m/s)’ from 0–3, ready for plotting data

(iii) One student suggests that doubling the number of cake cases reduces the time to fall by a half.

Explain whether the results support this suggestion.

[3]