Components in Series & Parallel Circuits (Edexcel IGCSE Science (Double Award) (Modular): Physics Unit 1): Exam Questions

Exam code: 4XSD1

3 hours19 questions
1a
1 mark

The diagram shows an I−V graph for an electrical component.

Current-potential difference graph with I on the vertical axis and V on the horizontal axis, both axes extending in positive and negative directions. A single S-shaped curve passes through the origin, rising most steeply near the origin and flattening towards the top right and bottom left.

The component which produces this variation of current with potential difference is

  • a fixed resistor

  • a filament lamp

  • a diode

  • a fuse

1b
1 mark

The diagram shows an I−V graph for an electrical component.

Current-potential difference graph with I on the vertical axis and V on the horizontal axis, both axes extending in positive and negative directions. Two straight lines pass through the origin, one steeper than the other, each extending into the top right and the bottom left.

The component which produces this variation of current with potential difference is

  • a fixed resistor

  • a filament lamp

  • a diode

  • a fuse

1c
1 mark

The diagram shows an I−V graph for an electrical component.

Current-potential difference graph with I on the vertical axis and V on the horizontal axis, both axes extending in positive and negative directions. The line lies along the horizontal axis for all negative potential differences and for small positive potential differences, then curves sharply upwards as the potential difference increases.

The component which produces this variation of current with potential difference is

  • a fixed resistor

  • a filament lamp

  • a diode

  • a fuse

2a
1 mark

The diagram shows a lighting circuit in a house.

Circuit diagram of a house lighting circuit. A 230 V supply is connected in a loop. Component X is drawn as a small rectangle in the top wire, between the supply and the branches. Four branches are connected in parallel across the supply, and each branch contains an open switch above a lamp. The lamp in the right-hand branch is labelled lamp Y.

Component X is

  • a double insulated wire

  • an earth connection

  • a fuse

  • a switch

2b
1 mark

Most lamps at home have their own switch. 

This is because the lamps are connected

  • in parallel

  • in series

  • to a fuse

  • to an earth wire

2c
2 marks

Place ticks next to the two advantages of series circuits.

They are more difficult to install, repair and maintain


They are the easiest type of circuit to install, repair and maintain


They do not overheat easily because they share the same current


Adding too many lamps may cause overheating


2d
2 marks

Place ticks next to the two advantages of parallel circuits.

If one lamp fails, other lamps will still function


If one lamp fails, other lamps will not function


Different lamps can have different brightnesses and not affect the others


Not all lamps have the same brightness


3a
1 mark

The diagram shows a series circuit.

A single-loop series circuit. A cell sits at the top of the loop. Going clockwise from the cell, ammeter A3 is on the right-hand side, then resistor R2, ammeter A2 and resistor R1 along the bottom, then ammeter A1 on the left-hand side returning to the cell.

Which of the following shows the correct relationship between the readings on ammeters A1, A2 and A3?

  • A1 = A2 + A3

  • A1 = A2 = A3

  • A1 = A2 − A3

  • A1 = A3 − A2

3b
3 marks

Complete the sentences to explain how a fuse protects a circuit. 

larger than     smaller than     melts    falls off    starts    stops    overheating    overexciting

When the current becomes ........................... the value of the fuse, the fuse wire ........................... . This ........................... the flow of current in the circuit.

This is an important safety feature in a circuit to prevent the wires in the circuit from ........................... .

4a
1 mark

A student investigates how the resistance of a thermistor varies with temperature.

Draw the circuit symbol for a thermistor.

4b
3 marks

A light-dependent resistor (LDR) can be used as a sensor to detect light intensity.

Sketch a graph on the axes below to show how the resistance of an LDR varies as the light intensity changes.

Blank axes with resistance on the vertical axis and light intensity on the horizontal axis, the origin labelled zero and no scale marked on either axis
5a
1 mark

A student has some LEDs connected in a circuit. They emit light of different colours.

When an LED is on it shows that

  • there must be alternating current in the circuit

  • there must be a current in the circuit

  • there is a fault in the LED

  • a fuse has blown

5b
1 mark

The diagram shows a circuit containing five LEDs connected in parallel.

Circuit diagram of a battery connected to five branches in parallel, each branch containing a closed switch and a light-emitting diode. The current labelled in each branch, from left to right, is 0.26 A, 0.43 A, 0.17 A, 0.26 A and 0.26 A. Point X is marked on the lower wire between the battery and the first branch.

What is the current at X?

  • 0.17 A

  • 0.26 A

  • 0.43 A

  • 1.38 A

5c
3 marks

(i) State the equation linking power, current and voltage.

[1]

(ii) Calculate the power of the LEDs. The voltage of the battery is 12 V.

[2]

Power = .................... W

5d
4 marks

(i) State the equation linking power, energy transferred and time.

[1]

(ii) Calculate the amount of energy transferred by the LEDs in 320 seconds.

[3]

Energy transferred = .......................... J

1a
1 mark

A student is given an unknown electrical component, X. He uses a circuit to investigate how the current in X varies with the voltage across it.

Which of these circuits is correct for his investigation?

Four circuit diagrams labelled A, B, C and D. In each one a power supply with a plus terminal and a minus terminal is at the top, a variable resistor is in the left-hand side of the loop, and an unknown component labelled X is in the lower horizontal wire. In A, an ammeter is in the right-hand side of the main loop and a voltmeter is in a branch connected across X. In B, a voltmeter is in the right-hand side of the main loop and an ammeter is in a branch connected across X. In C, the main loop carries no meter, and a voltmeter and an ammeter are joined one after the other in a single branch connected across X. In D, there is no branch across X and both the ammeter and the voltmeter are in the main loop, in series with X.
  • A

  • B

  • C

  • D

1b
3 marks

This diagram shows another circuit the student is investigating.

A circuit diagram. A lamp is in the upper wire. At the left-hand side, two open terminals joined by a curved line represent the power supply. Below the supply, a two-way switch labelled S1 has its common contact wired to the supply and can be moved to touch either of two contacts, W above and Z below. At the right-hand side, a two-way switch labelled S2 has its common contact wired up to the lamp and can be moved to touch either of two contacts, X above and Y below. A horizontal wire joins W to X, and a second horizontal wire joins Z to Y. As drawn, S1 is touching W and S2 is touching Y.

(i) Complete the table by putting a tick (✓) in the box if the lamp is lit and a cross (х) in the box if the lamp is not lit.

[2]

S1 position

S2 position

Lamp lit (✓ or х)

W

X

W

Y

Z

X

Z

Y

(ii) Suggest where this circuit would be useful in a house.

[1]

2a
4 marks

A student uses voltmeter and ammeter readings to find the resistance at different temperatures. One set of readings is show below.

Table of readings with three columns headed temperature in °C, voltmeter reading in V and ammeter reading in mA. The single row of data gives a temperature of 80, a voltmeter reading of 13.2 and an ammeter reading of 2.60.

(i) State the equation linking voltage, current and resistance.

[1]

(ii) Show that the resistance of the thermistor at 80 °C is about 5000 Ω.

[3]

2b
5 marks

A student uses voltmeter and ammeter readings to find the resistance at different temperatures for two different components, A and B.

The graphs show the results.

Two line graphs drawn one above the other. Each has resistance in Ω on the vertical axis, scaled 0 to 35 000, and temperature in °C on the horizontal axis, scaled 0 to 100. The upper graph is headed Component A and has six plotted crosses joined by a smooth curve that falls steeply from about 34 000 Ω at 0 °C to about 16 000 Ω at 20 °C and about 8800 Ω at 40 °C, then flattens through about 5900 Ω at 60 °C and about 4800 Ω at 80 °C to about 4300 Ω at 100 °C. The lower graph is headed Component B and has eleven plotted crosses joined by a smooth curve that stays almost flat at about 800 Ω from 0 °C to 50 °C, then rises with increasing steepness through about 1500 Ω at 60 °C, about 2500 Ω at 70 °C, about 4800 Ω at 80 °C and about 10 000 Ω at 90 °C to about 33 000 Ω at 100 °C.

Compare the results for component A and component B.

3a
2 marks

An LED needs a minimum voltage to make it emit light.

The student investigates this minimum voltage using the circuit shown.

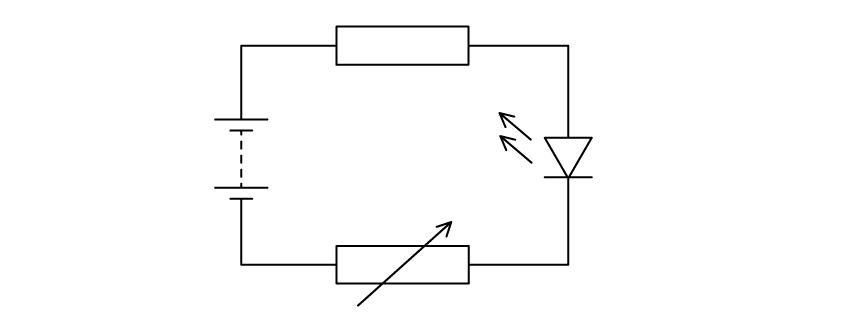
A circuit diagram drawn as a single loop. On the left is a battery of two cells. In the top branch is a fixed resistor. In the bottom branch is a variable resistor, shown as a rectangle with a diagonal arrow through it. On the right is a light-emitting diode, shown as a triangle pointing towards a bar with two arrows drawn away from it to represent emitted light.

The student uses a voltmeter to measure the voltage across the LED.

Add this voltmeter to the circuit diagram.

3b
4 marks

The student gradually increases the voltage across the LED and records the minimum voltage at which the LED emits light. The results for some different LEDs are shown in the table.

A table with two columns, headed colour of light from LED and minimum voltage in V. The rows are red, 1.7; blue, 3.6; yellow, 2.1; orange, 2.0; green, 3.0.

Display the results of the student's investigation on the grid.

A blank square grid of graph paper, wider than it is tall, with no axes drawn, no scale and no labels.
3c
2 marks

The student concludes:

A photograph of a student beside a speech bubble which reads: the minimum voltage depends on the wavelength of the light emitted.

Evaluate the student's conclusion.

4a
4 marks

The graph shows how current and voltage vary for a filament lamp.

Graph with current on the vertical axis and voltage on the horizontal axis, both axes extending in positive and negative directions from the origin. The line is a smooth S-shaped curve passing through the origin, steepest close to the origin and becoming shallower towards each end. No scale values are marked on either axis.

Draw a circuit diagram to show how you should connect the equipment needed to make the measurements needed to plot the graph.

4b
4 marks

The resistance of the filament lamp changes as the voltage is increased.

(i) How can you tell this from the graph?

[1]

(ii) Explain these changes in resistance.

[3]

5a
6 marks

A student investigates how the resistance of a piece of wire changes with voltage across the wire.

The student connects an ammeter, a voltmeter, a battery, a variable resistor and the wire in an electrical circuit.

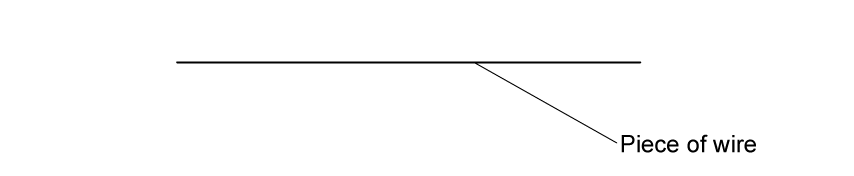
(i) Complete the diagram to show how the student should connect the circuit.

[3]

A large blank space with one short horizontal line drawn near the bottom. A leader line from the right-hand end of that line points to the label piece of wire. Nothing else is drawn.

(ii) Describe what she should do to obtain a set of results for her investigation.

[3]

5b
1 mark

The student keeps the temperature of the wire constant during the investigation.

Suggest why she does this.

[1]

5c
2 marks

When the student looks at her results, she notices that the voltage across the wire is directly proportion to the current in it.

(i) State the relationship linking voltage, current and resistance.

[1]

(ii) The student calculates the resistance and then plots a graph of resistance against voltage.

On the axes, sketch the shape of her graph.

[1]

A set of empty graph axes carrying no scales and no plotted line. The vertical axis is labelled resistance and the horizontal axis is labelled voltage.
6a
3 marks

A student plans to measure the resistance of a piece of wire. He sets up this circuit and finds that it does not work.

Circuit diagram drawn as a single rectangular loop. The top side carries two cells placed one after the other, each drawn with its long positive plate facing the other cell. The left side carries a variable resistor, shown as a rectangle with a diagonal arrow through it. The right side carries a circular meter labelled V, joined into the loop itself. The bottom side carries a thick horizontal line labelled piece of wire, with a dot at each end, and a separate branch runs from one dot to the other carrying a circular meter labelled A. No other components are shown.

Identify the three errors in the student’s circuit.

6b
5 marks

The student uses a correct circuit to obtain these results.

Results table with two columns, headed Current in amps and Voltage in volts. The six rows of readings are: current 0.00 with voltage 0.0; current 0.24 with voltage 1.5; current 0.71 with voltage 4.5; current 0.89 with voltage 6.0; current 1.00 with voltage 7.5; current 1.10 with voltage 9.0.

Plot a graph to show the relationship between current and voltage for the wire.

A blank square sheet of graph paper, ruled with fine small squares grouped into larger squares by heavier lines. There are no axes, no scales and no labels.
6c
2 marks

(i)

Find the current when the voltage is 2.5 V.

[1]

(ii)

Suggest why the line on the graph curves.

[1]

6d
4 marks

Describe what else the student should do to find an accurate value for the resistance of the piece of wire at a constant temperature.

7a
4 marks

A student is given an unknown electrical component, X. He uses a circuit to investigate how the current in X varies with the voltage across it.

The table shows the student’s results.

Voltage across X (V)

Current in X (A)

0

0

3.0

0.5

14.5

2.3

19.5

2.9

25.0

3.2

29.5

3.3

Plot a graph of these results and draw a curve of best fit.

Blank graph grid of fine squares with darker lines every centimetre, ready for plotting. The vertical axis is labelled current in A and the horizontal axis is labelled voltage in V. Neither axis carries any numbers or scale.
7b
5 marks

(i) State the equation linking voltage, current and resistance.

[1]

(ii) Calculate the resistance of component X when the voltage across it is 10.0 V. Give the unit.

[4]

Resistance = ................................ unit ......................

7c
5 marks

(i) Describe the pattern shown by the graph from part (a).

[3]

(ii) Suggest a conclusion for the investigation

[2]

8a
4 marks

A student investigates how the current in component X varies with the voltage across it. The diagram shows the circuit used for the investigation.

Circuit featuring a cell, ammeter, variable resistor, and component X all in series, with a voltmeter across X.

The student uses the variable resistor to vary the voltage across component X. The table gives the student's results.

Voltage (V)

Current (A)

1.0

0.21

2.0

0.43

3.0

0.64

4.0

0.80

5.0

0.88

6.0

0.94

(i) Plot a graph of the student's results.

[3]

Blank grid for plotting a graph. The vertical axis is labelled current in A and the horizontal axis is labelled potential difference in V. Neither axis carries a numerical scale. The grid is six large squares wide and five large squares tall, and each large square is divided into ten by ten small squares.

(ii) Draw the curve of best fit.

[1]

8b
2 marks

(i) Give the name of component X.

[1]

(ii) Draw the circuit symbol for this component.

[1]

8c
8 marks

(i) State the formula linking resistance, voltage and current.

[1]

(ii) Describe how resistance changes as the current through this component changes. Use data from the table to support this.

[3]

(iii) When the voltmeter has a reading of 4.0 V, the variable resistor has a resistance of 5.0 Ω.

Calculate the voltage across the cell.

[4]

9
1 mark

The student shines light on the LDR through a circular hole in a piece of black card, as shown in the diagram. The student repeats the experiment using cards with holes of different diameter. The distance from the card to the LDR is always 5 cm. The student varies the current in the circuit by adjusting the variable resistor.

Side view of the apparatus. A light source lies flat along the base. Two pieces of black card lie flat on the light source with a small gap between them. Directly above the gap an LDR is mounted at the top of a tall vertical shielding, and two wires to circuit lead upwards from the LDR. Labels in the diagram read wires to circuit, LDR, shielding, light source, black card and hole in black card. On the right is a face-on view of the black card, a dark square with one small circular hole at its centre.

The independent variable in this experiment is:

  • the brightness of the light source

  • the diameter of the hole

  • the distance from the card to the LDR

  • the resistance of the LDR

1
1 mark

A student uses a circuit that contains an ammeter, a battery, a light emitting diode (LED) and a voltmeter.

He notices there is no current in the diode when the battery is reversed.

He replaces the battery with an a.c. supply.

Which graph shows how the current in the diode varies with time?

Four current against time graphs labelled A, B, C and D. Graph A shows a horizontal line at a constant positive current. Graph B shows a straight line falling steadily from a positive current, crossing zero and continuing below the axis. Graph C shows a sine wave alternating equally above and below zero for four complete cycles. Graph D shows four positive humps above the zero line, each separated by a gap along the time axis where the current is zero.
  • A

  • B

  • C

  • D

2a
8 marks

A student uses this apparatus to investigate how the resistance of a thermistor changes with temperature.

Apparatus for the investigation. A beaker of liquid stands on a gauze and tripod above a Bunsen burner. A thermometer graduated from 0 to 100 dips into the liquid next to a small component labelled thermistor. Leads run from the thermistor to a meter reading 1.2 mA and on to a box labelled variable voltage supply carrying a dial numbered 0 to 11, then back to the thermistor.

(i) Draw a circuit diagram for this investigation.

[2]

(ii) The student wants to measure the voltage across the thermistor. On your diagram, add a symbol to show how she should connect the voltmeter to the circuit.

[1]

(iii) Explain how the student can use the apparatus to investigate how the resistance of the thermistor varies with temperature between 0 °C and 100 °C.

[5]

2b
2 marks

The graph shows the student’s results.

A graph of resistance in kΩ on the vertical axis, scaled 0.0 to 6.0, against temperature in °C on the horizontal axis, scaled 0 to 100. Nine crosses are plotted: 4.65 kΩ at 20 °C, 4.3 kΩ at 30 °C, 2.8 kΩ at 40 °C, 2.1 kΩ at 50 °C, 1.7 kΩ at 60 °C, 1.45 kΩ at 70 °C, 1.05 kΩ at 80 °C, 0.7 kΩ at 90 °C and 0.5 kΩ at 100 °C. Line A is a curve beginning near 5.85 kΩ at 10 °C that falls steeply at first and then flattens, ending near 0.5 kΩ at 100 °C. Line B is a straight line beginning near 4.75 kΩ at 10 °C and falling to zero at 100 °C. The two lines cross at about 38 °C.

Two students discuss the line of best fit for this graph. One student thinks it is the curved line A. The other student thinks that it is the straight line B.

(i) Suggest which line is better, giving a reason for your choice.

[1]

(ii) Suggest why measuring the resistance of the thermistor at 10 °C could help to decide which line is better.

[1]

2c
3 marks

These graphs show the voltage (V) changes with the current (I) for three components.

Three graphs labelled J, K and L. Each has voltage V on the vertical axis and current I on the horizontal axis, with an origin marked 0 and no numbered scales. Graph J is a curve starting at the origin that rises very gently at first and then more and more steeply, curving upwards. Graph K rises almost vertically from the origin, then bends sharply and flattens off, running close to horizontal at the right-hand end. Graph L is a straight line rising from the origin at a constant gradient.

The components are a metal wire at a constant temperature, a diode and a filament lamp.

Which letter represents the correct graph for each component?

(i) Metal wire at constant temperature

[1]

(ii) Diode

[1]

(iii) Filament lamp

[1]

3a
2 marks

A student uses the following apparatus to investigate how the resistance of a thermistor changes with temperature.

Photograph of labelled laboratory apparatus. A beaker of water stands on a tripod and gauze above a Bunsen burner. A thermometer is held with its bulb in the water. A thermistor connected to an electrical circuit also sits in the water, its leads running up to a clamp stand above the beaker.

Explain why the student places the thermistor in a beaker of water.

3b
6 marks

The table shows the student's results.

Table of the student's results with two columns, temperature in °C and resistance in Ω. The rows read: 0 and 10 000; 10 and 7 060; 20 and 5 000; 40 and 2 670; 60 and 2 350; 80 and 1 080; 100 and 609.

(i) Plot a graph of these results on the grid.

[4]

(ii) Circle the anomalous point on the graph.

[1]

(iii) Draw a curve of best fit.

[1]

Blank sheet of graph paper for plotting the results, ruled as large squares each divided into a five by five grid of small squares.
3c
2 marks

(i) Why is the maximum temperature in the student’s investigation limited to 100 °C?

[1]

(ii) Suggest how the student obtains readings below room temperature.

[1]

4a
4 marks

The resistance of a Light Dependent Resistor (LDR) is affected by the amount of light that shines on it.

A student investigates this relationship using the circuit shown.

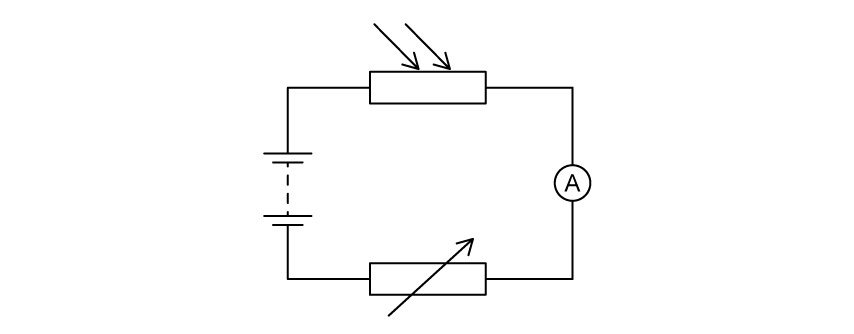
A series circuit drawn as a rectangle. A battery of two cells is on the left-hand side. Along the top is a light dependent resistor, drawn as a rectangle with two arrows pointing towards it. An ammeter, drawn as a circle containing the letter A, is on the right-hand side. Along the bottom is a variable resistor, drawn as a rectangle with a diagonal arrow through it. No voltmeter is present.

(i) The student uses a voltmeter to measure the voltage across the LDR. Add this voltmeter to the circuit diagram.

[2]

(ii) Explain how the student can work out the resistance of the LDR using this circuit.

[2]

4b
1 mark

The student shines light on the LDR through a circular hole in a piece of black card, as shown in the diagram. The student repeats the experiment using cards with holes of different diameter. The distance from the card to the LDR is always 5 cm. The student varies the current in the circuit by adjusting the variable resistor.

A side view of the apparatus. A light source lies flat along the bottom. A piece of black card rests on top of the light source, with a small circular hole in it. A tall shielding enclosure stands over the hole, and the light dependent resistor is mounted at the top of the enclosure, with wires to circuit leading away from it. To the right is an enlarged view of the black card seen face on, a dark square with a single small white circular hole near its centre.

The photograph shows how the student places a metal ruler to measure the diameter of one of the holes.

A photograph of a metal ruler lying on a piece of black card. The graduated edge of the ruler runs horizontally across the top, numbered 40, 50, 60, 70 and 80 with millimetre divisions between. A pale circular hole in the card sits below the ruler, with its centre roughly beneath the 63 mark. The ruler does not touch or cross the hole.

Suggest how the student can improve this technique while still using the same ruler.

4c
7 marks

The table shows the student’s results.

A results table with two columns, headed Diameter of hole in mm and Resistance of LDR in ohms. The rows are: 8 and 1050; 10 and 890; 15 and 640; 20 and 490; 23 and 430; 30 and 340.

(i) Plot the student’s results on the grid.

A blank square grid of graph paper, with fine squares grouped into larger blocks. No axes, scales or labels are drawn.

[4]

(ii) Draw a curve of best fit on the graph.

[1]

(iii) Describe the relationship between the resistance of the LDR and the diameter of the hole.

[2]

5a
4 marks

A student investigates the current in a thermistor at different temperatures using the circuit shown in the diagram.

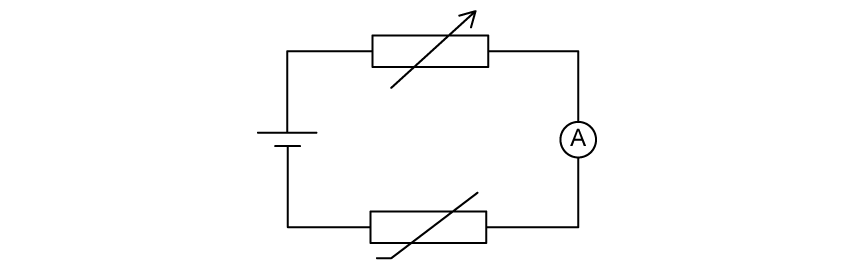
Circuit diagram of a single loop containing a cell on the left, a variable resistor along the top, an ammeter labelled A on the right and a thermistor along the bottom

The student uses a voltmeter to check that the voltage across the thermistor stays constant throughout the investigation.

(i) Add this voltmeter to the circuit diagram.

[2]

(ii) Give a reason for keeping the voltage across the thermistor constant.

[1]

(iii) Give a reason for including the variable resistor in the circuit.

[1]

5b
3 marks

The student increases the temperature of the thermistor and records the current and temperature readings. The graph shows the student's results.

Graph of current in mA on the vertical axis, scaled 0 to 100, against temperature in °C on the horizontal axis, scaled 0 to 100. Six crosses are plotted, at 0 °C and 6 mA, 20 °C and 14 mA, 40 °C and 30 mA, 60 °C and 52 mA, 80 °C and 78 mA, and 100 °C and 99 mA. A smooth curve is drawn through them, starting above the origin and rising with an increasing gradient

The student plans the use his circuit to make an electronic thermometer, He notices that both the scales on the graph go up to 100.

He thinks that the current reading, measured in mA, gives a direct indication of the temperature measured in °C. He labels the ammeter's scale 'temperature in °C'.

Give three reasons why the student's electronic thermometer is unlikely to show the correct temperature.

You may use information from the circuit and the graph to support your answer.