Density & Pressure (Edexcel IGCSE Science (Double Award) (Modular): Physics Unit 1): Exam Questions

Exam code: 4XSD1

2 hours18 questions
1
1 mark

The volume of a piece of brass is 16.3 cm3.

A student measures its mass using an electronic balance.

The mass of the brass is 138 g. 

The student notices that the electronic balance has a zero error, so it shows mass readings that are all slightly too small.

Which sentence best describes the measured density?

  • Incorrect and slightly too large 

  • Incorrect and slightly too small 

  • Correct because the student used three significant figures 

  • Correct because the mass of the block is more than zero 

2
1 mark

Which is a correct unit for density?

  • g / cm

  • kg / cm

  • g / cm2

  • g / cm3

3
1 mark

Which unit is the same as a pressure of 1 pascal?

  • 1 joule per coulomb (1 J/C) 

  • 1 joule per second (1 J/s) 

  • 1 newton per square metre (1 N/m2)

  • 1 newton per kilogram (1 N/kg) 

4a
2 marks

A student wants to calculate the pressure he exerts on the floor when he stands on one foot. He records these measurements.

A two-row table of the student's measurements. The first row reads My weight and gives the value 650 followed by a dotted line where the unit has been left blank. The second row reads Area of the floor in contact with my foot and gives the value 270 square centimetres

(i) Complete the table by adding the unit for weight.

[1]

(ii) Which piece of equipment should the student use to measure his weight?

[1]

4b
3 marks

Suggest how the student measured the area of the floor in contact with his foot.

4c
3 marks

(i) State the equation linking pressure, force and area.

[1]

(ii) Calculate the pressure that the student's foot exerts on the floor.

[2]

Pressure = ..................................... N/cm2

5a
1 mark

A student measures the density of water.

She uses a measuring cylinder and an electronic balance.

Photograph of two pieces of laboratory apparatus side by side. On the left is a tall glass measuring cylinder standing on a wide hexagonal base, with a graduated scale marked in numbered divisions up the side. On the right is a digital electronic balance with a flat circular metal pan on top and a small rectangular display showing 0.00.

State the equation linking density, mass and volume.

5b
1 mark

Complete the table to show what is measured by an electronic balance.

Measuring instrument

What it measures

Measuring cylinder

Volume

Electronic balance

5c
4 marks

Describe how the student should use each instrument to make her measurements as accurate as possible. 

Measuring cylinder:

 Electronic balance:

5d
2 marks

The student wants to make sure her experiment is a fair test.

(i) State one factor that she should keep the same throughout her experiment.

[1]

(ii) Why is it important that she keeps this factor constant?

[1]

6a
1 mark

The volume of a piece of brass is 16.3 cm3.

A student measures its mass using an electronic balance.

The mass of the brass is 138 g. 

State the equation linking density, mass and volume.

6b
3 marks

Calculate the density of brass. Give the unit. 


density = ..................................... unit ...................

1a
2 marks

The object shown in the photograph is an old, brass mass.

It is marked 500 g.

Photograph of a cylindrical metal mass with a small rounded knob on its flat top, standing upright against a plain white background

A student puts the mass on an electronic balance.

The electronic balance reading is 498.2 g.

The student concludes:

A student pictured beside a speech bubble reading, "I think that the electronic balance is not working properly", with the word not in bold

Evaluate this conclusion.

1b
3 marks

The student wants to find the density of the old, brass mass. First, he obtains a correct value for the mass.

What else must he do to find the density?

2a
3 marks

A student places a pile of coins on a table, as shown in photograph A.

Photograph A, a stack of eight identical coins piled neatly one on top of another on a flat grey surface, so that only the top coin's face is visible and the whole pile rests on the area of a single coin

There are 8 coins in the pile.

The weight of each coin is 0.036 N.

The area of each coin is 0.0013 m2.

(i) State the equation linking pressure, force and area.

[1]

(ii) Calculate the pressure on the table caused by the pile of coins.

[2]

pressure = ..................................... Pa

2b
4 marks

The student then spreads the 8 coins out on the table as shown in photograph B.

Photograph B, the same eight coins lying flat and separated from one another on the grey surface, arranged in three loose rows of three, three and two coins, with no coin touching or overlapping another

(i) Describe how this affects the total force from the coins on the table.

[2]

(ii) Explain how this affects the pressure on the table caused by the coins.

[2]

3a
1 mark

The photograph shows a car tyre that needs to be inflated.

Greyscale photograph of a car wheel fitted with a multi-spoke alloy rim. The tyre is under-inflated, so its sidewall bulges outwards and the tread is flattened where it meets the road, giving a wide contact patch on the tarmac. Part of the car body and wheel arch is visible above the wheel.

Author: Ildar Sagdejev

The tyre exerts a pressure on the road of 270 kPa.

The area of the tyre touching the road is 0.016 m2.

State the equation linking pressure, force and area.

3b
4 marks

Calculate the force exerted on the road by the tyre. Give the unit. 

force = ..................................... unit.................

4a
2 marks

Kalpana finds a small stone.

To help her identify the type of stone, Kalpana decides to find its density.

Kalpana explains why she thinks this will help.

Kalpana, with a speech bubble reading: The density will be the same, whatever the size of the stone, as long as the type of rock is the same.

Her friend, Christine, disagrees.

Who is correct — Kalpana or Christine?

Christine, with a speech bubble reading: Bigger stones will have a higher density because they are heavier.

Explain your answer.

4b
3 marks

Kalpana uses a measuring cylinder to find the volume of water displaced by the stone.

She has three measuring cylinders to choose from.

Three measuring cylinders standing side by side, labelled A, B and C. A is the shortest and narrowest, marked 10 ml at the top, with its scale numbered 1 to 10 and five unnumbered divisions between each numbered mark. B is taller and wider, marked cm cubed, with its scale numbered 5, 10, 15, 20 and 25 and no divisions between the numbered marks. C is the tallest and widest, marked cm cubed, with its scale numbered 10, 20, 30, 40 and 50 and ten unnumbered divisions between each numbered mark.

(i) Which measuring cylinder would give the most precise measurement? Explain your answer.

[2]

(ii) The most precise measuring cylinder may not give an accurate reading. Suggest why.

[1]

4c
4 marks

The table shows the measurements that Kalpana makes.

A table with two columns, headed Mass of stone in g and Volume of stone in cm cubed. The single row of results reads 54 for the mass and 23 for the volume.

(i) State the equation linking density, mass and volume.

[1]

(ii) Calculate the density of the stone.

State your answer to an appropriate number of significant figures.

Give the unit.

[3]
density = ..................................... unit ....................

4d
3 marks

(i) How can Kalpana use her value of density to identify the type of stone?

[2]

(ii) Kalpana may still be unsure about the type of stone.

Suggest why.

[1]

5a
2 marks

The photograph shows a water barrel with a tap.

The barrel is used to store rainwater.

A photograph of a plastic water barrel standing upright on a dark base. A label points to the tall ribbed body of the container and reads barrel. A second label points to a small outlet fitted near the bottom of the container and reads tap.

A student investigates the water depth in the barrel.

She measures the depth and then opens the tap.

As water flows out of the barrel, she measures the depth every minute.

The table shows her results.

A results table with two columns headed Time in minutes and Depth in cm. The seven rows of data are 0 minutes and 86 cm, 1 minute and 52 cm, 2 minutes and 31 cm, 3 minutes and 18 cm, 4 minutes and 11 cm, 5 minutes and 7 cm, 6 minutes and 4 cm.

Which two measuring instruments should the student use in her investigation?

5b
7 marks

(i) Plot a graph to show how the depth changes with time, and draw the curve of best fit..

[5]

A blank sheet of graph paper made up of small squares grouped into larger squares, with no axes, scale or labels drawn on it.

(ii) Describe the relationship between depth and time.

[2]

5c
1 mark

The student notices that the water flows out less quickly as time passes. Suggest a reason for the decrease in flow. 

6a
4 marks

A student measures the diameter of a coin.

She uses the digital calliper shown in the photograph.

Photograph of a digital calliper with a coin held between its lower jaws. The display shows 20.31 in millimetres, and the sliding scale is marked from 0 to 150 mm.

The digital calliper gives readings to the nearest 0.01 mm.

The student measures the diameter of the coin eight times.

Her readings are shown below.

Eight digital calliper displays, each labelled mm, arranged in four rows of two. Read left to right and top to bottom, they show 20.31, 20.33, 20.35, 20.34, 20.44, 20.30, 20.33 and 20.30.

(i) Circle the anomalous reading.

[1]

(ii) Calculate the average diameter of the coin.

[3]

average = ..................................... mm

6b
2 marks

The student wants to find the thickness of a coin.

She takes several similar coins and measures them together as shown.

Close-up of the jaws of a digital calliper clamped around a stack of identical coins resting on their edges. The calliper display is blank.

She says:

A student with a thoughtful expression, with a speech bubble that reads "If I measure all the coins at once and divide this value by the number of coins it will be more accurate".

Do you agree with the student?

Explain why.

6c
3 marks

The student wants to find the density of the coin. She uses her values for the diameter and thickness of the coin to calculate its volume. What else must she do to find the density of the coin? 

7a
1 mark

A pressure switch is used in a washing machine to control the flow of water.

The water pushes on a flexible container and compresses some trapped air.

When the pressure of this trapped air reaches 104 kPa, the pressure switch turns the water off.

The pressure of the trapped air is given by this relationship

pressure of thetrapped air=atmosphericpressure+pressure differencecaused by water

State the equation linking pressure difference, height, density and g.

7b
4 marks

Calculate the height of water in the machine when the pressure of the trapped air reaches 104 kPa and the switch operates.

[atmospheric pressure = 100 kPa, density of water = 1000 kg/m3]      

height of water = .......................... m

1a
4 marks

John Leslie invented a differential thermometer.

The diagram shows this thermometer.

The bulbs are filled with air and are connected by a tube which contains liquid.

Diagram of a differential thermometer. Two vertical glass tubes are joined at the bottom by a U-bend and are partly filled with liquid, shown shaded grey. The tube on the left is topped by a glass bulb painted dull black; the tube on the right is topped by a glass bulb painted shiny silver. Labels point to the air trapped in the upper part of each tube, above the liquid. A vertical arrow marked h runs up the left-hand side, from the level of the bottom of the U-bend to the surface of the liquid. A vertical arrow marked l runs up the right-hand side, from the same base level to the top of the tube just below the silver bulb. The point X marks the bottom of the U-bend.

(i) State the equation linking pressure difference, height, density and g.

[1]

(ii) The density of the liquid is 1260 kg/m3 .

Calculate the pressure due to the liquid at X when the height, h, of the column of liquid is 0.25 m.

Give the unit.

[3]

Pressure = ............................. unit .....................

1b
7 marks

(i) The student places the differential thermometer in bright sunlight for a few minutes.

She observes that the liquid level

  • falls on the side of the dull black bulb making h lower

  • rises on the side of the shiny silver bulb

Use ideas about heat transfer and particle theory to explain these observations.

[3]

(ii) Explain what would happen to the levels of the liquid if the student repeated the experiment with a denser liquid in the thermometer.

[2]

(iii) Two students discuss the effect of changing the length, l, of the tube on both sides, while keeping the total volume of liquid constant.

Two students give opposing ideas in speech bubbles. The first student says that if the length of the tube is increased, the thermometer can measure higher temperatures. The second student says that changing the length of the tube will not make any difference to the range of temperatures that the thermometer can measure.

Explain which of these ideas is correct.

[2]

2a
3 marks

The photograph shows two containers that store rainwater.

The containers have taps that are joined by a pipe.

The taps are closed.

Photograph of two identical grey rainwater containers standing side by side, labelled A on the left and B on the right. Each container has a lid and a tap near its base, both taps labelled tap, and a flexible pipe joins the two taps.

The diagram shows the water levels inside the containers.

Diagram of the two containers side by side, labelled A on the left and B on the right, each drawn in outline and tapering towards the base. A horizontal line near the top of container A marks its water level, and a vertical arrow to the left shows this level is 91 cm above the base. A horizontal line low down in container B marks its water level, and a vertical arrow to the right shows this level is 34 cm above the base.

The density of water is 1000 kg/m3.

(i) State the equation linking pressure difference, height, density and g.

[1]

(ii) Calculate the pressure that the water causes at the base of container A.

[2]

pressure = ..................................... Pa

2b
4 marks

When the taps are opened, water flows in the pipe for some time. The diagram shows the final water level in container A.

Diagram of the two containers, labelled A on the left and B on the right, joined at their bases by a curved pipe. A horizontal line partway up container A marks the final water level in A. Container B is drawn in outline with no water level line on it.

(i) Complete the diagram to show the final water level in container B.

[1]

(ii) Explain why the water starts to flow and then stops.

[3]

3a
5 marks

This question is about pressure in a liquid.

A teacher uses this apparatus to demonstrate pressure difference in water.

The apparatus is hollow and has three short tubes at different depths.

The teacher completely fills the apparatus with water.

Water comes out of all the tubes.

A tall vertical cylindrical metal tube standing on a round base. Three short horizontal side tubes project from the right-hand side of the cylinder, one near the top, one at mid-height and one near the bottom. A curved line labelled path of water from the top tube leaves the topmost side tube and arcs outwards and downwards, landing on the ground beyond the base.

(i) State the relationship between pressure difference, height, density and g.

[1]

(ii) The diagram shows the path of water coming from the top tube.

Complete the diagram by drawing the paths of water you would expect to see from the other two tubes.

[2]

(iii) Explain the pattern of the paths of water from the tubes.

[2]

3b
3 marks

In another demonstration, the teacher uses this container.

The container is made of glass and each section has a different shape.

The teacher pours water into the container until it reaches the level shown in the left-hand section.

Five upright glass sections of different shapes, all joined at the bottom by a single horizontal channel that runs the full width of the container. From left to right the sections are: a narrow straight tube, a section that is narrow at the top and widens towards the bottom, a section that leans over to one side, a narrow zigzag section, and a section that bulges outwards near the top and narrows to a straight tube at the bottom. A short horizontal line labelled water level is marked near the top of the left-hand narrow tube.


(i) Complete the diagram by drawing the water levels in the other four sections.

[1]

(ii) Explain why the water fills the container in the way you have shown.

[2]

4a
2 marks

The photograph shows some large concrete cubes.

Black and white photograph of two large concrete cubes standing on grass in front of a tall hedge. The nearer cube fills the left of the picture, showing its rough, aggregate-flecked top face and two side faces; a second, similar cube stands further away to the right.

The mass of one of the concrete cubes is 1000 kg.

State the weight of this concrete cube.

Give the unit.

weight of concrete cube = ..................................... unit .................

4b
3 marks

The density of this concrete cube is 2300 kg/m3.

(i) State the equation linking density, mass and volume.

[1]

(ii) Calculate the volume of this concrete cube.

[2]

volume of concrete cube = ..................................... m3

4c
4 marks

The graph shows the volumes of 1000 kg of some other materials.

Graph showing the volume occupied by 1000 kg of six materials. The vertical axis is labelled volume of 1000 kg in m cubed and runs from 0 to 4.5 in steps of 0.5. The horizontal axis is labelled material and carries six separate named categories: cork, cardboard, ice, water, wet sand and granite. A shaded vertical column of equal width, with a gap on either side, stands over each category. Cork reaches 4.0, cardboard about 1.4, ice about 1.05, water 1.0, wet sand 0.5 and granite about 0.33.

(i) State the type of graph shown.

[1]

(ii) Give a reason why a line graph is not an appropriate way to display these data.

[1]

(iii) Use information from the graph to compare the densities of cork and water.

[2]

5a
1 mark

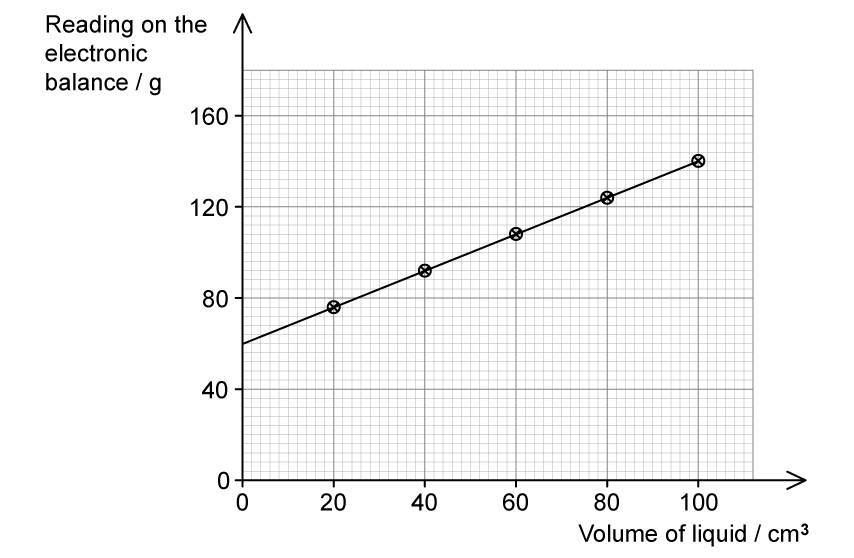
A student takes an empty measuring cylinder and places it on an electronic balance.

She records the mass and then adds an unknown liquid to the measuring cylinder. She records the volume of liquid in the measuring cylinder and the reading on the electronic balance.

She repeats this process and plots her results on a graph.

Graph with reading on the electronic balance in grams on the vertical axis, scaled 0 to 160, and volume of liquid in cubic centimetres on the horizontal axis, scaled 0 to 100. Five points are plotted, at (20, 76), (40, 92), (60, 108), (80, 124) and (100, 140), and a straight line of best fit is drawn through them and extended back to meet the vertical axis

Determine the mass of the empty measuring cylinder.

5b
4 marks

The table shows four different liquids and their densities.

Liquid

Density (kg / m3)

Ethanol

800

Water

1000

Petrol

700

Castor oil

900

Using the data from the graph and your answer to part (a) identify the liquid which the student used. 

The following data may be useful:

1 m3 = 1 × 106 cm3

5c
2 marks

The student repeats the experiment with a liquid which has a lower density. The same measuring cylinder was used for both experiments.

Draw a line on the graph to show the results she would expect to obtain from this second liquid.