Formation of Coloured Ions (AQA A Level Chemistry): Revision Note
Exam code: 7405

Colour in Transition Metal Ions
Most transition metal complexes are coloured
The colour arises because transition metal ions absorb specific wavelengths of visible light due to d–d electronic transitions

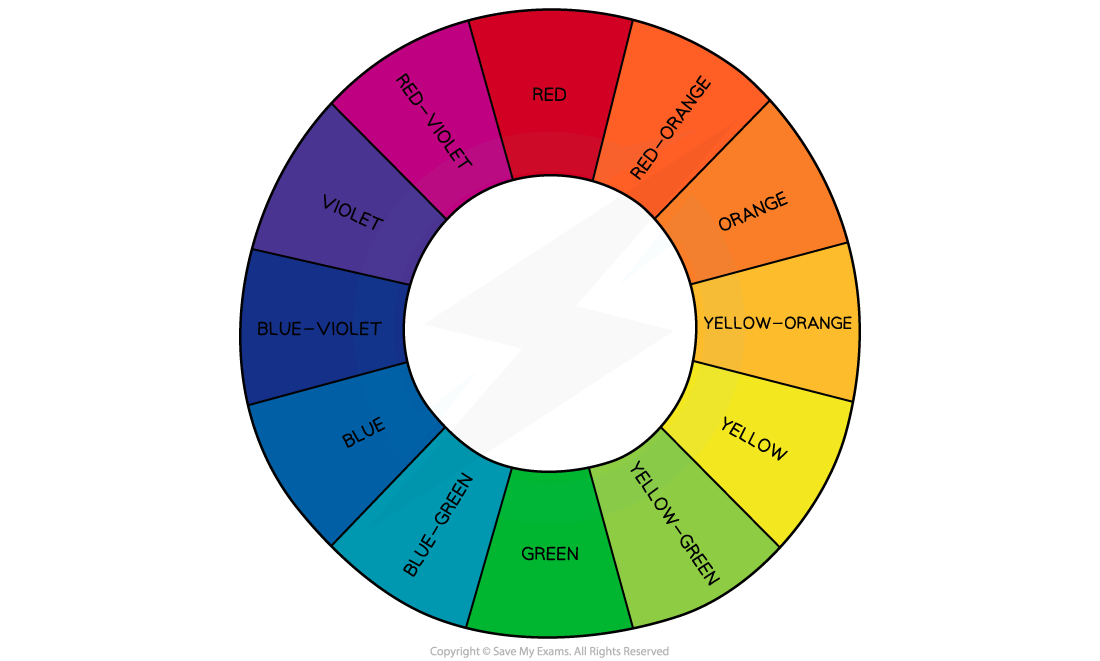
When white light passes through a coloured complex solution, certain wavelengths are absorbed
The colour observed is the complementary colour of the light absorbed — that is, the colour corresponding to the wavelengths that are transmitted or reflected
For example, aqueous copper(II) ions absorb light from the red region of the visible spectrum
The complementary colour observed is blue-green (cyan)
Electron promotion in transition metal ions
Electron promotion explains the colour of transition metal complexes
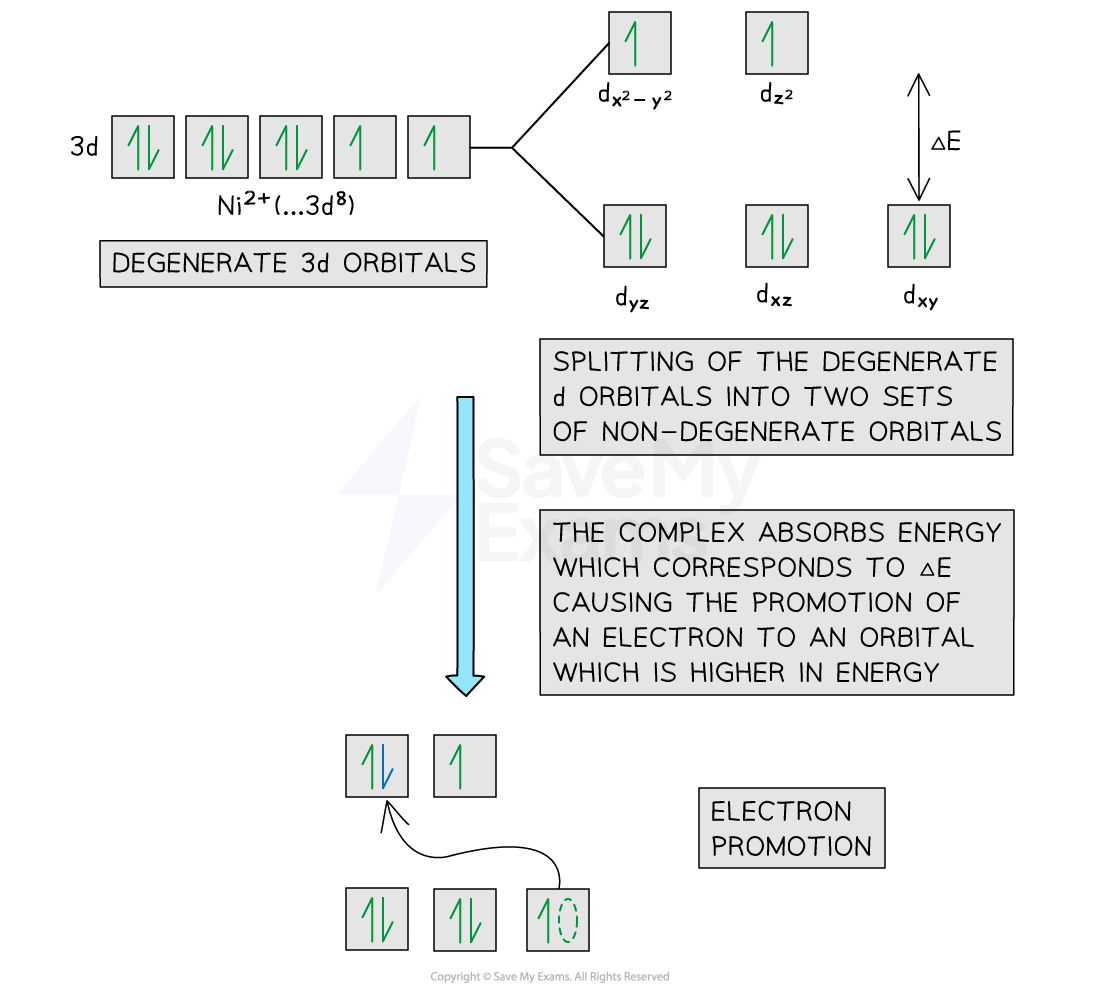
In an isolated transition metal ion (with no ligands attached), the five 3d orbitals are equal in energy
Orbitals with the same energy are described as degenerate
When ligands bond to the central metal ion by forming dative covalent bonds, the 3d orbitals split into two sets with different energies
These are described as non-degenerate orbitals
The energy difference between the two sets is called ΔE
When light passes through a solution containing a transition metal complex, an electron can absorb energy equal to ΔE and become promoted from a lower-energy 3d orbital to a higher-energy 3d orbital
This process is known as electron promotion (or excitation)
The energy absorbed is given by:
![]()
h = Planck's constant (6.626 x 10⁻³⁴ m2 kg s-1)
![]() = frequency (Hertz, Hz or s-1)
= frequency (Hertz, Hz or s-1)
The remaining wavelengths of light that are not absorbed combine to produce the complementary colour that is observed
For example, in an octahedral nickel(II) complex, the 3d orbitals split into two energy levels, and electron promotion between these levels results in the observed colour
Changes in Colour
Transition metal complexes absorb light with a frequency that corresponds exactly to the energy gap (ΔE) between the split, non-degenerate d orbitals
The wavelengths of light that are not absorbed are transmitted
These combine to produce the complementary colour that is observed
The size of the energy gap (ΔE) is influenced by several factors, including:
The type of ligand (different ligands cause different amounts of splitting)
The coordination number (which affects the geometry of the complex)
The oxidation state of the metal ion (higher oxidation states generally increase ΔE)
Changes in these factors alter ΔE, and therefore change the wavelength of light absorbed and the colour observed
Type of ligand
Different ligands cause different amounts of splitting of the d orbitals in a transition metal complex
The extent of splitting depends on the strength of interaction between the ligands and the metal ion (often described in terms of ligand field strength)
Stronger-field ligands produce a larger energy gap (ΔE)
If ΔE changes, the frequency of light absorbed also changes
As a result, a different wavelength of light is absorbed, and a different complementary colour is observed
This means that complexes containing the same transition metal ion in the same oxidation state can have different colours if the ligands are different
For example, the hexaaquacopper(II) ion, [Cu(H2O)6]2+, is light blue
When ammonia ligands replace some of the water ligands to form [Cu(NH3)4 (H2O)2]2+, the solution becomes dark blue
In both complexes, copper has an oxidation state of +2
The difference in colour shows that the ligands surrounding the metal ion affect the size of ΔE and therefore the colour of the complex
Coordination number
The coordination number affects the strength of interaction between the metal ion and its ligands
Different coordination numbers often result in different geometries (for example, octahedral or tetrahedral), which alter the splitting of the d orbitals and therefore the size of ΔE
In practice, changing the coordination number usually also involves changing the ligand, so both factors influence the strength of the metal–ligand interaction
Oxidation State
The strength of attraction between a transition metal ion and the lone pairs on the ligands depends on the effective nuclear charge of the metal ion
For example, manganese(II) and iron(III) both have the electron configuration [Ar]3d5
However, Fe3+ has a higher nuclear charge than Mn2+
This results in a stronger attraction between the metal ion and the ligands in [Fe(H2O)6]3+ compared with [Mn(H2O)6]2+
As a result, the splitting of the d orbitals (ΔE) is larger for [Fe(H2O)6]3+
The larger ΔE means that higher-energy (shorter wavelength) light is absorbed
For example:
[Mn(H2O)6]2+ appears pale pink because it absorbs light in the green region of the spectrum
[Fe(H2O)6]3+ absorbs higher-energy blue light and therefore appears orange (the complementary colour)
Similarly, when comparing iron(II) and iron(III):
[Fe(H2O)6]2+ absorbs light in the red region and appears pale green
[Fe(H2O)6]3+ absorbs in the blue region and appears orange
This shows that a higher oxidation state generally leads to stronger metal–ligand interactions, a larger ΔE, and a change in the colour of the complex

Visible Light Spectroscopy
Spectroscopy is the study of the interaction between electromagnetic radiation and matter
A simple colorimeter is used to determine the concentration of coloured solutions, such as transition metal ion solutions
The colorimeter passes light of a selected wavelength through the solution
The wavelength is chosen using coloured filters, and the intensity of transmitted light is measured by a detector
The filter selected corresponds to the wavelength of light that is most strongly absorbed by the solution
This is the complementary colour to the observed colour of the solution
For example, a blue solution absorbs light from the red region of the spectrum
Therefore, a red filter is used so that red light passes through the solution, and maximum absorption occurs
Some of the light is absorbed by the solution, and the remaining light passes through to the detector
The amount of light absorbed can then be used to calculate the concentration of the solution

To determine the concentration of a coloured solution, a calibration curve must first be constructed
This involves measuring the absorbance of a series of standard solutions with known concentrations
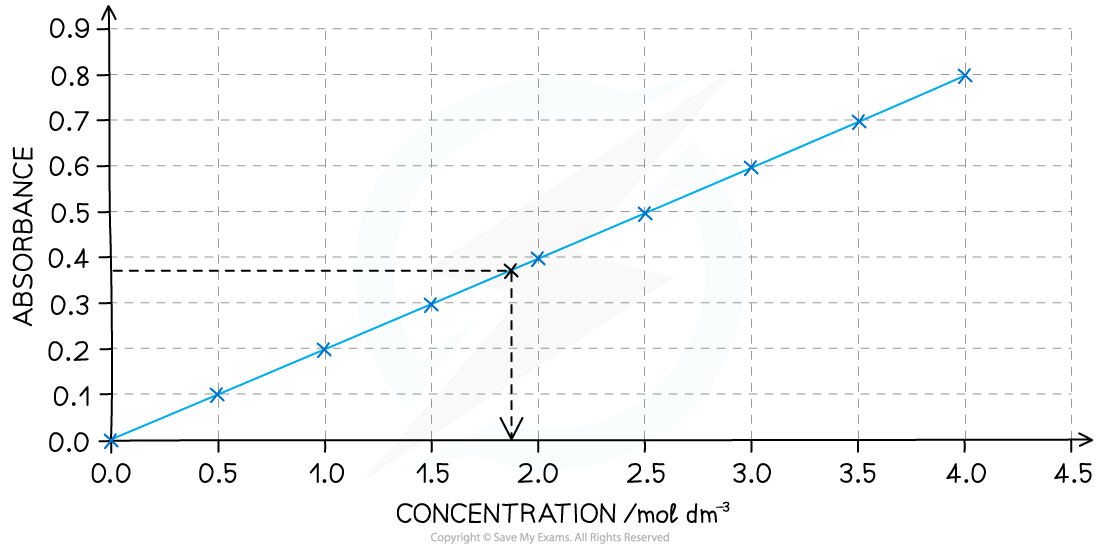
At low concentrations, absorbance is directly proportional to concentration
This relationship is known as the Beer–Lambert law, and it produces a straight-line calibration graph
Once the calibration curve has been plotted, the absorbance of an unknown solution of the same complex ion can be measured.
The concentration is then determined by locating the absorbance value on the y-axis, drawing across to the calibration line, and then down to the concentration axis
Limitations of visible spectroscopy include:
Very dark solutions may absorb too much light, making accurate measurement difficult
Very pale solutions may have absorbance values close to the sensitivity limit of the colorimeter
One way to overcome low absorbance is to convert the complex into a more intensely coloured species using ligand exchange
For example, adding thiocyanate ions (SCN⁻) to aqueous iron(III) ions forms a blood-red complex:
[Fe(H2O)6]3+ (aq) + SCN- (aq) ⇌ [Fe(H2O)5 SCN]2+ (aq) + H2O (l)
pale orange colourless blood-red complex
Examiner Tips and Tricks
You should know the factors that change the colour of transition metal complex ions and be able to write equations to give examples of those changes.

Unlock more, it's free!
Join the 100,000+ Students that ❤️ Save My Exams
the (exam) results speak for themselves:

Was this revision note helpful?
