Required Practical 7 (AQA A Level Chemistry): Revision Note
Exam code: 7405

Required Practical 7
Required Practical 7: Measuring the rate of a reaction
There are two ways to measure the rate of reaction
By an initial rate method
By a continuous monitoring method
An initial rate method: The iodination of propanone
The iodination of propanone is a suitable experiment in which the rate of reaction can be measured throughout the reaction by using a colorimeter
The reaction is carried out using a catalyst of dilute sulfuric acid
The iodine decolourises during the reaction as it turns into iodopropanone and hydrogen iodide:
CH3COCH3 + I2 → CH3COCH2I + HI
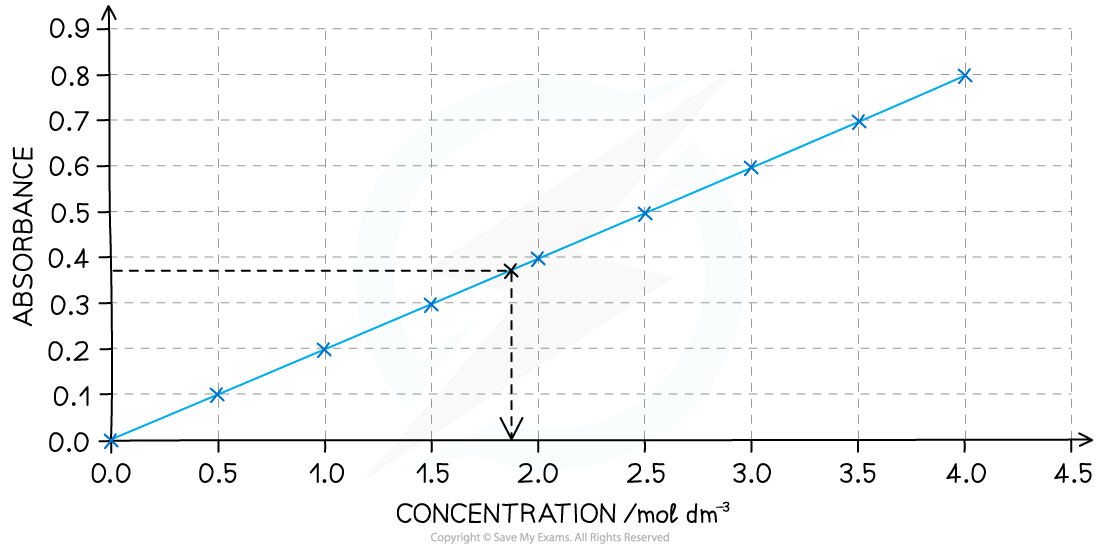
The colorimeter measures colour absorbance, which is proportional to the concentration of the coloured species
Before the investigation beings it is necessary to measure the absorbance of a set of standard solutions of iodine and obtain a calibration curve
For example, here is a calibration curve for a transition metal ion that allows you to convert colorimeter readings into concentrations:
Steps in the procedure
The colorimeter uses very small volumes of solutions, so four burettes can be filled with solutions of 0.02 mol dm-3 iodine, 1.0 mol dm-3 propanone, 1.0 mol dm-3 sulfuric acid and distilled water
By varying the volumes of solutions while maintaining a constant total volume with the use of distilled water, you can obtain several different concentrations
The solutions are measured into a small beaker, leaving the iodine in a separate beaker - this starts the reaction, so it can be added when you start a timer or stopwatch
The iodine is added to the other liquids, the contents mixed and then quickly transferred into the cuvette (small receptacle), and the colorimeter/data logger is started

A typical set of volume compositions could be as follows:
Volume Compositions Table
Run | Iodine / cm3 | Sulfuric acid / cm3 | Water / cm3 | Propanone / cm3 |
|---|---|---|---|---|
1 | 4 | 1 | 4 | 1 |
2 | 4 | 1 | 3 | 2 |
3 | 4 | 1 | 2 | 3 |
4 | 4 | 1 | 1 | 4 |
5 | 4 | 1 | 0 | 5 |
Practical tip
Choose a filter that gives the strongest absorbance for the solution you are using - this will be the complementary colour to the colour of the solution under investigation
Specimen Results
Here is a set of typical results for this experiment
Concentration of iodine/mol dm-3 | Time / s |
|---|---|
0.0100 | 0 |
0.0090 | 30 |
0.0081 | 60 |
0.0073 | 90 |
0.0066 | 120 |
0.0053 | 180 |
0.0042 | 240 |
0.0028 | 360 |
0.0020 | 480 |
0.0013 | 600 |
0.0007 | 720 |
Graphing the results

Analysis
To find the rate of reaction at any point, a tangent is drawn, and the gradient is determined
The gradient gives the rate of reaction
For example, in the graph above, the rate of reaction at 300 seconds can be found
A vertical line is drawn from the 300 s mark until it meets the curve, then a tangent is drawn
Gradient
format('truetype')%3Bfont-weight%3Anormal%3Bfont-style%3Anormal%3B%7D%3C%2Fstyle%3E%3C%2Fdefs%3E%3Ctext%20font-family%3D%22math11824c643d1feb4da18b28ed527%22%20font-size%3D%2216%22%20text-anchor%3D%22middle%22%20x%3D%228.5%22%20y%3D%2230%22%3E%3D%3C%2Ftext%3E%3Cline%20stroke%3D%22%23000%22%20stroke-linecap%3D%22square%22%20stroke-width%3D%221%22%20x1%3D%2223.5%22%20x2%3D%2248.5%22%20y1%3D%2223.5%22%20y2%3D%2223.5%22%2F%3E%3Ctext%20font-family%3D%22Times%20New%20Roman%22%20font-size%3D%2218%22%20font-style%3D%22italic%22%20text-anchor%3D%22middle%22%20x%3D%2231.5%22%20y%3D%2216%22%3E%26%23x394%3B%3C%2Ftext%3E%3Ctext%20font-family%3D%22Times%20New%20Roman%22%20font-size%3D%2218%22%20font-style%3D%22italic%22%20text-anchor%3D%22middle%22%20x%3D%2241.5%22%20y%3D%2216%22%3Ey%3C%2Ftext%3E%3Ctext%20font-family%3D%22Times%20New%20Roman%22%20font-size%3D%2218%22%20font-style%3D%22italic%22%20text-anchor%3D%22middle%22%20x%3D%2231.5%22%20y%3D%2241%22%3E%26%23x394%3B%3C%2Ftext%3E%3Ctext%20font-family%3D%22Times%20New%20Roman%22%20font-size%3D%2218%22%20font-style%3D%22italic%22%20text-anchor%3D%22middle%22%20x%3D%2241.5%22%20y%3D%2241%22%3Ex%3C%2Ftext%3E%3Ctext%20font-family%3D%22math11824c643d1feb4da18b28ed527%22%20font-size%3D%2216%22%20text-anchor%3D%22middle%22%20x%3D%2263.5%22%20y%3D%2230%22%3E%3D%3C%2Ftext%3E%3Cline%20stroke%3D%22%23000%22%20stroke-linecap%3D%22square%22%20stroke-width%3D%221%22%20x1%3D%2278.5%22%20x2%3D%22131.5%22%20y1%3D%2223.5%22%20y2%3D%2223.5%22%2F%3E%3Ctext%20font-family%3D%22Times%20New%20Roman%22%20font-size%3D%2218%22%20text-anchor%3D%22middle%22%20x%3D%2284.5%22%20y%3D%2216%22%3E0%3C%2Ftext%3E%3Ctext%20font-family%3D%22math11824c643d1feb4da18b28ed527%22%20font-size%3D%2216%22%20text-anchor%3D%22middle%22%20x%3D%2291.5%22%20y%3D%2216%22%3E.%3C%2Ftext%3E%3Ctext%20font-family%3D%22Times%20New%20Roman%22%20font-size%3D%2218%22%20text-anchor%3D%22middle%22%20x%3D%22112.5%22%20y%3D%2216%22%3E0069%3C%2Ftext%3E%3Ctext%20font-family%3D%22Times%20New%20Roman%22%20font-size%3D%2218%22%20text-anchor%3D%22middle%22%20x%3D%22105.5%22%20y%3D%2241%22%3E580%3C%2Ftext%3E%3Ctext%20font-family%3D%22math11824c643d1feb4da18b28ed527%22%20font-size%3D%2216%22%20text-anchor%3D%22middle%22%20x%3D%22146.5%22%20y%3D%2230%22%3E%3D%3C%2Ftext%3E%3C%2Fsvg%3E) 1.19 x 10⁻⁵ mol dm-3 s-1
1.19 x 10⁻⁵ mol dm-3 s-1 The gradient is the rate of reaction at that point
A continuous monitoring method: The reaction between magnesium and hydrochloric acid
This reaction can be used to investigate the effect of varying the concentration of the acid while keeping the temperature constant
When a gas is released, you can either try to measure the volume of gas given off or the mass change in the reaction flask
However, in this case, the gas hydrogen is too low in density, so the mass change will be far too small to register on a laboratory balance
Volume can be measured either by the displacement of water into an inverted measuring cylinder or by using a gas syringe

Steps in the procedure
Before you begin, you need to check that your apparatus is gas-tight
This can be done by assembling everything without the acid or magnesium and trying to move the plunger
If you feel resistance, the apparatus is gas-tight
The acid will go in first because it is quicker to drop a piece of magnesium ribbon in than to pour in the acid
To vary the concentration of the acid, you need to dilute it by measuring portions of acid in a measuring cylinder and then portions of distilled water in another measuring cylinder, and adding them to the conical flask
Choose a suitable volume of acid to match the size of the flask, e.g. 40 cm3
You don't want to use acid that is stronger than 2 mol dm-3 because the reaction will be too fast, so it's best to start with 2 mol dm-3 and perform a serial dilution, e.g. 40 cm3(acid) + 0 cm3 (water), 35 cm3 (acid) + 5 cm3 (water), etc
Practical tips
Make sure the plunger is fully inserted before you start the experiment, or you will have a volume error
If the magnesium does not look new and shiny, you may need to clean the surface with a bit of sandpaper
Make sure the plunger is secure and does not fall out of the barrel if the volume exceeds 100 cm3
Specimen Results
Here is a set of typical results for this experiment
Rate of reaction between magnesium and acid results table
Volume of gas collected /cm3 | |||
|---|---|---|---|
Time/seconds | 2.0 mol dm-3 HCl | 1.0 mol dm-3 HCl | 0.5 mol dm-3 HCl |
0 | 0 | 0 | 0 |
10 | 10 | 6 | 3 |
20 | 20 | 11 | 6 |
30 | 28 | 15 | 9 |
40 | 34 | 19 | 12 |
50 | 40 | 21 | 14 |
60 | 44 | 22 | 15 |
Graphing the results

Analysis
The lines of best fit are drawn for each concentration on the same graph
A tangent is then drawn starting from (0,0), since this method is used to find the initial rate of reaction
The gradient of the tangent is determined, which gives the rate of reaction
In the example above, the rate of reaction for 2.0 mol dm-3 acid is
Gradient
format('truetype')%3Bfont-weight%3Anormal%3Bfont-style%3Anormal%3B%7D%3C%2Fstyle%3E%3C%2Fdefs%3E%3Ctext%20font-family%3D%22math17f39f8317fbdb1988ef4c628eb%22%20font-size%3D%2216%22%20text-anchor%3D%22middle%22%20x%3D%228.5%22%20y%3D%2230%22%3E%3D%3C%2Ftext%3E%3Cline%20stroke%3D%22%23000%22%20stroke-linecap%3D%22square%22%20stroke-width%3D%221%22%20x1%3D%2223.5%22%20x2%3D%2248.5%22%20y1%3D%2223.5%22%20y2%3D%2223.5%22%2F%3E%3Ctext%20font-family%3D%22Times%20New%20Roman%22%20font-size%3D%2218%22%20text-anchor%3D%22middle%22%20x%3D%2231.5%22%20y%3D%2216%22%3E%26%23x394%3B%3C%2Ftext%3E%3Ctext%20font-family%3D%22Times%20New%20Roman%22%20font-size%3D%2218%22%20font-style%3D%22italic%22%20text-anchor%3D%22middle%22%20x%3D%2241.5%22%20y%3D%2216%22%3Ey%3C%2Ftext%3E%3Ctext%20font-family%3D%22Times%20New%20Roman%22%20font-size%3D%2218%22%20text-anchor%3D%22middle%22%20x%3D%2231.5%22%20y%3D%2241%22%3E%26%23x394%3B%3C%2Ftext%3E%3Ctext%20font-family%3D%22Times%20New%20Roman%22%20font-size%3D%2218%22%20font-style%3D%22italic%22%20text-anchor%3D%22middle%22%20x%3D%2241.5%22%20y%3D%2241%22%3Ex%3C%2Ftext%3E%3Ctext%20font-family%3D%22math17f39f8317fbdb1988ef4c628eb%22%20font-size%3D%2216%22%20text-anchor%3D%22middle%22%20x%3D%2263.5%22%20y%3D%2230%22%3E%3D%3C%2Ftext%3E%3Cline%20stroke%3D%22%23000%22%20stroke-linecap%3D%22square%22%20stroke-width%3D%221%22%20x1%3D%2278.5%22%20x2%3D%2299.5%22%20y1%3D%2223.5%22%20y2%3D%2223.5%22%2F%3E%3Ctext%20font-family%3D%22Times%20New%20Roman%22%20font-size%3D%2218%22%20text-anchor%3D%22middle%22%20x%3D%2289.5%22%20y%3D%2216%22%3E40%3C%2Ftext%3E%3Ctext%20font-family%3D%22Times%20New%20Roman%22%20font-size%3D%2218%22%20text-anchor%3D%22middle%22%20x%3D%2289.5%22%20y%3D%2241%22%3E38%3C%2Ftext%3E%3Ctext%20font-family%3D%22math17f39f8317fbdb1988ef4c628eb%22%20font-size%3D%2216%22%20text-anchor%3D%22middle%22%20x%3D%22114.5%22%20y%3D%2230%22%3E%3D%3C%2Ftext%3E%3C%2Fsvg%3E) 1.05 mol dm-3 s-1
1.05 mol dm-3 s-1
Examiner Tips and Tricks
Whichever rate experiments you carry out, make sure you can
Describe the steps in the procedure
Name all the apparatus used
Draw data tables which include headings and units
Draw graphs showing labels, units and best-fit lines
Determine an initial gradient or at any point in the curve

Unlock more, it's free!
Join the 100,000+ Students that ❤️ Save My Exams
the (exam) results speak for themselves:

Was this revision note helpful?
