1

2 marks
0 | 20 | 40 | 60 | 80 | 100 | |
20 | 45 | 60 | 65 | 45 | 30 |
The table above shows selected values of , where is a differentiable function.
Must there exist a value of , for , such that ? Justify your answer.
Was this exam question helpful?
0 | 20 | 40 | 60 | 80 | 100 | |
20 | 45 | 60 | 65 | 45 | 30 |
The table above shows selected values of , where is a differentiable function.
Must there exist a value of , for , such that ? Justify your answer.
Was this exam question helpful?
The rate at which people enter a sports stadium for an event is given by where is the number of minutes since the stadium is open for people to enter. This function is valid for and is measured in people per minute.
After the stadium has been open for half an hour, is the rate at which people enter the stadium increasing or decreasing? Give a reason for your answer.
Was this exam question helpful?

The graph of the continuous function , the derivative of the function , is shown above for .
On what open intervals, if any, is the graph of both decreasing and concave down? Give a reason for your answer.
Was this exam question helpful?

The figure above shows the graph of the function . For , the function is defined by .
Does the graph of have a point of inflection at ? Justify your answer.
Was this exam question helpful?

The function is differentiable on the closed interval and satisfies . The graph of , the derivative of , consists of three line segments, as shown in the figure above.
Find the absolute minimum value of on the closed interval . Justify your answer.
Was this exam question helpful?

The function is defined on the closed interval [-5, 5]. The graph of , the derivative of , consists of two line segments and a semicircle, as shown in the figure.
Does have a relative minimum, a relative maximum, or neither at ? Give a reason for your answer.
On what open intervals, if any, is the graph of concave down? Give a reason for your answer.
Was this exam question helpful?
It is known for , where is a positive non-zero constant, that the rate of change is . For a particular value of , the maximum value of is 40. Find the value of .
Was this exam question helpful?

Let and be the functions defined by and . The graphs of and , shown in the figure above, inersect at and , where and .
For let be the vertical distance between the graphs of and . Is increasing or decreasing at ? Give a reason for your answer.
Was this exam question helpful?
0 | 0 |
0.9 | 2.2 |
5.1 | -1.16 |
8.4 | 2.2 |
12 | 1.92 |
Selected values of the differentiable function are shown in the table above.
Justify why there must be at least one value of for , at which is equal to zero.
Was this exam question helpful?

Let be the continuous function defined on whose graph, consisting of three straight line segments and a semicircle, is given above. Let be the function .
Find the -coordinate of each point at which the graph of has a horizontal tangent line. For each of these points, determine whether has a relative minimum, relative maximum or neither a minimum or maximum at the point. Justify your answers.
For , find all the values of for which the graph of has a point of inflection. Explain your reasoning.
Was this exam question helpful?
A procedure is used to administer medication to a patient. The amount, in milligrams, of the medication in the patient at time hours is modeled by a function that satisfies the differential equation . At time hour, there are 2.5 milligrams of the medication in the patient. Is the rate of change of the amount of medication in the patient increasing or decreasing at time ? Give a reason for your answer.
Was this exam question helpful?

Let be a differentiable function. On the interval , the graph of , the derivative of , consists of a semicircle and two line segments, as shown in the figure above.
Find the -coordinates of all points of inflection of the graph of for . Justify your answer.
Let be the function defined by . On what intervals, if any, is decreasing for ? Show the analysis that leads to your answer.
Given that , find the absolute maximum value of the function defined in part (b) on the interval . Justify your answer.
Was this exam question helpful?

Let be a continuous function defined on the closed interval . The graph of , consisting of four line segments, is shown above. Let be the function defined by
Find the average rate of change of on the interval [-6, 6]. Does the Mean Value Theorem guarantee a value , for which is equal to this average rate of change? Justify your answer.
Was this exam question helpful?
Birds enter an area of woodland at a rate modeled by the function . Birds leave the area at a rate modeled by the function . Both and are measured in birds per hour, and is measured in hours since midnight .
At what value of , for , is the greatest number of birds in the area of woodland? Justify your answer.
Is the rate of change in the number of birds in the area of woodland increasing or decreasing at noon ? Explain your reasoning.
Was this exam question helpful?

The continuous function is defined on the closed interval . The figure above shows the graph of , consisting of two line segments and a quarter of a circle centered at the point .
The function is given by . Find the absolute maximum value of on the interval . Justify your answer.
Was this exam question helpful?
The rate at which a hot object cools down is proportional to the difference between its current temperature and the ambient temperature of the surrounding environment. If is the temperature of the object in degrees Farenheit at time hours, and the surrounding temperature is constant at °F, the rate of change of the temperature is given by:
Initially, at , the temperature of the object is °F.
Find in terms of . Use to explain why the graph of cannot resemble the following graph.

Was this exam question helpful?
The velocity of a particle, P, moving along the -axis is given by the differentiable function , where is measured in meters per hour and is measured in hours. Selected values of are shown in the table below.
(hours) | 0 | 0.3 | 1.7 | 2.8 | 4 |
|---|---|---|---|---|---|
(meters per hour) | 0 | 55 | −29 | 55 | 48 |
Particle P is at the origin at time .
Justify why there must be at least one time , for , at which , the acceleration of particle P, equals 0 meters per hour per hour.
Was this exam question helpful?
The function is defined on the closed interval and satisfies . The graph of , the derivative of , consists of two line segments and a semicircle, as shown in the figure.
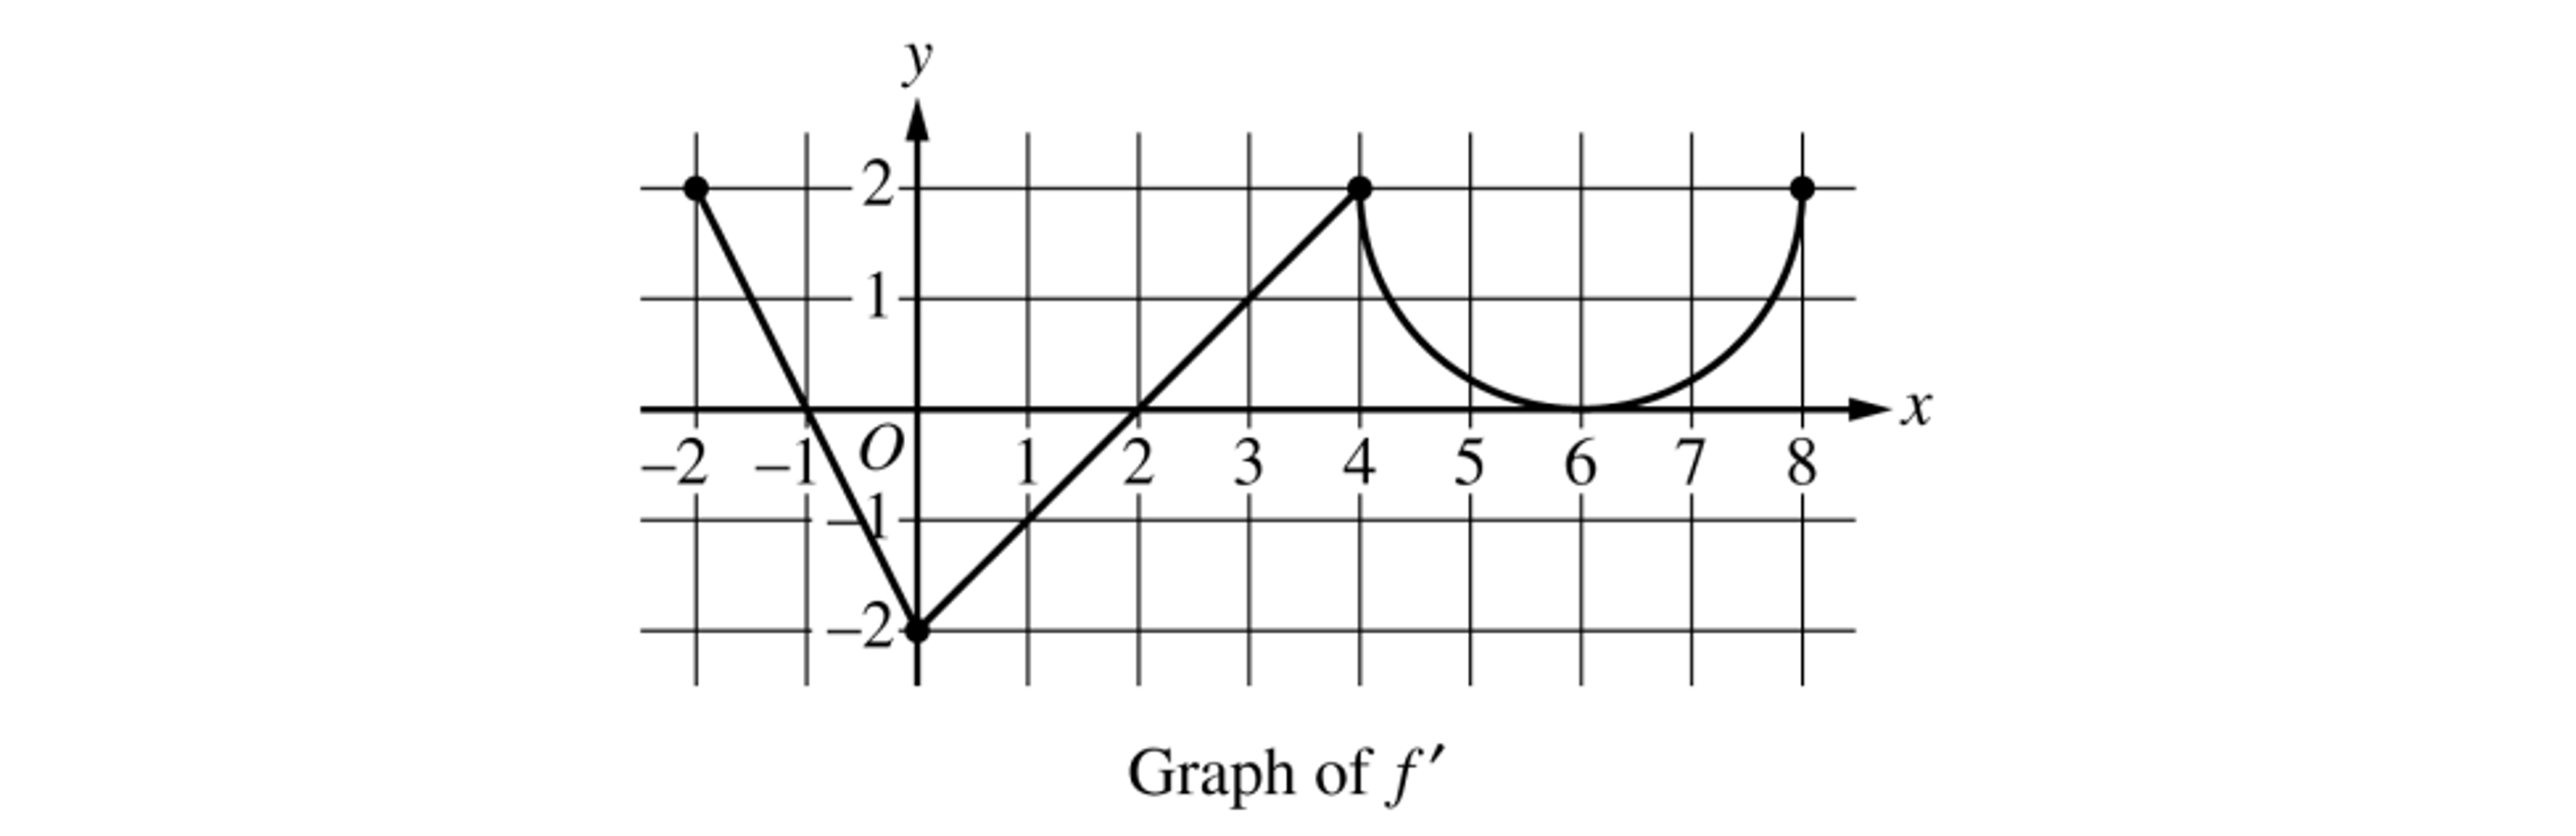
Does have a relative minimum, a relative maximum, or neither at ? Give a reason for your answer.
On what open intervals, if any, is the graph of concave down? Give a reason for your answer.
Was this exam question helpful?