Unit 8 Overview (College Board AP® Calculus AB): Exam Questions

4 hours27 questions
1a
Sme Calculator
2 marks

The density of a bacteria population in a circular petri dish at a distance r centimeters from the center of the dish is given by an increasing, differentiable function f, where f(r) is measured in milligrams per square centimeter. Values of f(r) for selected values of r are given in the table below.

r (centimeters)

0

1

2

2.5

4

f(r) (mg per cm²)

1

2

6

10

18

Use the data in the table to estimate f'(2.25). Using correct units, interpret the meaning of your answer in the context of this problem.

1b
Sme Calculator
2 marks

The total mass, in milligrams, of bacteria in the petri dish is given by the integral expression 2\pi \int_0^4 r\,f(r)\,\text{d}r. Approximate the value of 2\pi \int_0^4 r\,f(r)\,\text{d}r using a right Riemann sum with the four subintervals indicated by the data in the table.

1c
Sme Calculator
2 marks

Is the approximation found in part (b) an overestimate or underestimate of the total mass of bacteria in the petri dish? Explain your reasoning.

1d
Sme Calculator
3 marks

The density of bacteria in the petri dish, for 1 \leq r \leq 4, is modelled by the function g defined by g(r) = 2 - 16 (\text{cos}(1.57 \sqrt{r}))^{3}. For what value of k, 1 < k < 4, is g(k) equal to the average value of g(r) on the interval 1 \leq r \leq 4?

2a
Sme Calculator
2 marks

People enter a line for an escalator at a rate modeled by the function r given by

r \left(t\right) = \left\{\begin{matrix} 44 \left(\frac{t}{100}\right)^{3} \left(1 - \frac{t}{300}\right)^{7} & \text{for } 0 \leq t \leq 300 \\ 0 & \text{for } t > 300 \end{matrix}\right.

where r \left(t\right) is measured in people per second and t is measured in seconds. As people get on the escalator, they exit the line at a constant rate of 0.7 person per second. There are 20 people in line at time t = 0.

(Note: Your calculator should be in radian mode.)

How many people enter the line for the escalator during the time interval 0 \leq t \leq 300?

2b
Sme Calculator
2 marks

During the time interval 0 \leq t \leq 300, there are always people in line for the escalator. How many people are in line at time t = 300?

2c
Sme Calculator
1 mark

For t > 300, what is the first time t that there are no people in line for the escalator?

2d
Sme Calculator
4 marks

For 0 \leq t \leq 300, at what time t is the number of people in line a minimum? To the nearest whole number, find the number of people in line at this time. Justify your answer.

3a
Sme Calculator
2 marks

The temperature of coffee in a cup at time t minutes is modeled by a decreasing differentiable function C, where C(t) is measured in degrees Celsius. For 0 \leq t \leq 12, selected values of C(t) are given in the table below.

t (minutes)

0

3

7

12

C(t) (degrees Celsius)

100

85

69

55

Approximate C'(5) using the average rate of change of C over the interval 3 \leq t \leq 7. Show the work that leads to your answer and include units of measure.

3b
Sme Calculator
3 marks

Use a left Riemann sum with the three subintervals indicated by the data in the table to approximate the value of \int_0^{12} C(t) \, \text{d}t. Interpret the meaning of \frac{1}{12}\int_0^{12} C(t) \, \text{d}t in the context of the problem.

3c
Sme Calculator
3 marks

For 12 \leq t \leq 20, the rate of change of the temperature of the coffee is modeled by C'(t) = \frac{-24.55e^{0.01t}}{t}, where C'(t) is measured in degrees Celsius per minute. Find the temperature of the coffee at time t = 20. Show the setup for your calculations.

3d
Sme Calculator
1 mark

For the model defined in part (c), it can be shown that C''(t) = \frac{0.2455e^{0.01t}(100 - t)}{t^2}. For 12 < t < 20, determine whether the temperature of the coffee is changing at a decreasing rate or at an increasing rate. Give a reason for your answer.

4a
Sme Calculator
2 marks

Fish enter a lake at a rate modeled by the function E given by E(t) = 20 + 15 \text{sin} \; \left(\frac{\pi t}{6}\right). Fish leave the lake at a rate modeled by the function L given by L(t) = 4 + 2^{0.1t^2}. Both E(t) and L(t) are measured in fish per hour, and t is measured in hours since midnight (t = 0).

(Note: Your calculator should be in radian mode.)

How many fish enter the lake over the 5-hour period from midnight (t = 0) to 5 A.M. (t = 5)? Give your answer to the nearest whole number.

4b
Sme Calculator
2 marks

What is the average number of fish that leave the lake per hour over the 5-hour period from midnight (t = 0) to 5 A.M. (t = 5)?

4c
Sme Calculator
3 marks

At what time t, for 0 \leq t \leq 8, is the greatest number of fish in the lake? Justify your answer.

4d
Sme Calculator
2 marks

Is the rate of change in the number of fish in the lake increasing or decreasing at 5 A.M. (t = 5)? Explain your reasoning.

5a
Sme Calculator
1 mark

From 5 A.M. to 10 A.M., the rate at which vehicles arrive at a certain toll plaza is given by A left parenthesis t right parenthesis equals 450 square root of sin left parenthesis 0.62 t right parenthesis end root, where t is the number of hours after 5 A.M. and A(t) is measured in vehicles per hour. Traffic is flowing smoothly at 5 A.M. with no vehicles waiting in line.

Write, but do not evaluate, an integral expression that gives the total number of vehicles that arrive at the toll plaza from 6 A.M. (t = 1) to 10 A.M. (t = 5).

5b
Sme Calculator
2 marks

Find the average value of the rate, in vehicles per hour, at which vehicles arrive at the toll plaza from 6 A.M. (t = 1) to 10 A.M. (t = 5).

5c
Sme Calculator
2 marks

Is the rate at which vehicles arrive at the toll plaza at 6 A.M. (t = 1) increasing or decreasing? Give a reason for your answer.

5d
Sme Calculator
4 marks

A line forms whenever A(t) \geq 400. The number of vehicles in line at time t, for a \leq t \leq 4, is given by N(t) = \int_a^t (A(x) - 400)\,\text{d}x, where a is the time when a line first begins to form. To the nearest whole number, find the greatest number of vehicles in line at the toll plaza in the time interval a \leq t \leq 4. Justify your answer.

6a
Sme Calculator
2 marks

Water is pumped into a tank at a rate modeled by W(t) = 2000e^{-t^2/20} liters per hour for 0 \leq t \leq 8, where t is measured in hours. Water is removed from the tank at a rate modeled by R(t) liters per hour, where R is differentiable and decreasing on 0 \leq t \leq 8. Selected values of R(t) are shown in the table below. At time t = 0, there are 50 000 liters of water in the tank.

t (hours)

0

1

3

6

8

R(t) (liters/hour)

1340

1190

950

740

700

Estimate R'(2). Show the work that leads to your answer. Indicate units of measure.

6b
Sme Calculator
3 marks

Use a left Riemann sum with the four subintervals indicated by the table to estimate the total amount of water removed from the tank during the 8 hours. Is this an overestimate or an underestimate of the total amount of water removed? Give a reason for your answer.

6c
Sme Calculator
2 marks

Use your answer from part (b) to find an estimate of the total amount of water in the tank, to the nearest liter, at the end of 8 hours.

6d
Sme Calculator
2 marks

For 0 \leq t \leq 8, is there a time t when the rate at which water is pumped into the tank is the same as the rate at which water is removed from the tank? Explain why or why not.

7a
Sme Calculator
2 marks

An invasive species of plant appears in a fruit grove at time t = 0 and begins to spread. The function C defined by C \left(t\right) = 7.6 \, \text{arctan} \; \left(0.2 t\right) models the number of acres in the fruit grove affected by the species t weeks after the species appears. It can be shown that C ' \left(t\right) = \frac{38}{25 + t^{2}}.

(Note: Your calculator should be in radian mode.)

Find the average number of acres affected by the invasive species from time t = 0 to time t = 4 weeks. Show the setup for your calculations.

7b
Sme Calculator
2 marks

Find the time t when the instantaneous rate of change of C equals the average rate of change of C over the time interval 0 \leq t \leq 4. Show the setup for your calculations.

7c
Sme Calculator
2 marks

Assume that the invasive species continues to spread according to the given model for all times t > 0. Write a limit expression that describes the end behavior of the rate of change in the number of acres affected by the species. Evaluate this limit expression.

7d
Sme Calculator
3 marks

At time t = 4 weeks after the invasive species appears in the fruit grove, measures are taken to counter the spread of the species. The function A, defined by A \left(t\right) = C \left(t\right) - \int_{4}^{t} 0.1 \, \text{ln} \; \left(x\right) \, \text{d}x, models the number of acres affected by the species over the time interval 4 \leq t \leq 36. At what time t, for 4 \leq t \leq 36, does A attain its maximum value? Justify your answer.

8a
Sme Calculator
3 marks

A tank has a height of 10 feet. The area of the horizontal cross section of the tank at height h feet is given by the function A, where A(h) is measured in square feet. The function A is continuous and decreases as h increases. Selected values for A(h) are given in the table below.

h (feet)

0

2

5

10

A(h) (sq ft)

50.3

14.4

6.5

2.9

Use a left Riemann sum with the three subintervals indicated by the data in the table to approximate the volume of the tank. Indicate units of measure.

8b
Sme Calculator
1 mark

Does the approximation in part (a) overestimate or underestimate the volume of the tank? Explain your reasoning.

8c
Sme Calculator
2 marks

The area, in square feet, of the horizontal cross section at height h feet is modeled by the function f given by f(h) = \dfrac{50.3}{e^{0.2h} + h}.

Based on this model, find the volume of the tank. Indicate units of measure.

8d
Sme Calculator
3 marks

Water is pumped into the tank. When the height of the water is 5 feet, the height is increasing at the rate of 0.26 foot per minute. Using the model from part (c), find the rate at which the volume of water is changing with respect to time when the height of the water is 5 feet. Indicate units of measure.

9a
Sme Calculator
3 marks

A customer at a gas station is pumping gasoline into a gas tank. The rate of flow of gasoline is modeled by a differentiable function f, where f(t) is measured in gallons per second and t is measured in seconds since pumping began. Selected values of f(t) are given in the table.

t (seconds)

0

60

90

120

135

150

f(t) (gallons per second)

0

0.1

0.15

0.1

0.05

0

Using correct units, interpret the meaning of \int_{60}^{135} f(t) \text{d} t in the context of the problem. Use a right Riemann sum with the three subintervals [60, 90], [90, 120], and [120, 135] to approximate the value of \int_{60}^{135} f(t) \text{d} t.

9b
Sme Calculator
2 marks

Must there exist a value of c, for 60 < c < 120, such that f'(c) = 0? Justify your answer.

9c
Sme Calculator
2 marks

The rate of flow of gasoline, in gallons per second, can also be modeled by g(t) = \left(\frac{t}{500}\right) \text{cos} \left(\left(\frac{t}{120}\right)^2\right) for 0 \leq t \leq 150. Using this model, find the average rate of flow of gasoline over the time interval 0 \leq t \leq 150. Show the setup for your calculations.

9d
Sme Calculator
2 marks

Using the model g defined in part (c), find the value of g'(140). Interpret the meaning of your answer in the context of the problem.

10a
Sme Calculator
2 marks

When a certain grocery store opens, it has 50 pounds of bananas on a display table. Customers remove bananas from the display table at a rate modeled by f(t) = 10 + (0.8t) \text{sin} \; (t^3/100) for 0 < t \leq 12, where f(t) is measured in pounds per hour and t is the number of hours after the store opened. After the store has been open for three hours, store employees add bananas to the display table at a rate modeled by g(t) = 3 + 2.4 \text{ln} \; (t^2 + 2t) for 3 < t \leq 12, where g(t) is measured in pounds per hour and t is the number of hours after the store opened.

How many pounds of bananas are removed from the display table during the first 2 hours the store is open?

10b
Sme Calculator
2 marks

Find f'(7). Using correct units, explain the meaning of f'(7) in the context of the problem.

10c
Sme Calculator
2 marks

Is the number of pounds of bananas on the display table increasing or decreasing at time t = 5? Give a reason for your answer.

10d
Sme Calculator
3 marks

How many pounds of bananas are on the display table at time t = 8?

11a
Sme Calculator
2 marks

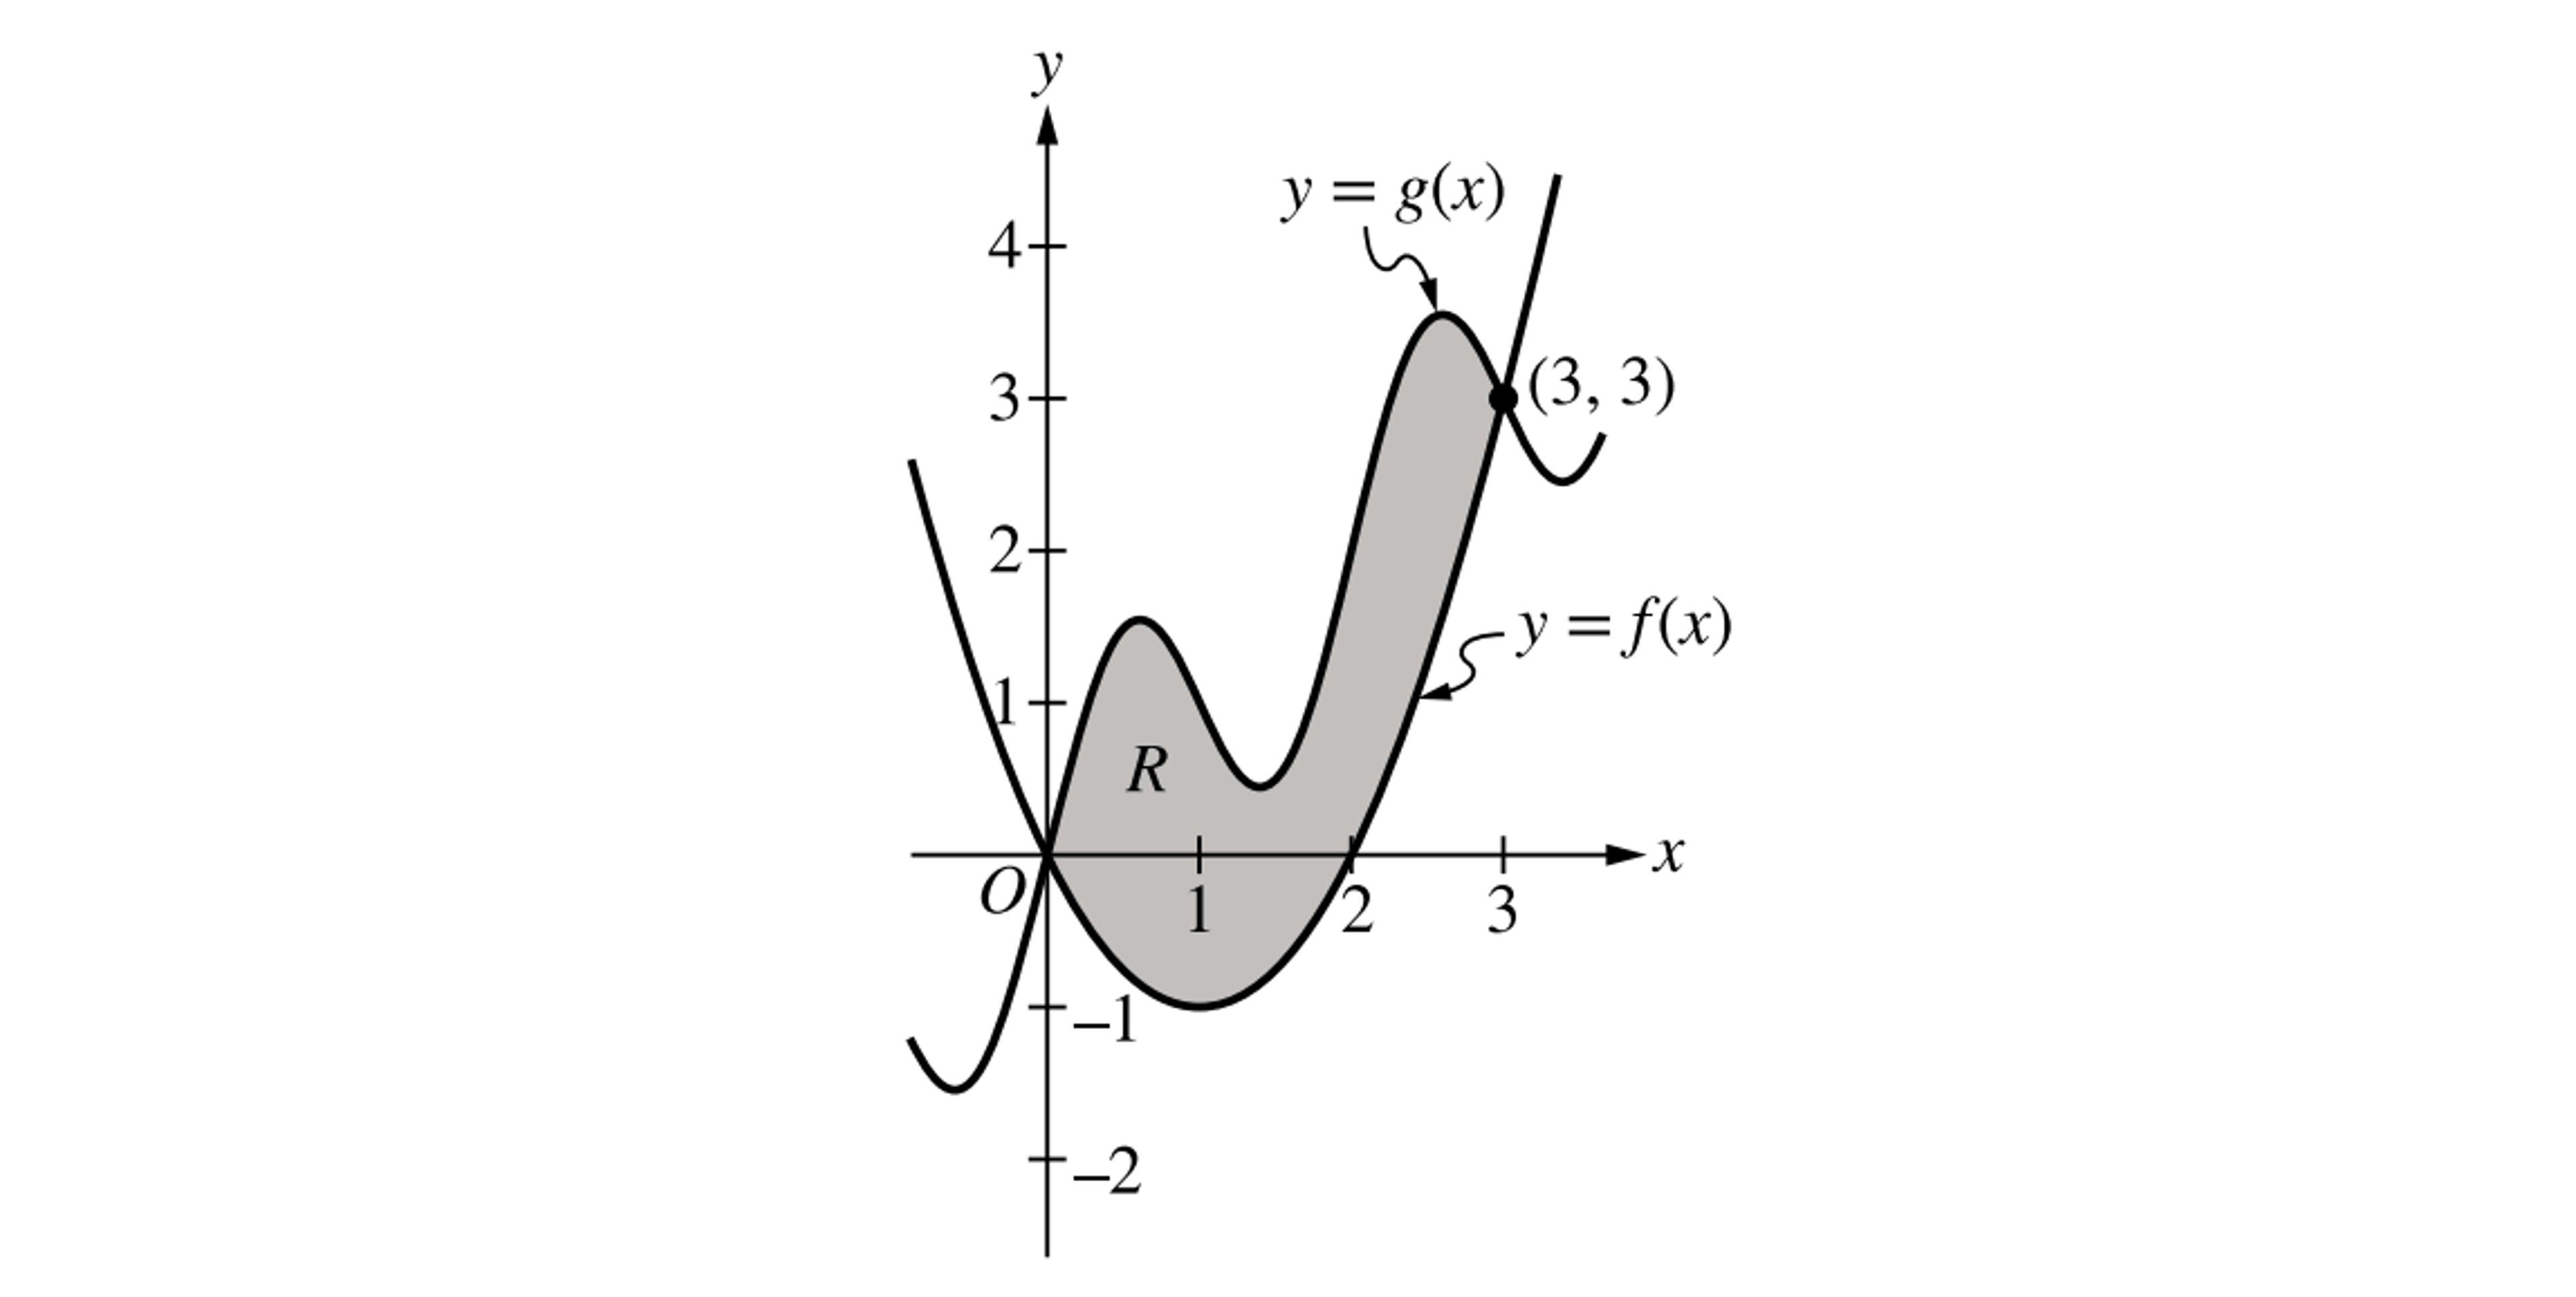
The shaded region R is bounded by the graphs of the functions f and g, where f \left(x\right) = x^{2} - 2 x and g \left(x\right) = x + \text{sin} \; \left(\pi x\right), as shown in the figure.

Shaded region R between curves y = f(x) and y = g(x) on x–y axes, from x = 0 to x = 3, with point (3, 3) marked on g(x)

(Note: Your calculator should be in radian mode.)

Find the area of R. Show the setup for your calculations.

11b
Sme Calculator
2 marks

Region R is the base of a solid. For this solid, at each x the cross section perpendicular to the x-axis is a rectangle with height x and base in region R. Find the volume of the solid. Show the setup for your calculations.

11c
Sme Calculator
3 marks

Write, but do not evaluate, an integral expression for the volume of the solid generated when the region R is rotated about the horizontal line y = - 2.

11d
Sme Calculator
2 marks

It can be shown that g ' \left(x\right) = 1 + \pi \, \text{cos} \; \left(\pi x\right). Find the value of x, for 0 < x < 1, at which the line tangent to the graph of f is parallel to the line tangent to the graph of g.

12a
Sme Calculator
2 marks

For t \geq 0, a particle moves along the x-axis. The velocity of the particle at time t is given by

v(t) = 1 + 2 \text{sin} \; \left(\frac{t^{2}}{2}\right)

The particle is at position x = 2 at time t = 4.

At time t = 4, is the particle speeding up or slowing down? Give a reason for your answer.

12b
Sme Calculator
2 marks

Find all times t in the interval 0 < t < 3 when the particle changes direction. Justify your answer.

12c
Sme Calculator
3 marks

Find the position of the particle at time t = 0.

12d
Sme Calculator
2 marks

Find the total distance the particle travels from time t = 0 to time t = 3.

13a
Sme Calculator
2 marks

A particle moves along the x-axis so that its velocity at time t \geq 0 is given by

v(t) = \ln(t^2 - 4t + 5) - 0.2t

There is one time, t = t_R, in the interval 0 < t < 2 when the particle is at rest (not moving). Find t_R. For 0 < t < t_R, is the particle moving to the right or to the left? Give a reason for your answer.

13b
Sme Calculator
2 marks

Find the acceleration of the particle at time t = 1.5. Show the setup for your calculations. Is the speed of the particle increasing or decreasing at time t = 1.5? Explain your reasoning.

13c
Sme Calculator
3 marks

The position of the particle at time t is x(t), and its position at time t = 1 is x(1) = -3. Find the position of the particle at time t = 4. Show the setup for your calculations.

13d
Sme Calculator
2 marks

Find the total distance traveled by the particle over the interval 1 \leq t \leq 4. Show the setup for your calculations.

14a
Sme Calculator
1 mark

A particle moves along the x-axis with velocity given by v(t) = \dfrac{10\,\text{sin} \; (0.4t^2)}{t^2 - t + 3} for time 0 \leq t \leq 3.5. The particle is at position x = -5 at time t = 0.

Find the acceleration of the particle at time t = 3.

14b
Sme Calculator
3 marks

Find the position of the particle at time t = 3.

14c
Sme Calculator
3 marks

Evaluate \displaystyle\int_0^{3.5} v(t)\,dt and evaluate \displaystyle\int_0^{3.5} |v(t)|\,dt. Interpret the meaning of each integral in the context of the problem.

14d
Sme Calculator
2 marks

A second particle moves along the x-axis with position given by x_2(t) = t^2 - t for 0 \leq t \leq 3.5. At what time t are the two particles moving with the same velocity?

15a
Sme Calculator
3 marks
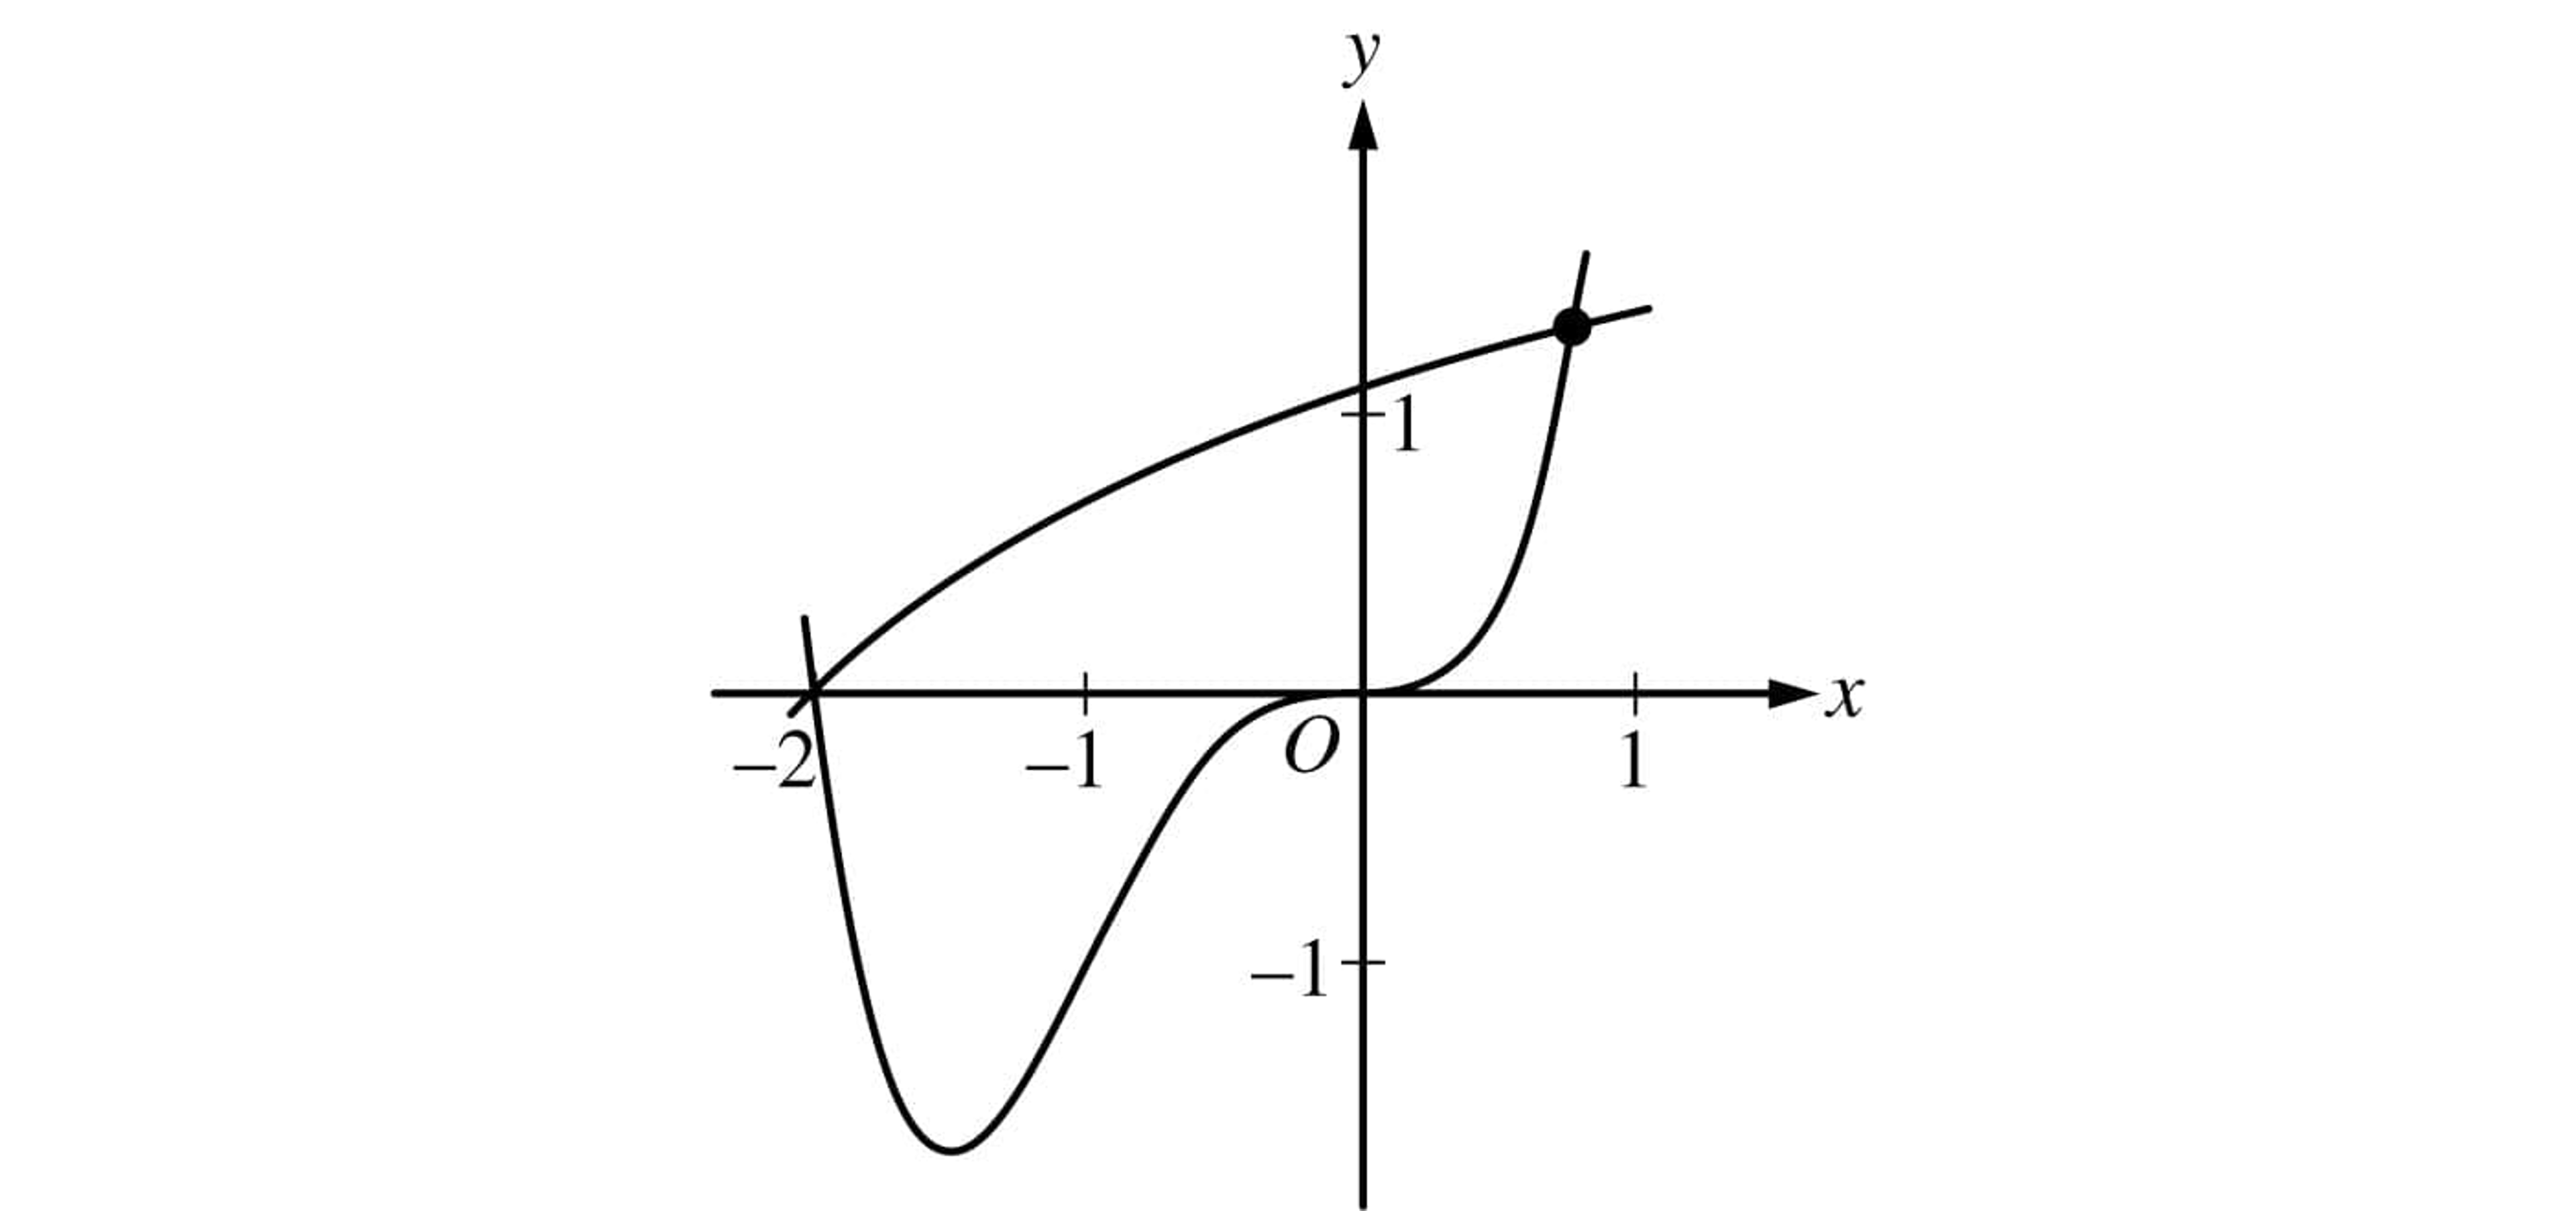
Cartesian graph with x and y axes showing a smooth curve dipping below y = −1 near x = −1.5, rising through the origin, and passing a marked point near (1, 1)

Let f and g be the functions defined by f(x) = \ln(x + 3) and g(x) = x^4 + 2x^3. The graphs of f and g, shown in the figure above, intersect at x = -2 and x = B, where B > 0.

Find the area of the region enclosed by the graphs of f and g.

15b
Sme Calculator
2 marks

For -2 \leq x \leq B, let h(x) be the vertical distance between the graphs of f and g. Is h increasing or decreasing at x = -0.5? Give a reason for your answer.

15c
Sme Calculator
2 marks

The region enclosed by the graphs of f and g is the base of a solid. Cross sections of the solid taken perpendicular to the x-axis are squares. Find the volume of the solid.

15d
Sme Calculator
2 marks

A vertical line in the xy-plane travels from left to right along the base of the solid described in part (c). The vertical line is moving at a constant rate of 7 units per second. Find the rate of change of the area of the cross section above the vertical line with respect to time when the vertical line is at position x = -0.5.

16a
Sme Calculator
2 marks

The velocity of a particle, P, moving along the x-axis is given by the differentiable function v_{P}, where v_{P}(t) is measured in meters per hour and t is measured in hours. Selected values of v_{P}(t) are shown in the table below.

t (hours)

0

0.3

1.7

2.8

4

v_{P}(t) (meters per hour)

0

55

−29

55

48

Particle P is at the origin at time t = 0.

Justify why there must be at least one time t, for 0.3 \leq t \leq 2.8, at which v_{P}'(t), the acceleration of particle P, equals 0 meters per hour per hour.

16b
Sme Calculator
1 mark

Use a trapezoidal sum with the three subintervals [0, 0.3], [0.3, 1.7], and [1.7, 2.8] to approximate the value of \displaystyle\int_{0}^{2.8} v_P(t) \, dt.

16c
Sme Calculator
3 marks

A second particle, Q, also moves along the x-axis so that its velocity for 0 \leq t \leq 4 is given by v_Q(t) = 45\sqrt{t} \cdot \text{cos} \; (0.063t^2) meters per hour. Find the time interval during which the velocity of particle Q is at least 60 meters per hour. Find the distance traveled by particle Q during the interval when the velocity of particle Q is at least 60 meters per hour.

16d
Sme Calculator
3 marks

At time t = 0, particle Q is at position x = -90. Using the result from part (b) and the function v_Q from part (c), approximate the distance between particles P and Q at time t = 2.8.

17a
Sme Calculator
3 marks

A particle, P, is moving along the x-axis. The velocity of particle P at time t is given by v_{P}(t) = \text{sin}(t^{1.5}) for 0 \leq t \leq \pi. At time t = 0, particle P is at position x = 5. A second particle, Q, also moves along the x-axis. The velocity of particle Q at time t is given by v_{Q}(t) = (t - 1.8) \cdot 1.25^{t} for 0 \leq t \leq \pi. At time t = 0, particle Q is at position x = 10.

Find the positions of particles P and Q at time t = 1.

17b
Sme Calculator
2 marks

Are particles P and Q moving toward each other or away from each other at time t = 1? Explain your reasoning.

17c
Sme Calculator
2 marks

Find the acceleration of particle Q at time t = 1. Is the speed of particle Q increasing or decreasing at time t = 1? Explain your reasoning.

17d
Sme Calculator
2 marks

Find the total distance traveled by particle P over the time interval 0 \leq t \leq \pi.

18a
Sme Calculator
2 marks

The height of a tree at time t is given by a twice-differentiable function H, where H(t) is measured in meters and t is measured in years. Selected values of H(t) are given in the table below.

t (years)

2

3

5

7

10

H(t) (meters)

1.5

2

6

11

15

Use the data in the table to estimate H'(6). Using correct units, interpret the meaning of H'(6) in the context of the problem.

18b
Sme Calculator
2 marks

Explain why there must be at least one time t, for 2 < t < 10, such that H'(t) = 2.

18c
Sme Calculator
2 marks

Use a trapezoidal sum with the four subintervals indicated by the data in the table to approximate the average height of the tree over the time interval 2 \leq t \leq 10.

18d
Sme Calculator
3 marks

The height of the tree, in meters, can also be modeled by the function G, given by G(x) = \dfrac{100x}{1+x}, where x is the diameter of the base of the tree, in meters. When the tree is 50 meters tall, the diameter of the base of the tree is increasing at a rate of 0.03 meter per year. According to this model, what is the rate of change of the height of the tree with respect to time, in meters per year, at the time when the tree is 50 meters tall?

19a
Sme Calculator
2 marks

Stephen swims back and forth along a straight path in a 50-meter-long pool for 90 seconds. Stephen's velocity is modeled by v(t) = 2.38 e^{-0.02 t} \text{sin} \left(\frac{\pi}{56} t\right), where t is measured in seconds and v(t) is measured in meters per second.

Find all times t in the interval 0 < t < 90 at which Stephen changes direction. Give a reason for your answer.

19b
Sme Calculator
3 marks

Find Stephen's acceleration at time t = 60 seconds. Show the setup for your calculations, and indicate units of measure. Is Stephen speeding up or slowing down at time t = 60 seconds? Give a reason for your answer.

19c
Sme Calculator
2 marks

Find the distance between Stephen's position at time t = 20 seconds and his position at time t = 80 seconds. Show the setup for your calculations.

19d
Sme Calculator
2 marks

Find the total distance Stephen swims over the time interval 0 \leq t \leq 90 seconds. Show the setup for your calculations.

20a
Sme Calculator
2 marks

Two particles move along the x-axis. For 0 \leq t \leq 8, the position of particle P at time t is given by x_P(t) = \text{ln} \; (t^2 - 2t + 10), while the velocity of particle Q at time t is given by v_Q(t) = t^2 - 8t + 15. Particle Q is at position x = 5 at time t = 0.

For 0 \leq t \leq 8, when is particle P moving to the left?

20b
Sme Calculator
2 marks

For 0 \leq t \leq 8, find all times t during which the two particles travel in the same direction.

20c
Sme Calculator
2 marks

Find the acceleration of particle Q at time t = 2. Is the speed of particle Q increasing, decreasing, or neither at time t = 2? Explain your reasoning.

20d
Sme Calculator
3 marks

Find the position of particle Q the first time it changes direction.

21a
Sme Calculator
2 marks

A student starts reading a book at time t = 0 minutes and continues reading for the next 10 minutes. The rate at which the student reads is modeled by the differentiable function R, where R \left(t\right) is measured in words per minute. Selected values of R \left(t\right) are given in the table shown.

t (minutes)

0

2

8

10

R \left(t\right) (words per minute)

90

100

150

162

Approximate R ' \left(1\right) using the average rate of change of R over the interval 0 \leq t \leq 2. Show the work that leads to your answer. Indicate units of measure.

21b
Sme Calculator
2 marks

Must there be a value c, for 0 < c < 10, such that R \left(c\right) = 155? Justify your answer.

21c
Sme Calculator
2 marks

Use a trapezoidal sum with the three subintervals indicated by the data in the table to approximate the value of \int_{0}^{10} R \left(t\right) \, \text{d}t. Show the work that leads to your answer.

21d
Sme Calculator
3 marks

A teacher also starts reading at time t = 0 minutes and continues reading for the next 10 minutes. The rate at which the teacher reads is modeled by the function W defined by W \left(t\right) = - \frac{3}{10} t^{2} + 8 t + 100, where W \left(t\right) is measured in words per minute. Based on the model, how many words has the teacher read by the end of the 10 minutes? Show the work that leads to your answer.

22a
Sme Calculator
3 marks
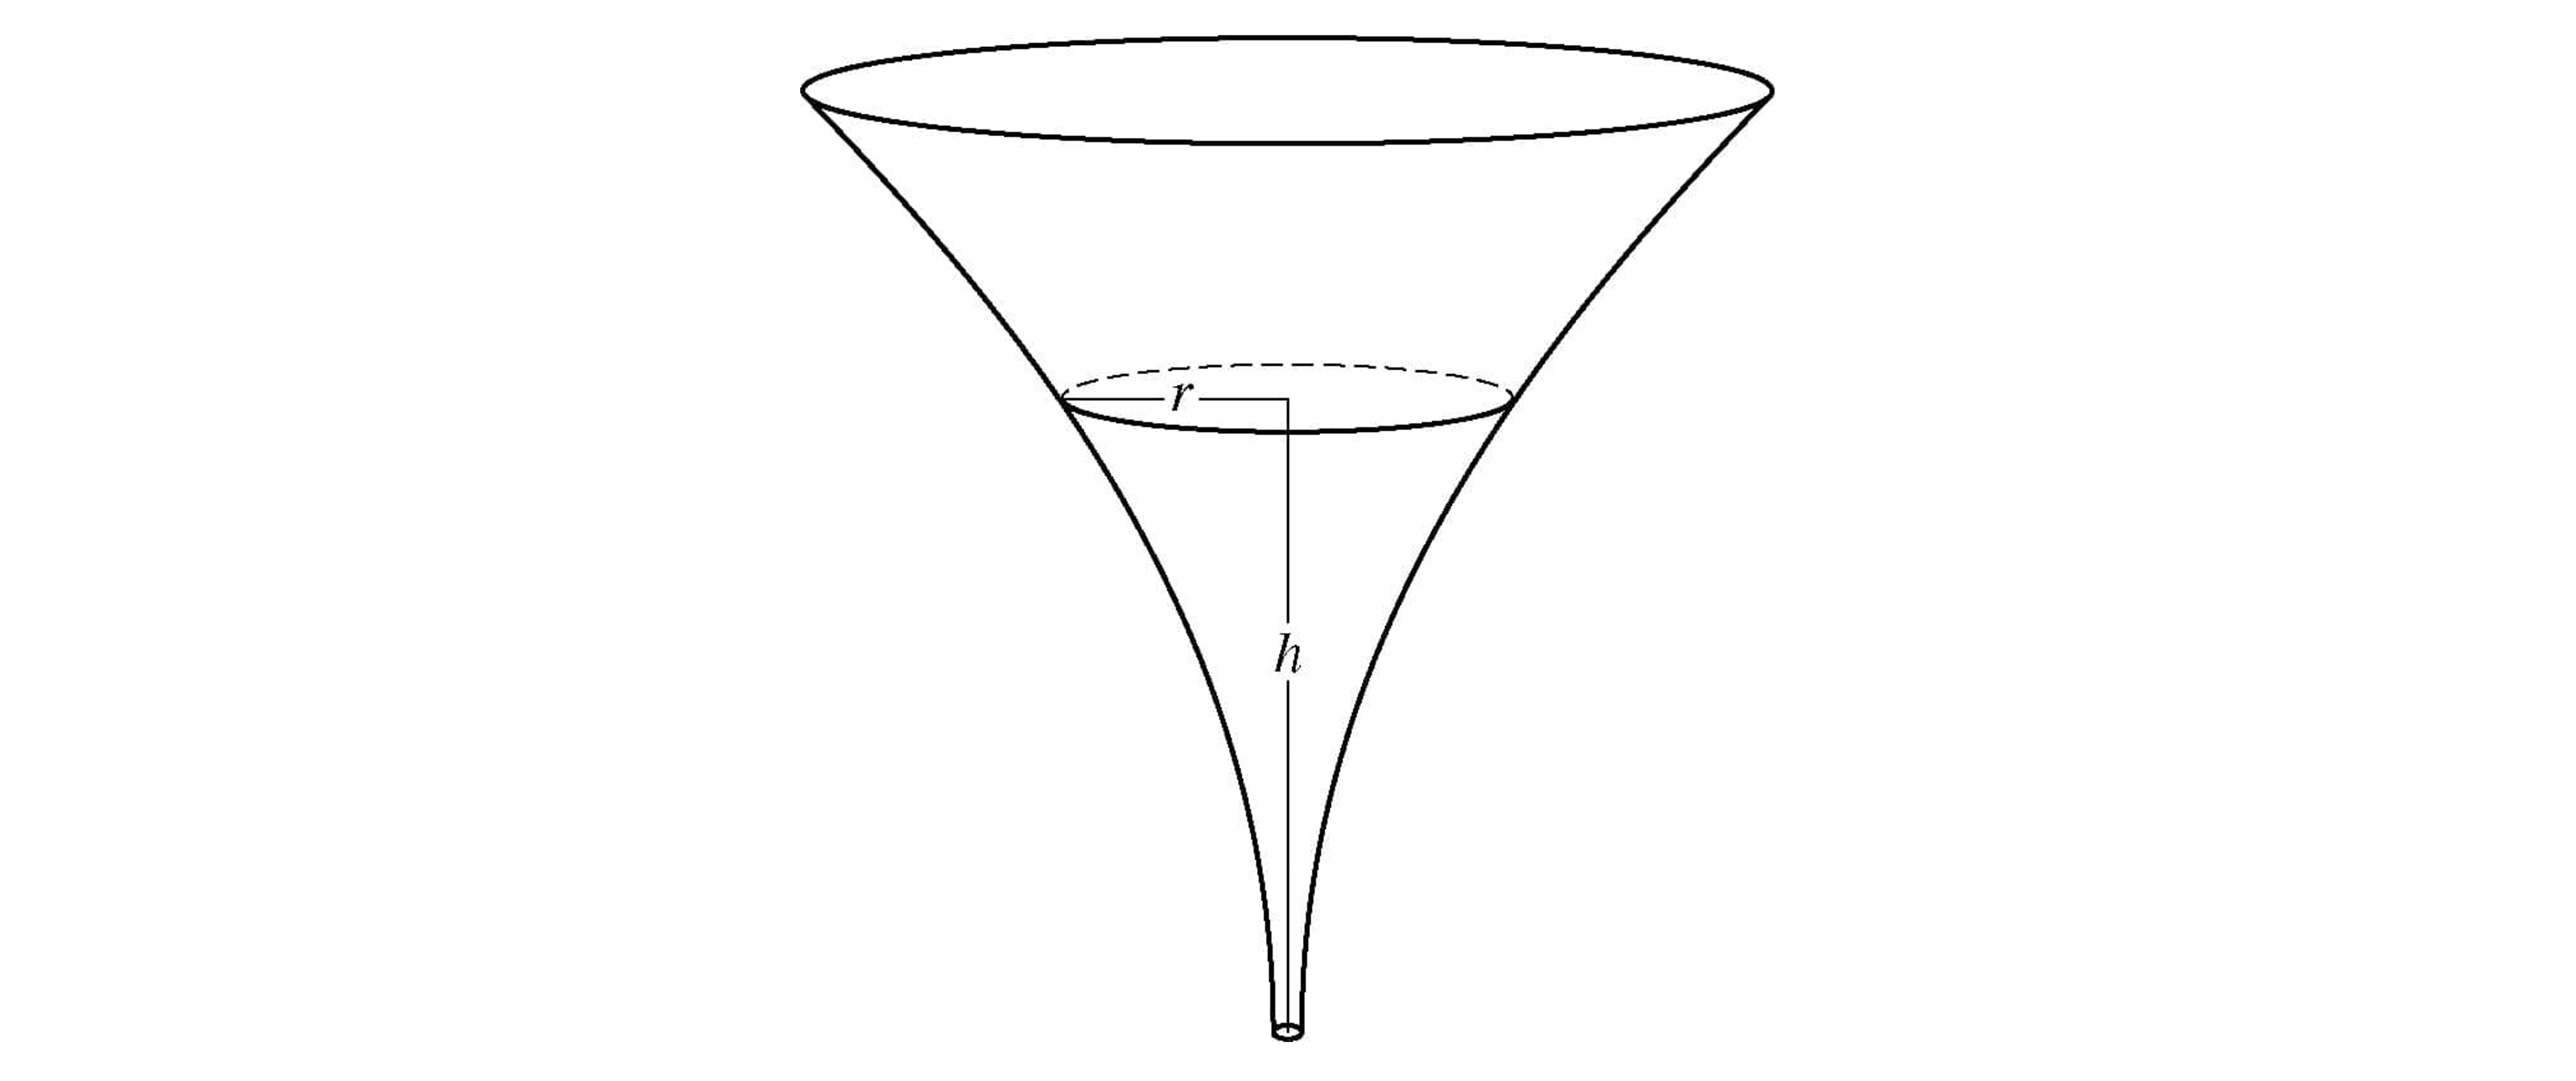
Diagram of an inverted cone with a smaller circular water surface inside, labelled radius r and water depth h measured vertically from the surface to the tip

The inside of a funnel of height 10 inches has circular cross sections, as shown in the figure above. At height h, the radius of the funnel is given by

r = \frac{1}{20}(3 + h^{2})

where 0 \leq h \leq 10. The units of r and h are inches.

Find the average value of the radius of the funnel.

22b
Sme Calculator
3 marks

Find the volume of the funnel.

22c
Sme Calculator
3 marks

The funnel contains liquid that is draining from the bottom. At the instant when the height of the liquid is h = 3 inches, the radius of the surface of the liquid is decreasing at a rate of \dfrac{1}{5} inch per second. At this instant, what is the rate of change of the height of the liquid with respect to time?

23a
Sme Calculator
2 marks

Two particles, H and J, are moving along the x-axis. For 0 \leq t \leq 5, the position of particle H at time t is given by x_{H} \left(t\right) = \text{e}^{t^{2} - 4 t} and the velocity of particle J at time t is given by v_{J} \left(t\right) = 2 t \left(t^{2} - 1\right)^{3}.

Find the velocity of particle H at time t = 1. Show the work that leads to your answer.

23b
Sme Calculator
3 marks

During what open intervals of time t, for 0 < t < 5, are particles H and J moving in opposite directions? Give a reason for your answer.

23c
Sme Calculator
1 mark

It can be shown that v_{J} ' \left(2\right) > 0. Is the speed of particle J increasing, decreasing, or neither at time t = 2? Give a reason for your answer.

23d
Sme Calculator
3 marks

Particle J is at position x = 7 at time t = 0. Find the position of particle J at time t = 2. Show the work that leads to your answer.

24a
Sme Calculator
3 marks
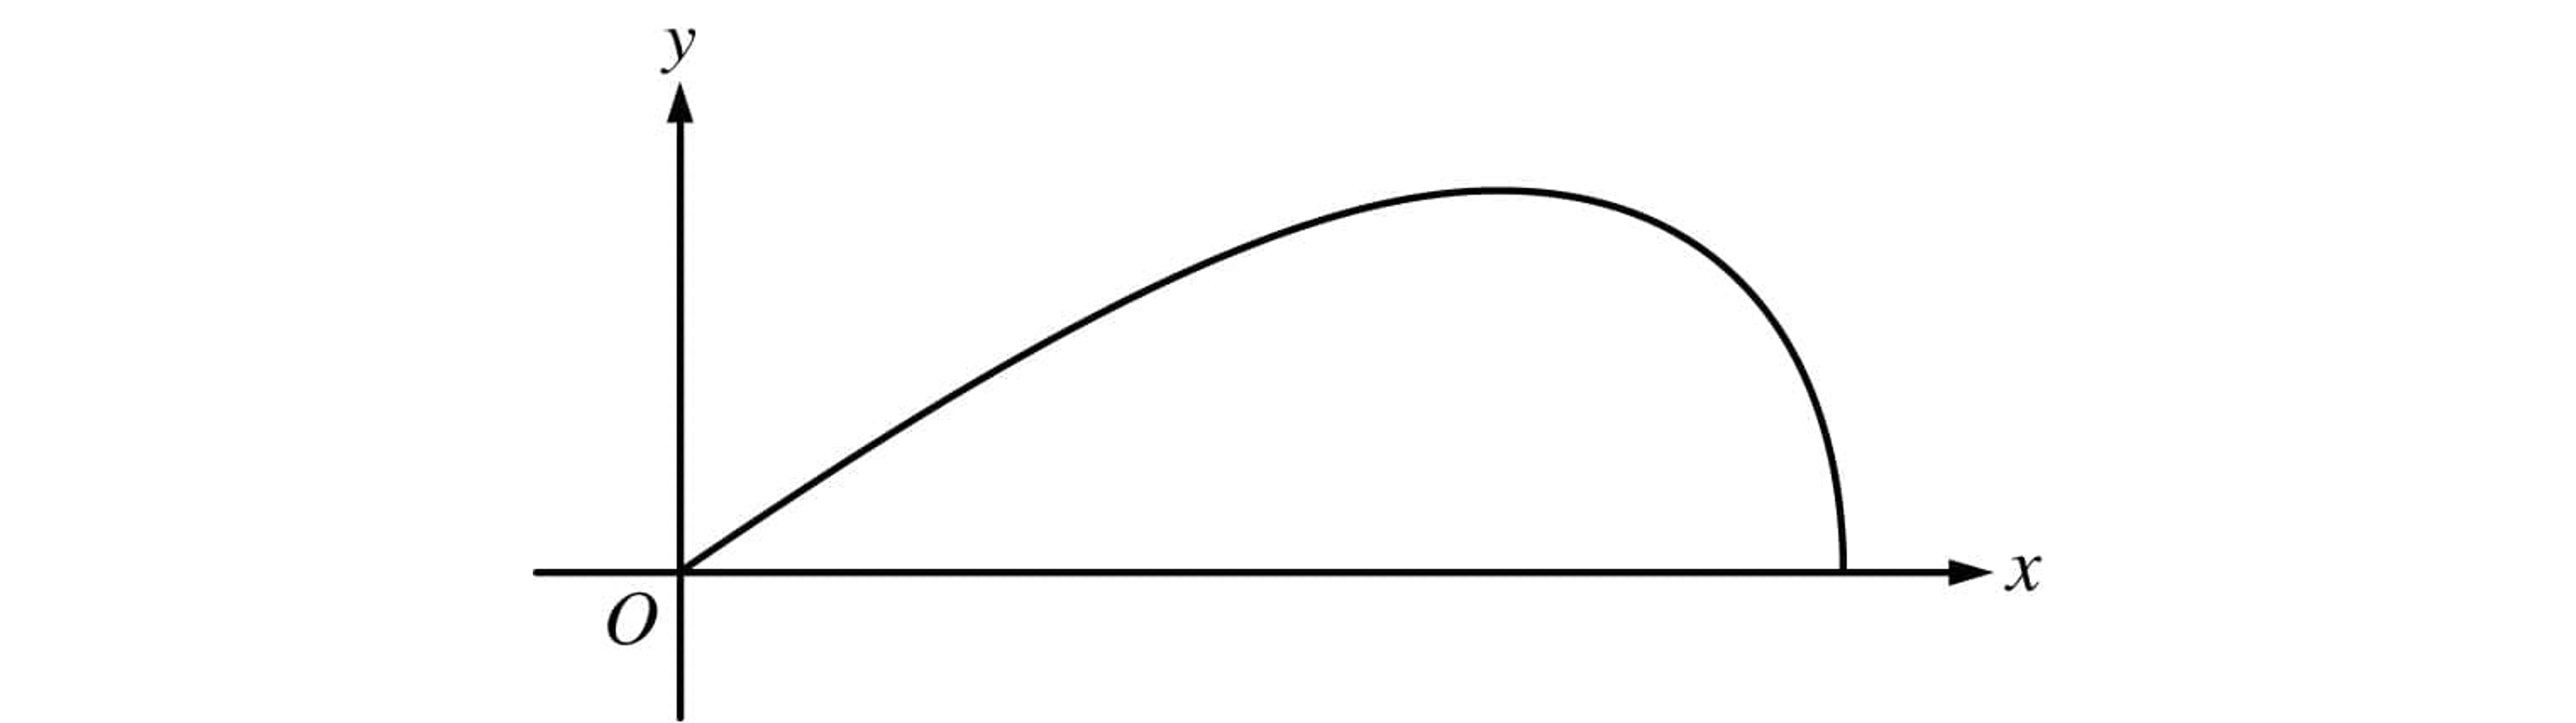
Cartesian axes with origin O and a smooth curve starting at the origin, rising to a maximum, then bending down to meet the positive x-axis again

A company designs spinning toys using the family of functions y = cx\sqrt{4 - x^2}, where c is a positive constant. The figure above shows the region in the first quadrant bounded by the x-axis and the graph of y = cx\sqrt{4 - x^2}, for some c. Each spinning toy is in the shape of the solid generated when such a region is revolved about the x-axis. Both x and y are measured in inches.

Find the area of the region in the first quadrant bounded by the x-axis and the graph of y = cx\sqrt{4 - x^2} for c = 6.

24b
Sme Calculator
2 marks

It is known that, for y = cx\sqrt{4-x^2}, \dfrac{\text{d}y}{\text{d}x} = c\,\dfrac{4 - 2x^2}{\sqrt{4 - x^2}}. For a particular spinning toy, the radius of the largest cross-sectional circular slice is 1.2 inches. What is the value of c for this spinning toy?

24c
Sme Calculator
4 marks

For another spinning toy, the volume is 2\pi cubic inches. What is the value of c for this spinning toy?

25a
Sme Calculator
1 mark

Particle P moves along the x-axis such that, for time t > 0, its position is given by x_P(t) = 6 - 4e^{-t}. Particle Q moves along the y-axis such that, for time t > 0, its velocity is given by v_Q(t) = \dfrac{1}{t^2}. At time t = 1, the position of particle Q is y_Q(1) = 2.

Find v_P(t), the velocity of particle P at time t.

25b
Sme Calculator
3 marks

Find a_Q(t), the acceleration of particle Q at time t. Find all times t, for t > 0, when the speed of particle Q is decreasing. Justify your answer.

25c
Sme Calculator
3 marks

Find y_Q(t), the position of particle Q at time t.

25d
Sme Calculator
2 marks

As t \to \infty, which particle will eventually be farther from the origin? Give a reason for your answer.

26a
Sme Calculator
4 marks

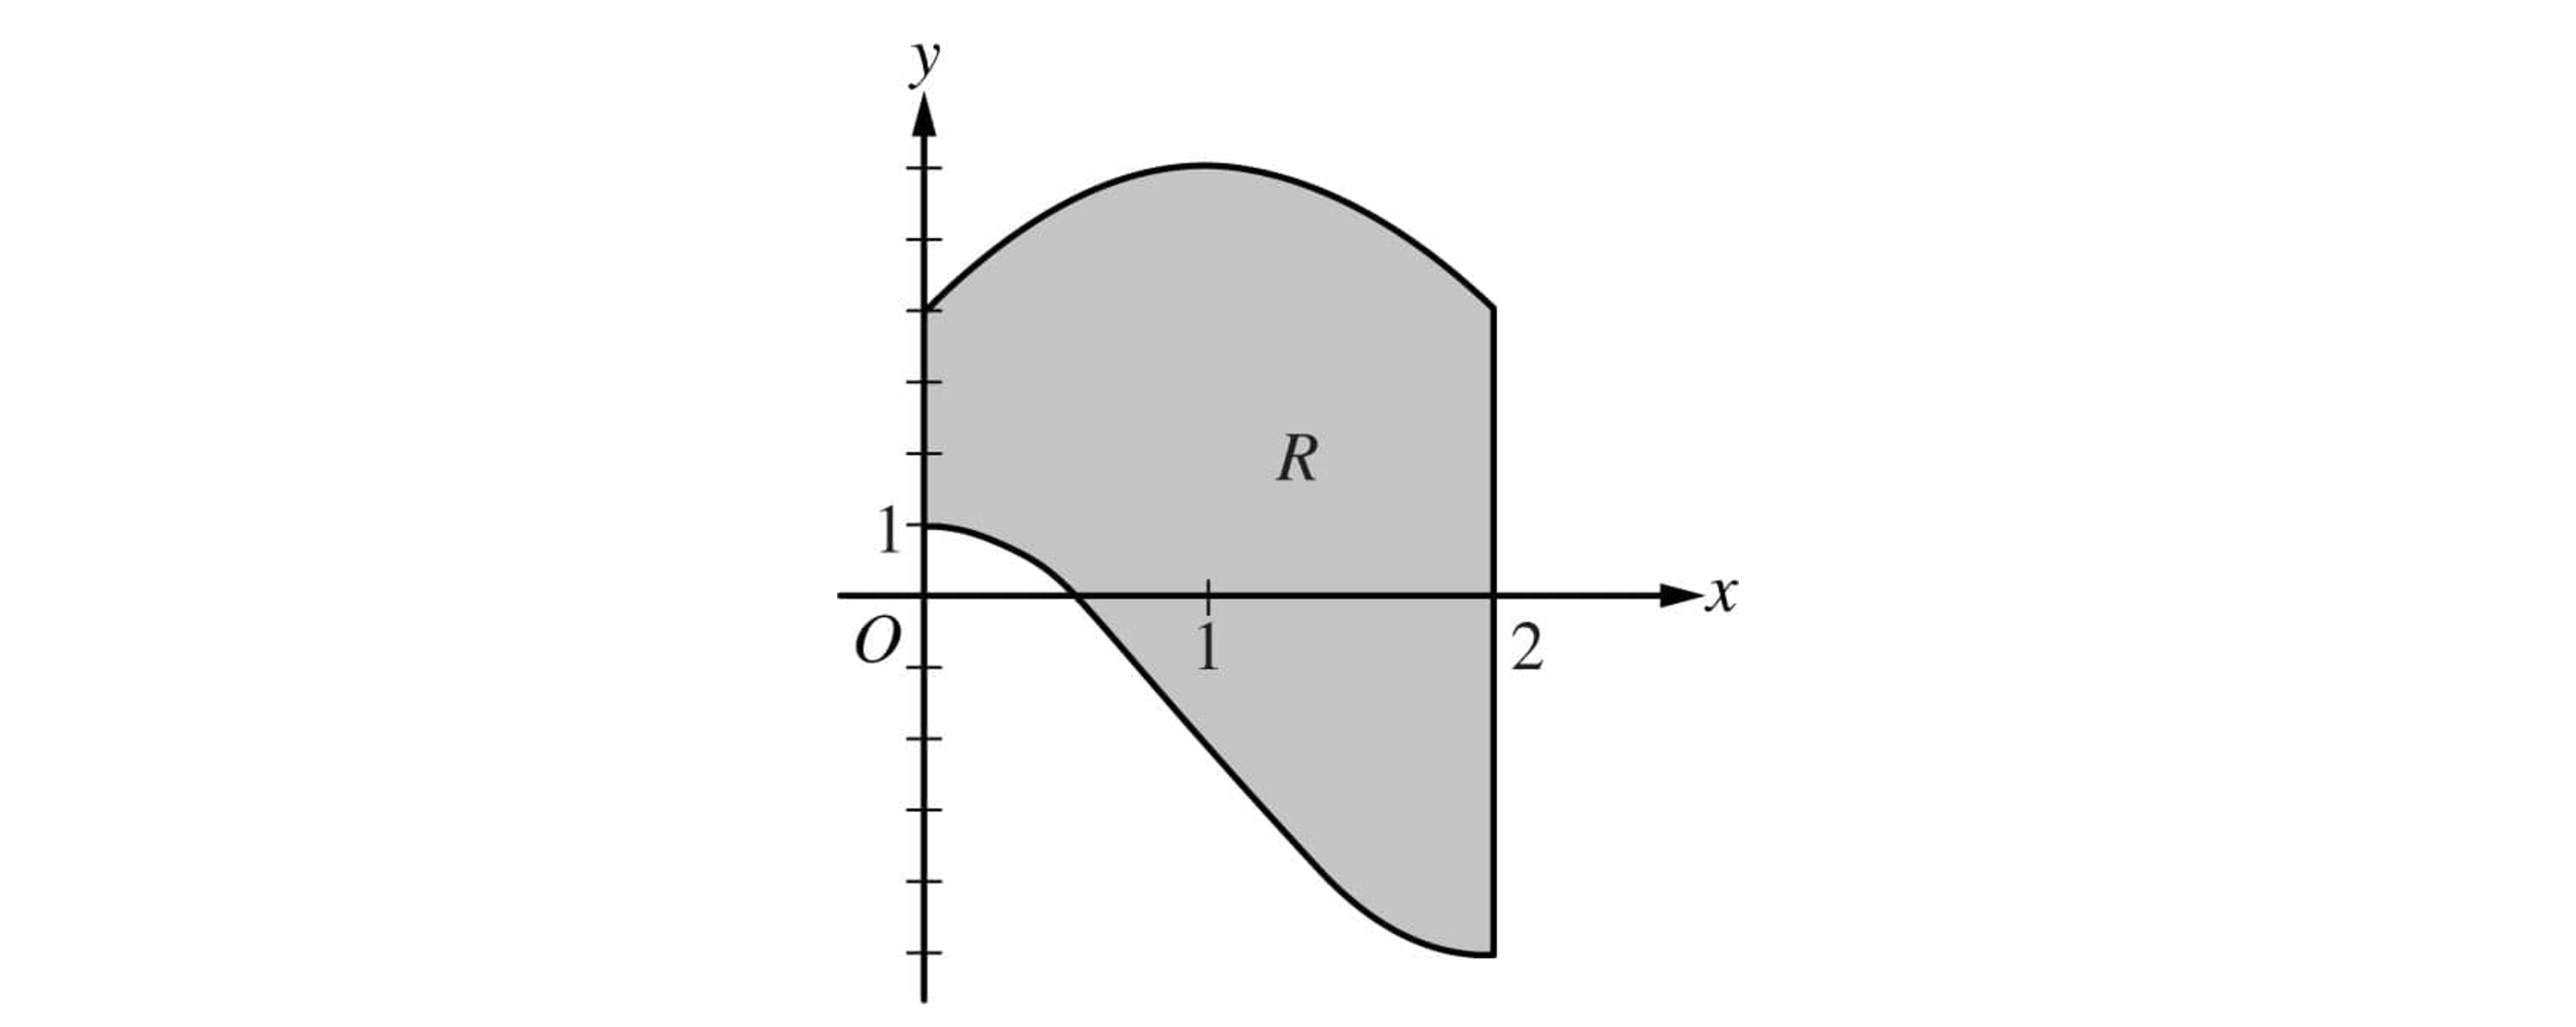
Let R be the region enclosed by the graphs of g\left(x\right) = -2 + 3\text{cos}\left(\frac{\pi}{2}x\right) and h\left(x\right) = 6 - 2\left(x-1\right)^{2}, the y-axis, and the vertical line x = 2, as shown in the figure below.

Shaded region R on Cartesian axes, bounded by curves between x = 0 and x = 2, crossing the x-axis near x = 1 and extending above and below it

Find the area of R.

26b
Sme Calculator
2 marks

Region R is the base of a solid. For the solid, at each x the cross section perpendicular to the x-axis has area A\left(x\right) = \dfrac{1}{x+3}. Find the volume of the solid.

26c
Sme Calculator
3 marks

Write, but do not evaluate, an integral expression that gives the volume of the solid generated when R is rotated about the horizontal line y = 6.

27a
Sme Calculator
2 marks

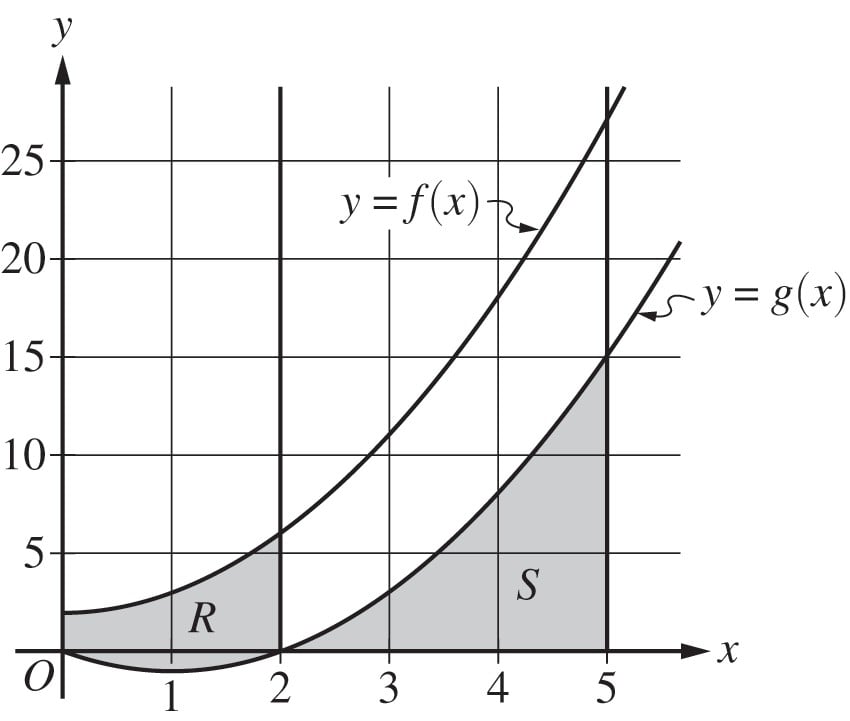
The functions f and g are defined by f(x) = x^2 + 2 and g(x) = x^2 - 2x, as shown in the graph.

Graph of curves y = f(x) and y = g(x) with shaded regions R (0≤x≤2 under f) and S (2≤x≤5 between g and the x-axis) on x–y axes up to 25.

Let R be the region bounded by the graphs of f and g, from x = 0 to x = 2, as shown in the graph. Write, but do not evaluate, an integral expression that gives the area of region R.

27b
Sme Calculator
4 marks

Let S be the region bounded by the graph of g(x) = x^2 - 2x and the x-axis, from x = 2 to x = 5, as shown in the graph. Region S is the base of a solid. For this solid, at each x the cross section perpendicular to the x-axis is a rectangle with height equal to half its base in region S. Find the volume of the solid. Show the work that leads to your answer.

27c
Sme Calculator
3 marks

Write, but do not evaluate, an integral expression that gives the volume of the solid generated when region S, as described in part (b), is rotated about the horizontal line y = 20.