Graphs of f, f' & f'' (College Board AP® Calculus AB): Revision Note

Graphs of f, f' & f''
How do I sketch the graph of a function?
You should already be familiar with the general shapes of the graphs of common functions, including
Linear functions
Quadratic Functions
Cubic and higher order polynomial functions
Trigonometric functions
Exponential and logarithmic functions
Reciprocals and reciprocal powers of , e.g.
You should also consider:
The domain of the function
The range is also useful, but you may need to use the candidates test for global extrema to find it
For which values of is undefined?
There will be a vertical asymptote at these points
E.g. at on
The limit of the function as it tends to
This can help you find a horizontal asymptote
E.g. at on
Is the function symmetrical in any way?
Is the function even, where
or odd, where ?
Does the graph repeat in some way, i.e. is it periodic?
i.e. for some constant
How can derivatives help me sketch the graph of a function?
Derivatives help identify key features and properties of the graph of a function
Recall the following properties of the first and second derivatives shown in the table below
Type of point | First derivative | Second derivative |
|---|---|---|
Local minimum | Zero | Positive or zero |
Local maximum | Zero | Negative or zero |
Point of inflection (critical) | Zero | Zero |
Point of inflection (non-critical) | Non-zero | Zero |
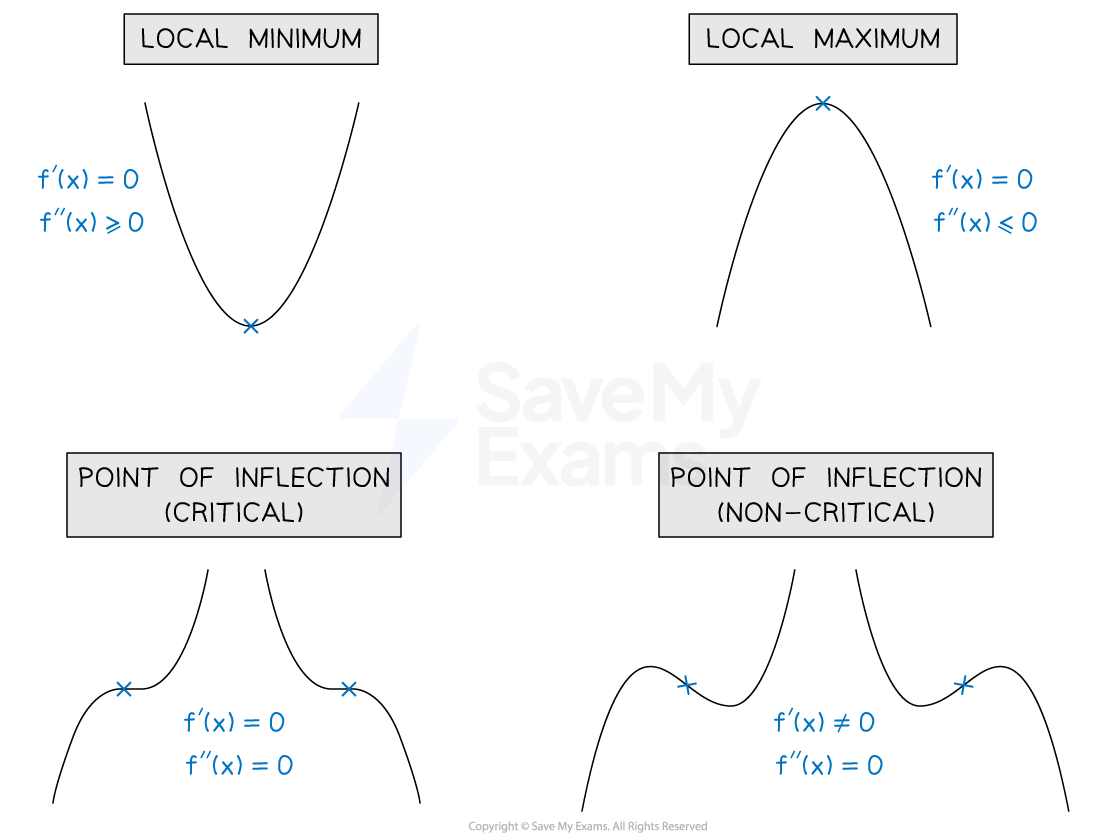
Knowing these facts and what they look like graphically (shown in the image above)
can help you sketch the graph of a function from its derivative
Remember that critical points also occur where the first derivative does not exist
At these points, the function itself must still be defined
A critical point where the first derivative does not exist is often where the tangent to the graph is vertical
E.g. at on the graph of
How can I find key features of the graph of f using the graph of f'?
You might be given the graph of the first derivative, and asked to identify features of the graph of
The table below shows how the two graphs are related
If the graph of ... | Then the graph of ... |
|---|---|
Is above the -axis | Is increasing |
Is below the -axis | Is decreasing |
Crosses through the -axis | Has a local minimum or local maximum critical point |
Touches the -axis and rebounds | Has a critical point of inflection |
Is increasing | Is concave up |
Is decreasing | Is concave down |
Has a local minimum or local maximum critical point | Has a point of inflection |
How can I find key features of the graph of f using the graph of f''?
You might be given the graph of the second derivative, and asked to identify features of the graph of
The table below shows how the two graphs are related
If the graph of ... | Then the graph of ... |
|---|---|
Is above the -axis | Is concave up |
Is below the -axis | Is concave down |
Crosses through the -axis | Has a point of inflection |
Examiner Tips and Tricks
Make sure you refer explicitly to the relevant function in your answer. It can be confusing if you say "it is continuous" because the reader will not know what you mean by "it". It is much better to use the name of the function, such as, " is continuous".
Worked Example
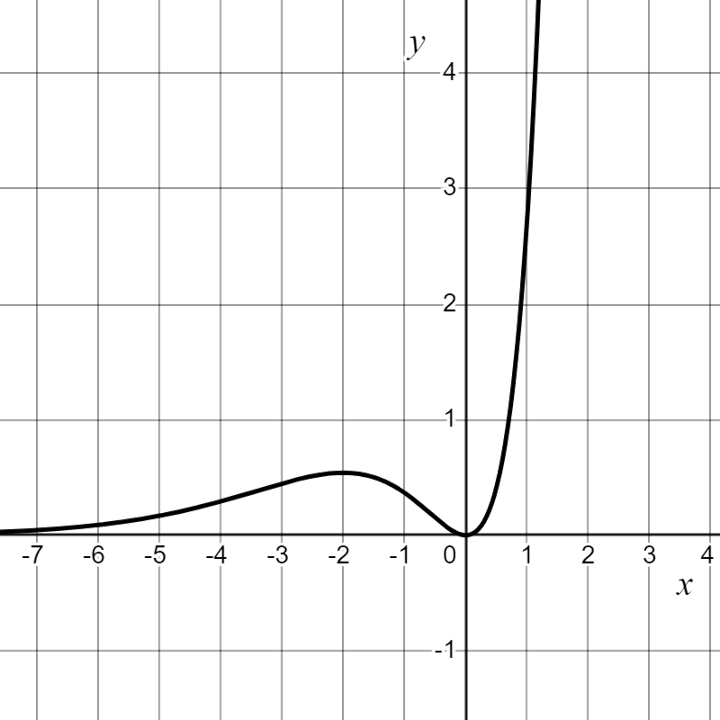
The graph of , the derivative of the function , is shown above. It has a local maximum at and a local minimum at . Which of the following statements must be true?
i. has a critical point at .
ii. The graph of has a point of inflection at .
iii. The graph of is concave up for .
iv. The function is increasing for .
(A) i and ii only (B) i, ii, and iii only (C) i, ii, and iv only (D) i, ii, iii, and iv
Answer:
Let's look at each statement in turn to determine whether it is true or not
i. has a critical point at .
This is true as at
therefore it is a critical point
ii. The graph of has a point of inflection at .
A point of inflection must have , so we must consider the slope of the graph of
A tangent drawn at on would be horizontal
therefore , so it could be a point of inflection
We still need to check whether the second derivative changes sign
To the left of , the graph of is increasing, so will be positive
To the right of , the graph of is decreasing, so will be negative
The sign of the second derivative changes at , so it is a point of inflection
Therefore statement ii is true
iii. The graph of is concave up for .
Concave up is when , so we need to consider whether or not the slope of is always positive
The graph of slopes downwards between and
therefore is decreasing on that interval; is negative
Therefore statement iii is false.
iv. The function is increasing for .
For a function to be increasing, must be non-negative
The graph of is above or on the -axis between -7 and 1, therefore is always increasing in this interval
Therefore statement iv is correct
So statements i, ii, and iv are true
Option (C)
Worked Example
Let be the function is defined by .
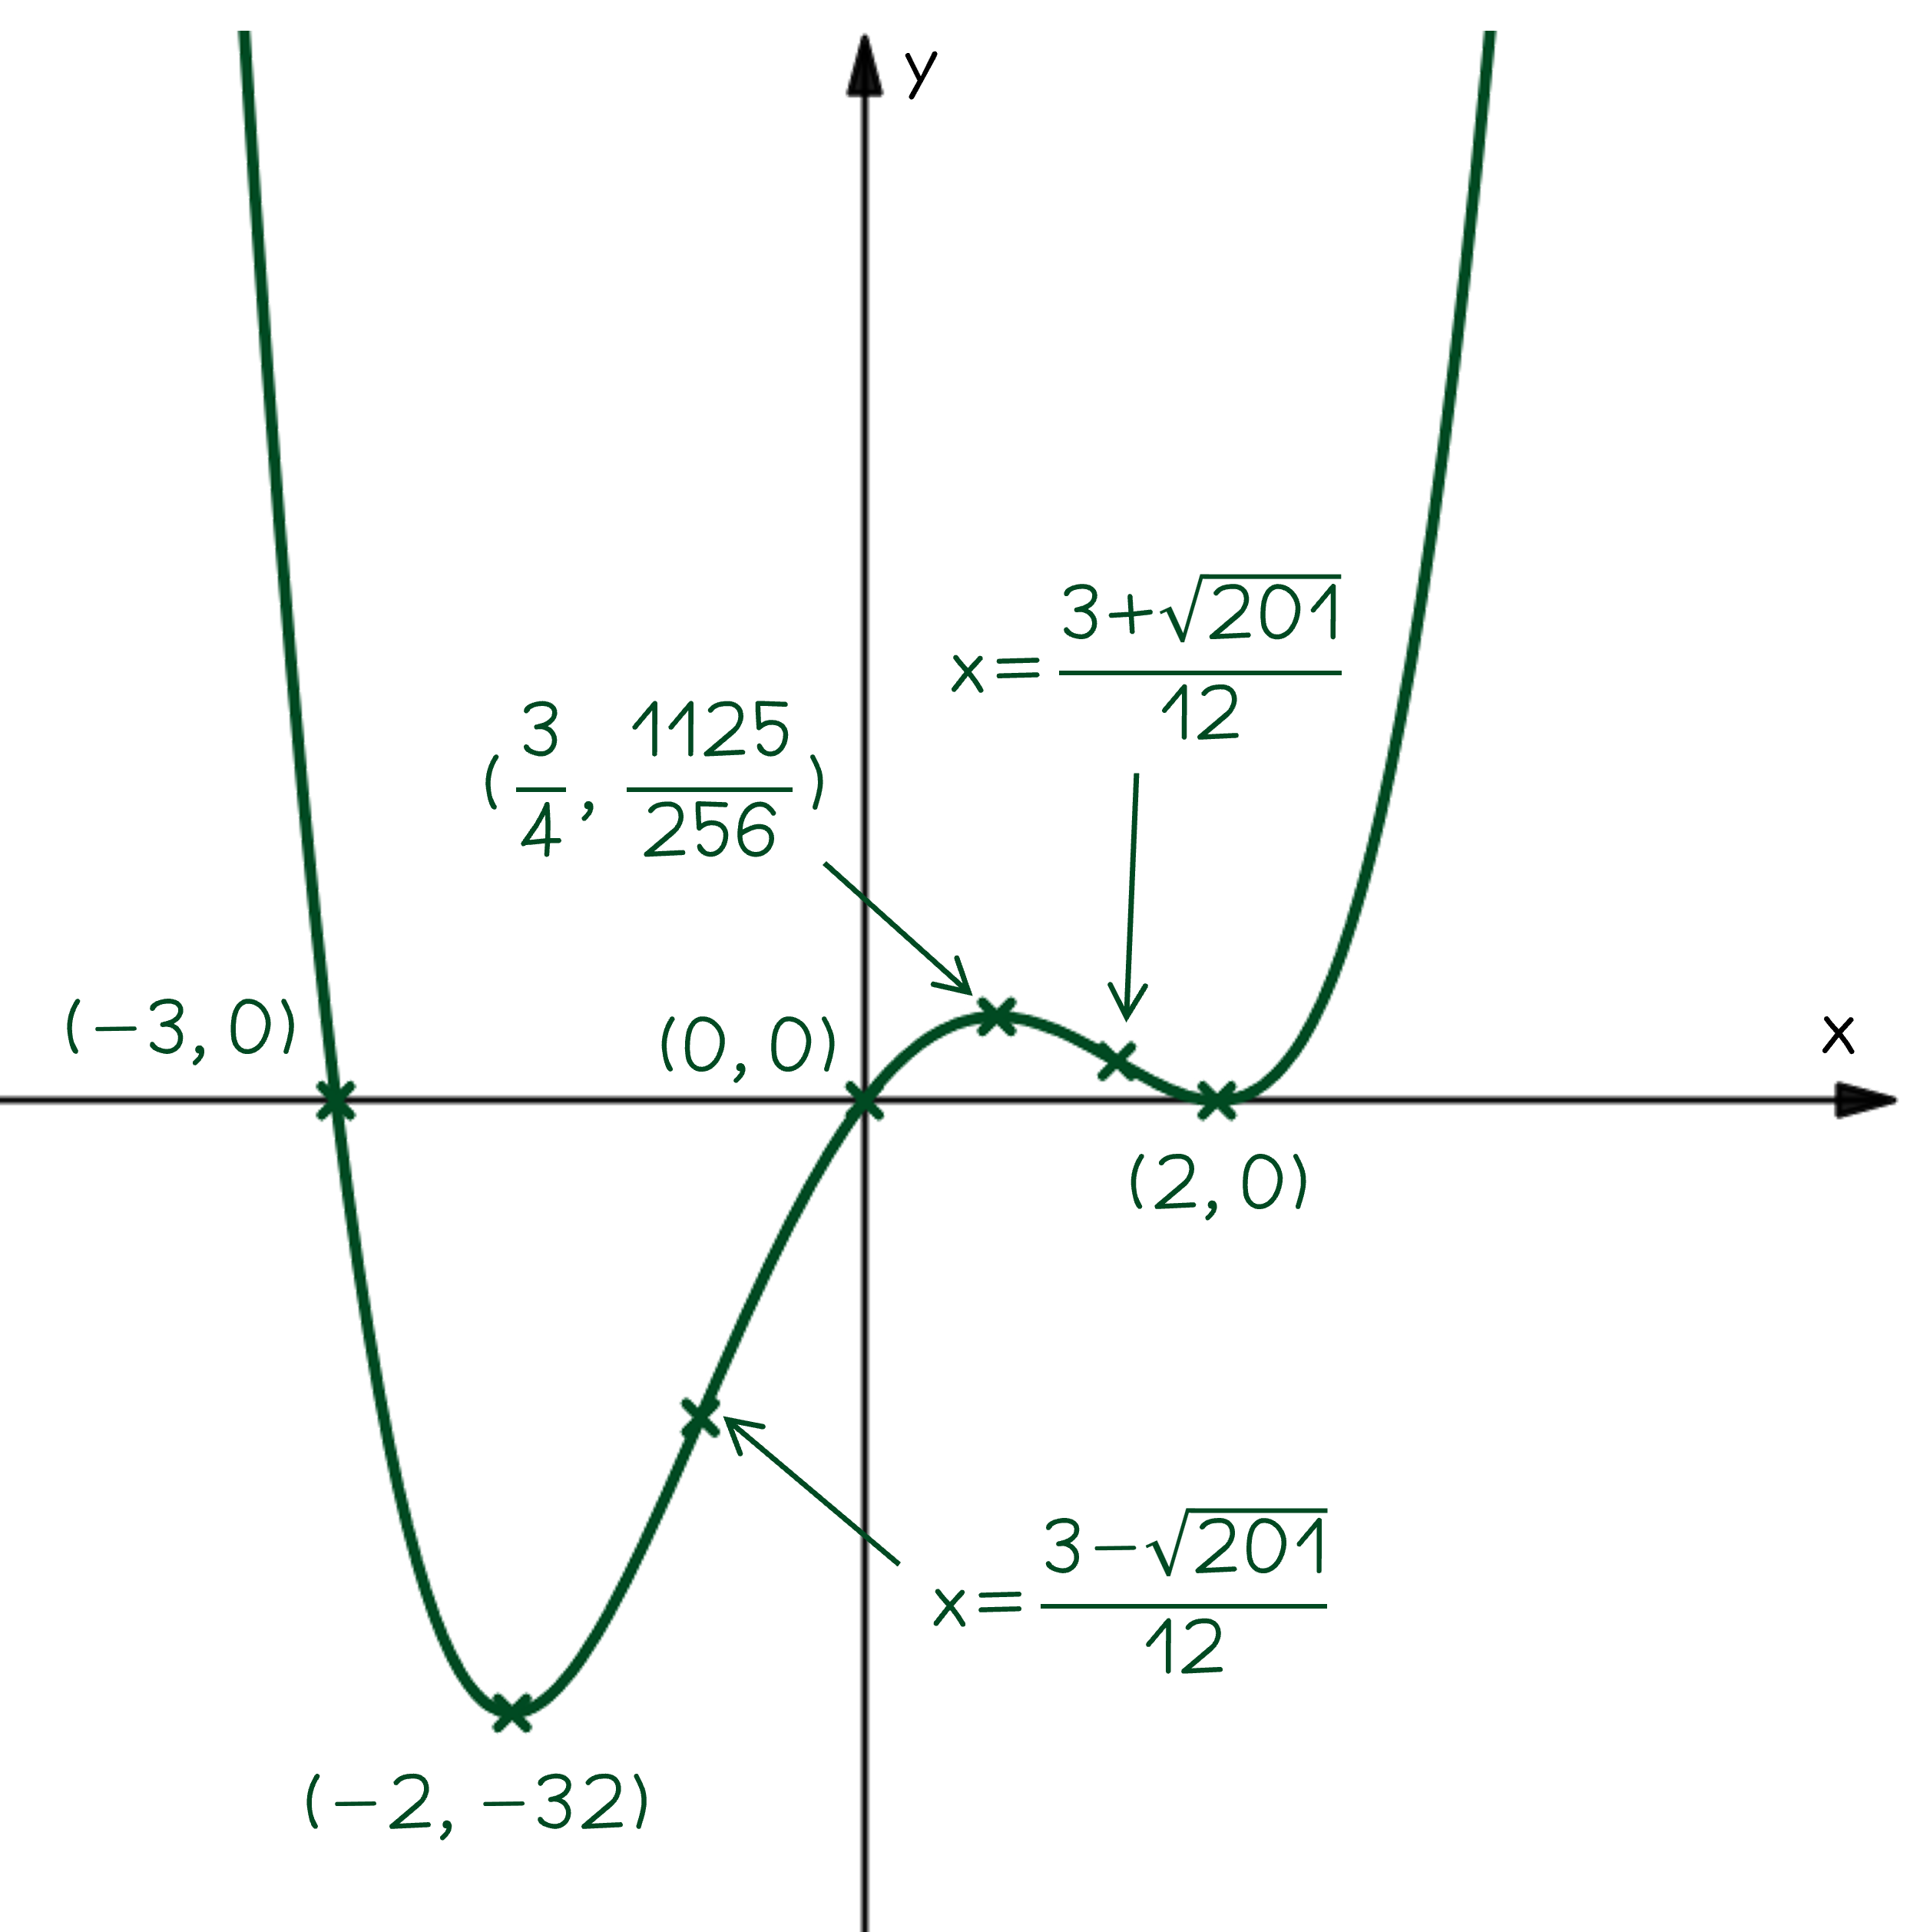
Sketch the graph of , labeling the coordinates of any axes intercepts and critical points, and stating the values of any points of inflection.
Answer:
By inspecting the function, it can be seen that it is a positive quartic (i.e. highest power of is 4)
This means overall it will have a w-shape, and will tend toward as tends to
The roots can also be found easily, by setting
Roots at and , and a repeated root at
Find any critical points where the first derivative is zero
Expand the equation first to make this easier
You could solve this on your calculator, or by factoring
Critical points at
Put these values into to find the -coordinates
Critical points at (2, 0), (-2, -32), and
This should be enough information to sketch the shape of the graph and its critical points, but it can be useful to check the concavity of each critical point
Use the second derivative to do this
, positive, so u-shaped at (a minimum)
, negative, so n-shaped at (a maximum)
, positive, so u-shaped at (a minimum)
Check for any points of inflection, where the second derivative is equal to zero
All points of inflection have , but some critical points will also have . However we have already found all the critical points, so any remaining points where must be a point of inflection
or
These points of inflection are where the graph changes concavity, so will be in between the local minimums and maximums
Sketch the graph, labeling all the points as asked in the question

Unlock more, it's free!
Join the 100,000+ Students that ❤️ Save My Exams
the (exam) results speak for themselves:

Was this revision note helpful?
Build on this topic
