Estimating the Derivative at a Point (College Board AP® Calculus AB): Revision Note

Estimating derivatives at a point using a graph
How can I estimate a derivative at a point using points on the graph?
The coordinates of the points that lie on the graph of a function can be used to estimate the derivative at a point
Recall that the derivative of at the point where , denoted as ,
is equal to the slope of the tangent to the graph of at
To approximate the slope of the tangent to the graph of at :
Find the slope of line segments joining nearby points that lie on the graph
The function must be continuous and differentiable within the relevant interval for this method to be valid
Consider the graph of below, where points are labeled with their coordinates

To estimate the derivative at point you can find the slope of the nearest secant line
Finding the slope between and
How can I estimate a derivative at a point using a tangent line?
To estimate the derivative of a function at a point
Draw a tangent to the curve at the point
Pick two points on the line
Calculate the slope
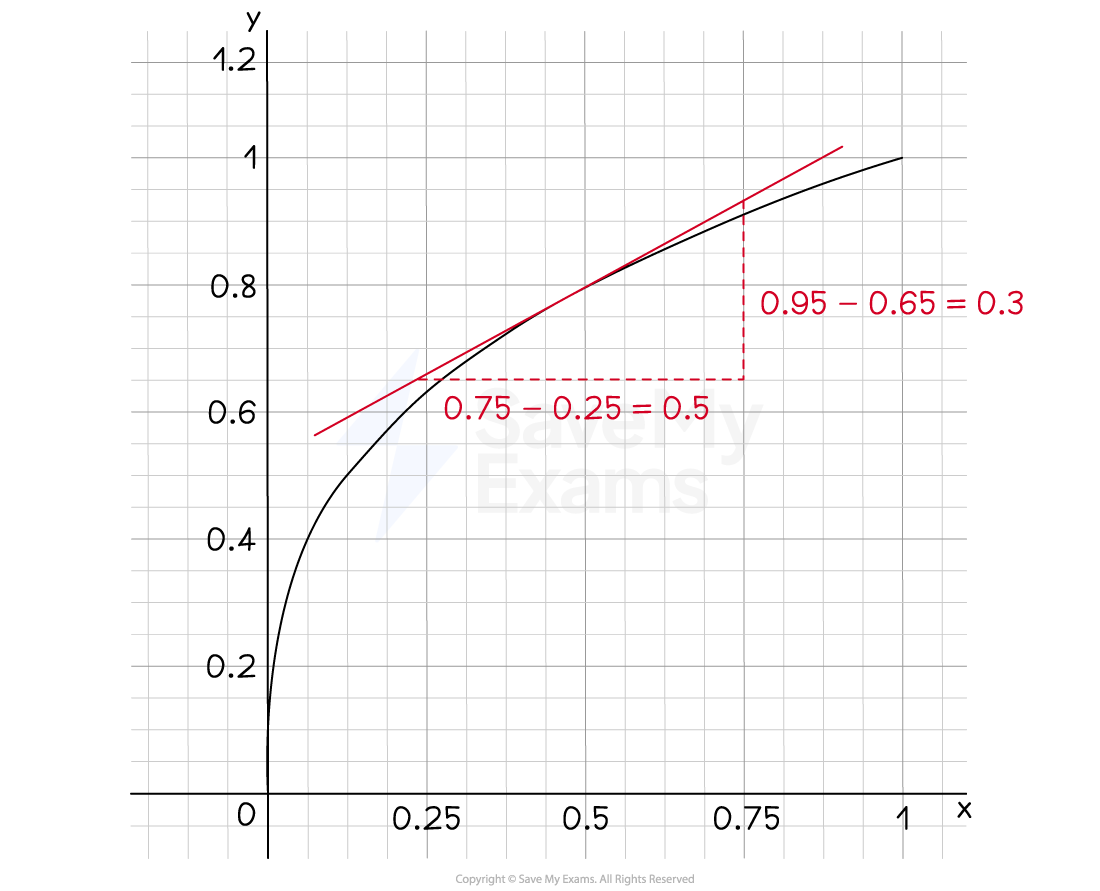
Estimating derivatives at a point using a table
How can I estimate a derivative at a point using a table?
The same method can be used as for a graph, but with a table of values instead
Recall that the derivative of at the point where , denoted as ,
is equal to the slope of the tangent to the graph of at
To approximate the slope of the tangent to the graph of at :
Find the average rate of change using points on either side of
Consider the table of values below for the function
is a continuous and differentiable function within this interval
This must be true to use this method
1 | -16 |
3 | -24 |
5 | -24 |
7 | -16 |
9 | 0 |
11 | 24 |
To find an estimate for :
Find the average rate of change between and
To find an estimate for :
Find the average rate of change between and
Examiner Tips and Tricks
In an exam, the question might ask you to estimate an instantaneous rate of change and give you a table with lots of values. According to the AP Calculus Chief Reader Reports, you are expected to estimate the derivative value using a difference quotient by drawing from the data in the table that most tightly bounds the specified point. This means you need to choose the two closest values. In every past FRQ, the test designers deliberately chose a target value that falls exactly in the middle of those two closest bounding points.
Worked Example
1 | 2 | 3 | 4 | 5 | |
0 | 4.5 | 7.2 | 9.1 | 12.4 |
Selected values of the differentiable function are given in the table above.
Use the data in the table to approximate . Show the computations that lead to your answer.
Answer:
Identify the value of the function at the values closest to
and
Calculate the average rate of change between these two points

Unlock more, it's free!
Join the 100,000+ Students that ❤️ Save My Exams
the (exam) results speak for themselves:

Was this revision note helpful?
Build on this topic
