Riemann Sums (College Board AP® Calculus AB): Revision Note

What is a Riemann sum?
A Riemann sum is a method for approximating the exact value of an accumulation of change
Equivalently, it is a method for approximating the exact value of a definite integral
Or the exact area between a curve and the x-axis
The approximation is made by adding up the areas of a number of rectangles
There are three types of Riemann sum you should know and be able to use:
Left Riemann sum
Right Riemann sum
Midpoint Riemann sum
Left Riemann sum
How do I calculate a left Riemann sum?
To calculate the left Riemann sum of a function between and (where ):
Divide the interval into subintervals by choosing values such that
The intervals do not need to be the same size
Let this define rectangles
The th rectangle has a width of
This is the distance from the left-hand side of the rectangle to the right-hand side
The th rectangle has a height of
This is the value of the function at the left-hand side of the rectangle
The left Riemann sum is the sum of the areas of these rectangles

In general, increasing the number of rectangles, , gives a more accurate approximation
On the exam you may just be given values of the function in a table, rather than being given the function explicitly
See the Worked Example
How can I tell if a left Riemann sum is an underestimate or an overestimate?
If a function is increasing over the interval for which a left Riemann sum is being calculated
then the left Riemann sum will be an underestimate
If a function is decreasing over the interval for which a left Riemann sum is being calculated
then the left Riemann sum will be an overestimate

If a function has both increasing and decreasing portions, then it is not immediately obvious whether a Riemann sum will be an underestimate or an overestimate
Worked Example
A social sciences researcher is using a function to model the total mass of all the garden gnomes appearing on lawns in a particular neighborhood at time . The function is twice-differentiable, with measured in kilograms and measured in days.
The table below gives selected values of , the rate of change of the mass, over the time interval . At time , kilograms.
(days) | 0 | 3 | 7 | 10 | 12 |
(kilograms per day) | 2.6 | 4.8 | 12.2 | 0.7 | -1.3 |
(a) Use a left Riemann sum with the four subintervals indicated in the table to estimate the change in the total mass of garden gnomes between and .
(b) Hence find an estimate for the total mass of the garden gnomes at .
Answer:
(a)
The Riemann sum will be based on four rectangles
The first rectangle will have a width of (3-0) and a height equal to
The second rectangle will have a width of (7-3) and a height equal to
The third rectangle will have a width of (10-7) and a height equal to
The fourth rectangle will have a width of (12-10) and a height equal to
This has units of kilograms, because each term is the product of a 'kg/day' quantity and a 'days' quantity
The mass of garden gnomes increases by approximately 65.0 kg between and
(b)
The answer to part (a) only shows the change in mass
To find the estimate for the total final mass, add the initial mass of 24.9 kilograms
89.9 kg
Right Riemann sum
How do I calculate a right Riemann sum?
To calculate the right Riemann sum of a function between and (where ):
Divide the interval into subintervals by choosing values such that
The intervals do not need to be the same size
Let this define rectangles
The th rectangle has a width of
This is the distance from the left-hand side of the rectangle to the right-hand side
The th rectangle has a height of
This is the value of the function at the right-hand side of the rectangle
The right Riemann sum is the sum of the areas of these rectangles
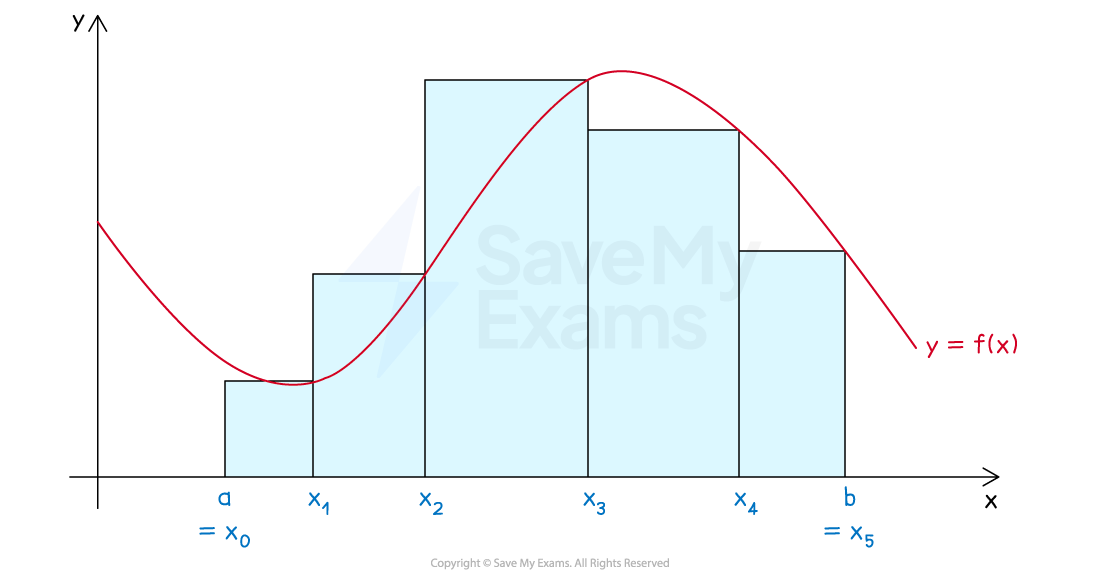
In general, increasing the number of rectangles, , gives a more accurate approximation
On the exam you may just be given values of the function in a table, rather than being given the function explicitly
See the Worked Example
How can I tell if a right Riemann sum is an underestimate or an overestimate?
If a function is increasing over the interval for which a right Riemann sum is being calculated
then the right Riemann sum will be an overestimate
If a function is decreasing over the interval for which a right Riemann sum is being calculated
then the right Riemann sum will be an underestimate

If a function has both increasing and decreasing portions, then it is not immediately obvious whether a Riemann sum will be an underestimate or an overestimate
Worked Example
A social sciences researcher is using a function to model the total mass of all the garden gnomes appearing on lawns in a particular neighborhood at time . The function is twice-differentiable, with measured in kilograms and measured in days.
The table below gives selected values of , the rate of change of the mass, over the time interval . At time , kilograms.
(days) | 0 | 3 | 7 | 10 | 12 |
(kilograms per day) | 2.6 | 4.8 | 12.2 | 0.7 | -1.3 |
Use a right Riemann sum with the four subintervals indicated in the table to find an estimate for the total mass of the garden gnomes at .
Answer:
The Riemann sum will be based on four rectangles
The first rectangle will have a width of (3-0) and a height equal to
The second rectangle will have a width of (7-3) and a height equal to
The third rectangle will have a width of (10-7) and a height equal to
The fourth rectangle will have a width of (12-10) and a height equal to
This has units of kilograms, because each term is the product of a 'kg/day' quantity and a 'days' quantity
However that answer only approximates the change in mass
To find the estimate for the total final mass, add the initial mass of 24.9 kilograms
The total mass of garden gnomes at is approximately 87.6 kg
Midpoint Riemann sum
How do I calculate a midpoint Riemann sum?
To calculate the midpoint Riemann sum of a function between and (where ):
Divide the interval into subintervals by choosing values such that
The intervals do not need to be the same size
Let this define rectangles
The th rectangle has a width of
This is the distance from the left-hand side of the rectangle to the right-hand side
The th rectangle has a height of
This is the value of the function at the midpoint of the rectangle
The midpoint Riemann sum is the sum of the areas of these rectangles

Examiner Tips and Tricks
Note that you take the function of the midpoint of the values. You do not take the midpoint of the values of the function. The midpoint of the values of the function are used in the trapezoidal sum.
It is not immediately obvious whether a midpoint Riemann sum will give an underestimate or an overestimate
The rectangles often combine an underestimate on one side of their midpoint line, and an overestimate on the other side
In general, increasing the number of rectangles, , gives a more accurate approximation
On the exam you may just be given values of the function in a table, rather than being given the function explicitly
See the Worked Example
Worked Example
A social sciences researcher is using a function to model the total mass of all the garden gnomes appearing on lawns in a particular neighborhood at time . The function is twice-differentiable, with measured in kilograms and measured in days.
The table below gives selected values of , the rate of change of the mass, over the time interval . At time , kilograms.
(days) | 0 | 1.5 | 3 | 5 | 7 | 8.5 | 10 | 11 | 12 |
(kg/ day) | 2.6 | 3.5 | 4.8 | 9.1 | 12.2 | 5.2 | 0.7 | -0.1 | -1.3 |
Use a midpoint Riemann sum to find an estimate for the total mass of the garden gnomes at . Use four subintervals to calculate the sum, for subintervals of between 0 and 3, 3 and 7, 7 and 10, and 10 and 12.
Answer:
Note that 1.5, 5, 8.5 and 11 are the midpoints of the intervals 0-3, 3-7, 7-10 and 10-12, respectively
The Riemann sum will be based on four rectangles
The first rectangle will have a width of (3-0) and a height equal to
The second rectangle will have a width of (7-3) and a height equal to
The third rectangle will have a width of (10-7) and a height equal to
The fourth rectangle will have a width of (12-10) and a height equal to
This has units of kilograms, because each term is the product of a 'kg/day' quantity and a 'days' quantity
However that answer only approximates the change in mass
To find the estimate for the total final mass, add the initial mass of 24.9 kilograms
The total mass of garden gnomes at is approximately 87.2 kg

Unlock more, it's free!
Join the 100,000+ Students that ❤️ Save My Exams
the (exam) results speak for themselves:

Was this revision note helpful?
Build on this topic
